Articles — InterMarketEdge

Articles

Financial intelligence, macro research, and inter-market analysis.

XAUUSD - Wave (4) Running After the 5,100 Peak Confirmed, 4,296 Broken and Price Seeking Its Floor at 3,797-3,881

XAUUSD - Wave (4) Running After the 5,100 Peak Confirmed, 4,296 Broken and Price Seeking Its Floor at 3,797-3,881

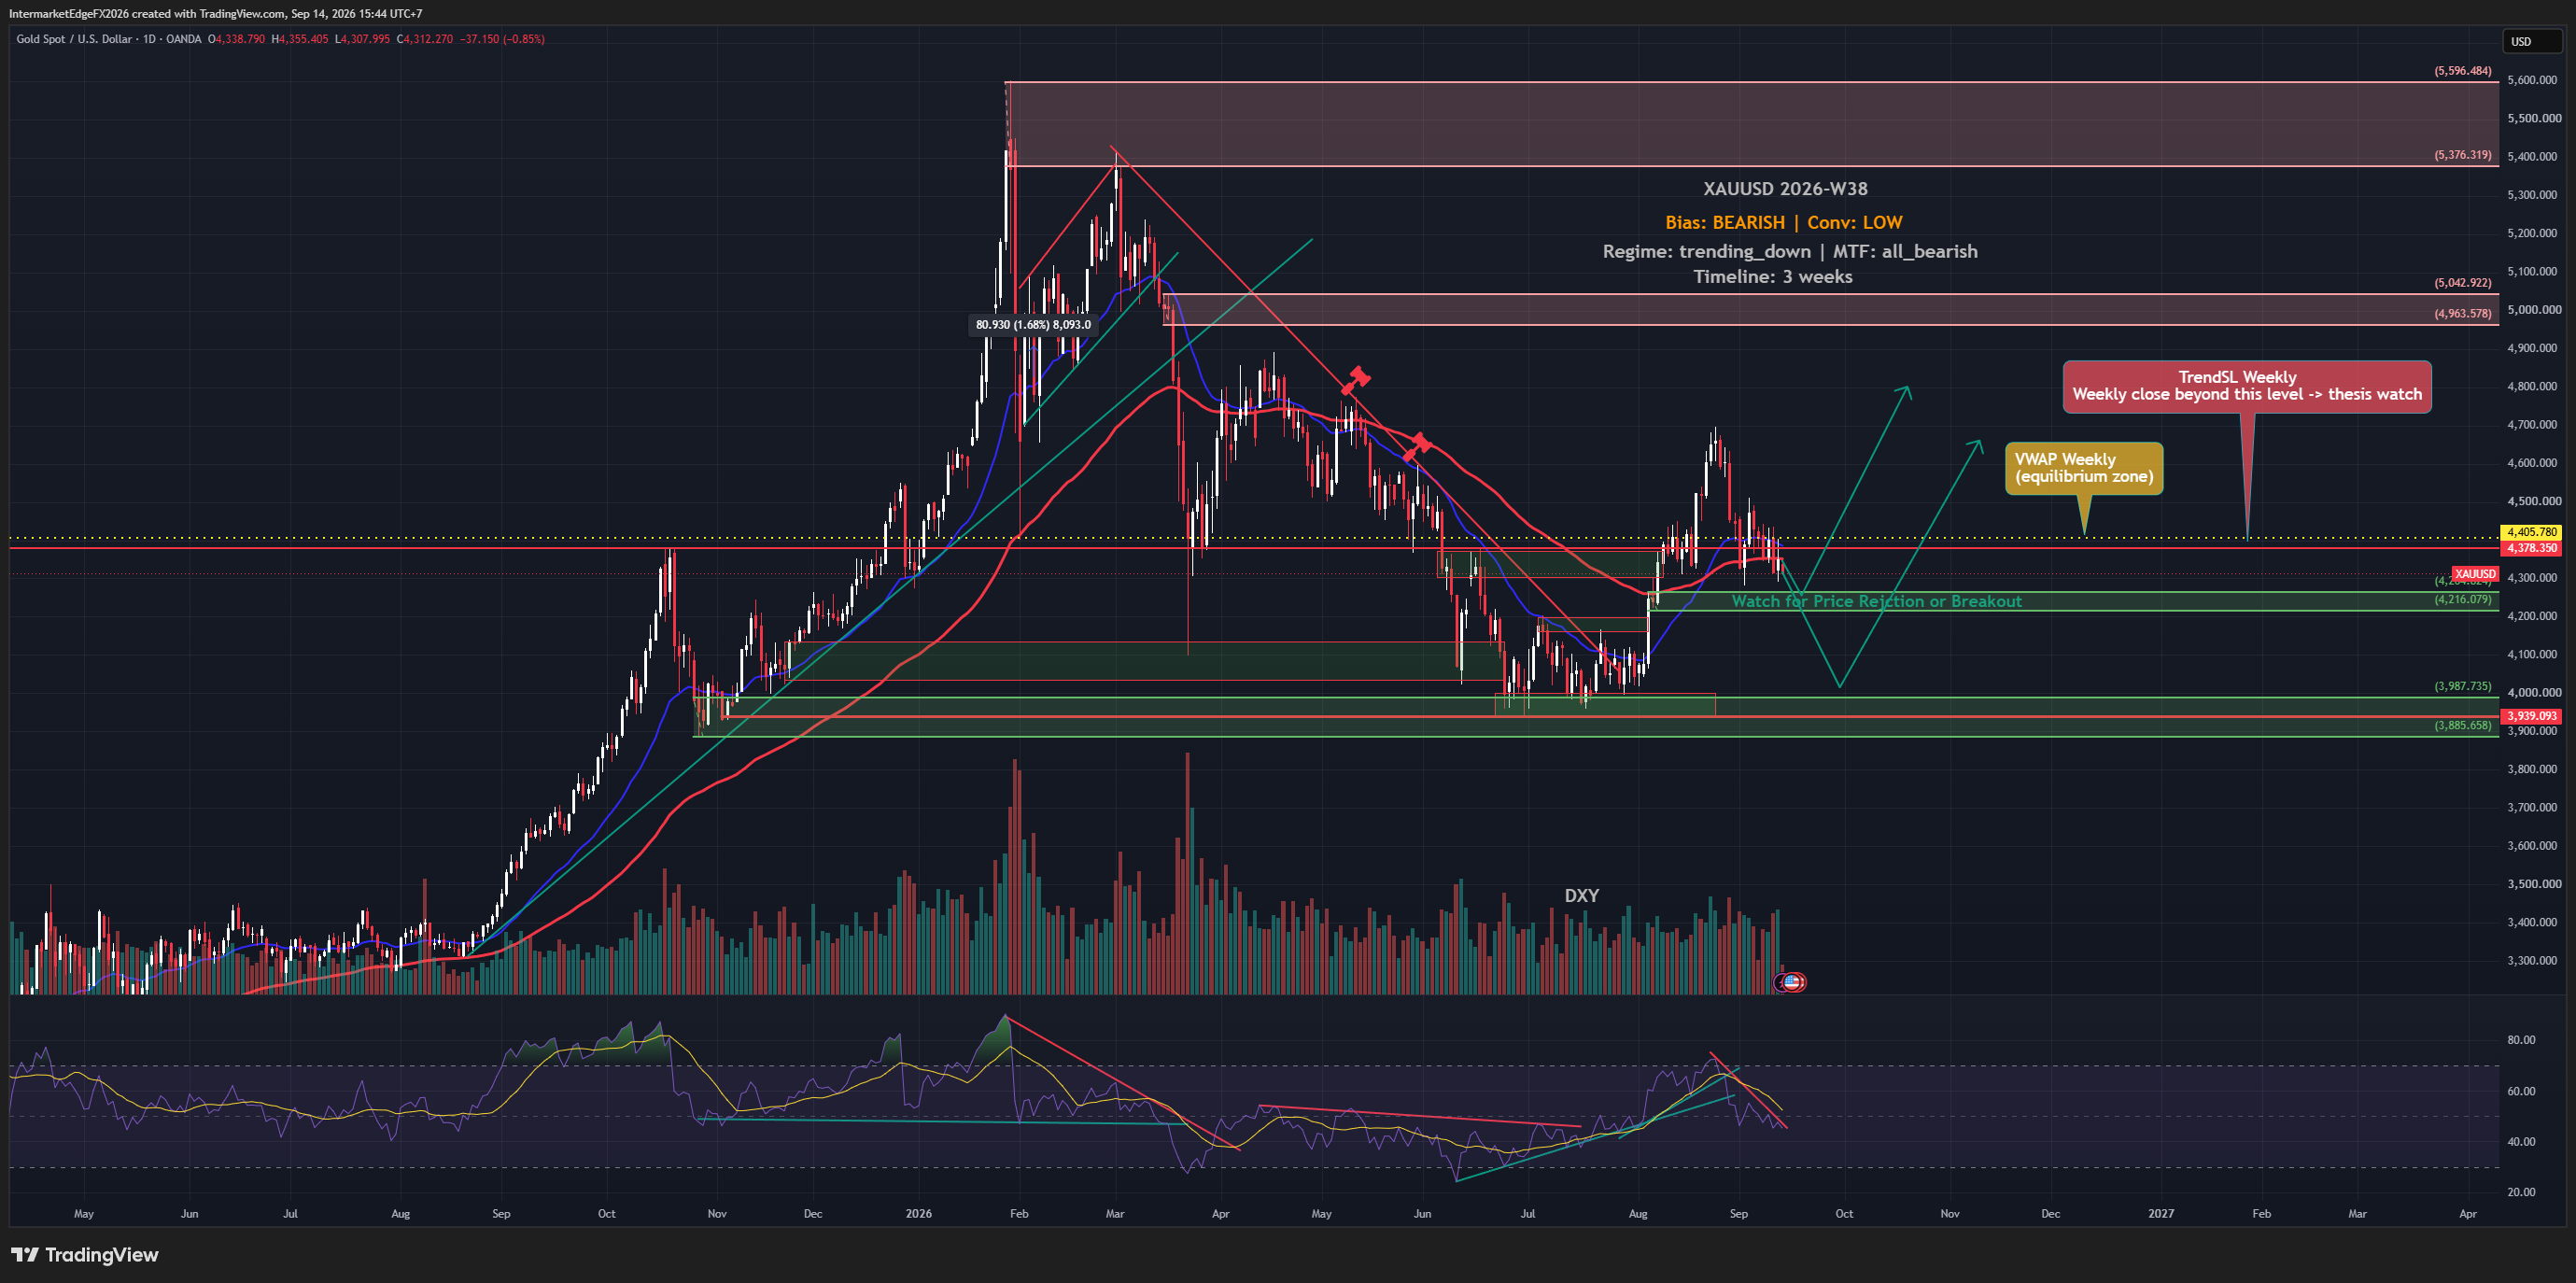
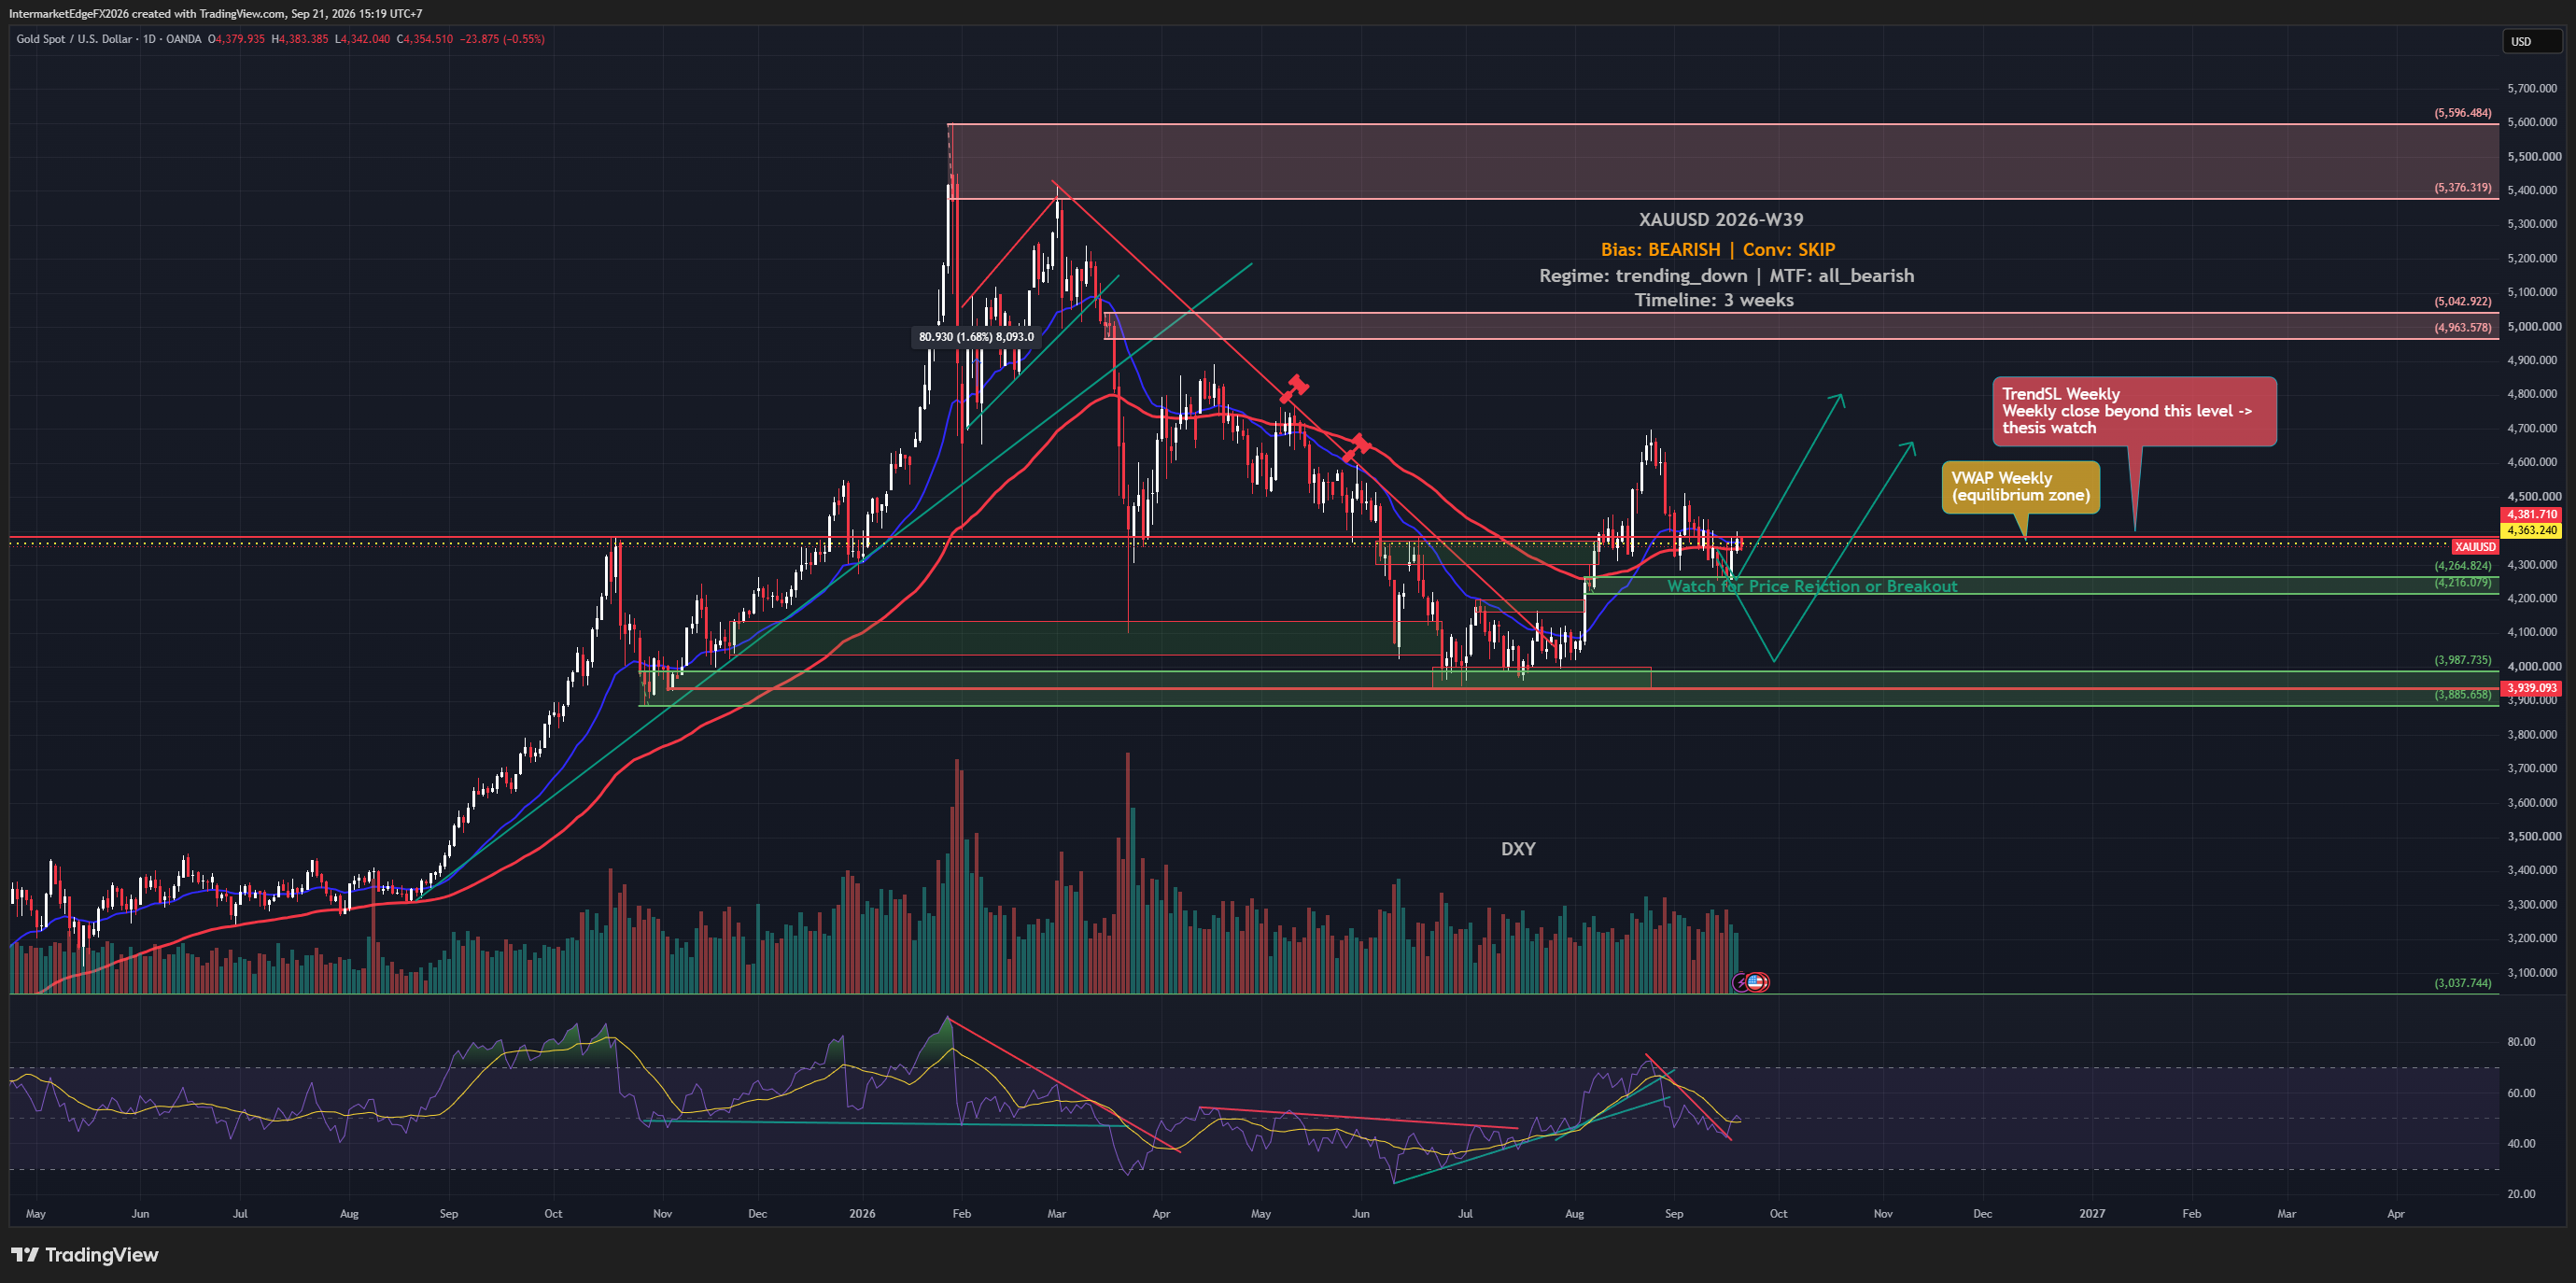
XAUUSD - SUMMARY 29/06/2026 Regime: Wave (4) In Progress, Medium Bear. XAUUSD 4,023.995 (-1.57%), the 4,296-4,381 support zone broke this week. Following wave 3 completion at the ~5,100 peak (April 2026), gold is executing a wave (4) structural correction with four forces aligned bearish. Bias: Medium Bear, wave (4) in progress. Four bearish drivers: actual real yield +0.172% (pipeline 1.972% wrong -- uses stale CPI 2.4%; actual 4.2%), Fed Warsh hawkish hold (H2 2026 hike not excluded), DXY structurally bullish (wave (5) targeting 103-104, inverse relationship with gold active), risk-on SPX +0.68% VIX 18.7 (reduced safe-haven demand). XAGUSD -1.68% declining faster than gold confirms structural bearish trend. Data corrections: CPI 4.2% (not 2.4%); real yield +0.172% (not 1.972%); JP10Y 2.63% (not 1.47%); ECB neutral 2.00% (not cutting 2.50%). D1 structure: 4,296-4,381 broken, flipped to resistance. Wave (4) target: 3,881 (Fib 0.382) then 3,797. RSI ~34 near oversold may generate technical bounce toward 4,100-4,200 without altering structure. Extended wave (4): 3,500-3,600. Invalidation: daily close above 4,296. Hard invalidation: below 2,997. Scenarios: wave (4) continues to 3,797-3,881 (55%); bounce to 4,100-4,200 then resumes (25%); NFP miss + geopolitical spike reclaims 4,296 (15%); extended to 3,500-3,600 (5%). Do not buy the dip before NFP 3 July. Wait for reversal signals at 3,797-3,881. For informational purposes only. Not financial advice.

DXY - Wave (4) Absorbing After Completing a 13-Month High, NFP on 3 July Is the Decisive Catalyst for Wave (5)

DXY - Wave (4) Absorbing After Completing a 13-Month High, NFP on 3 July Is the Decisive Catalyst for Wave (5)

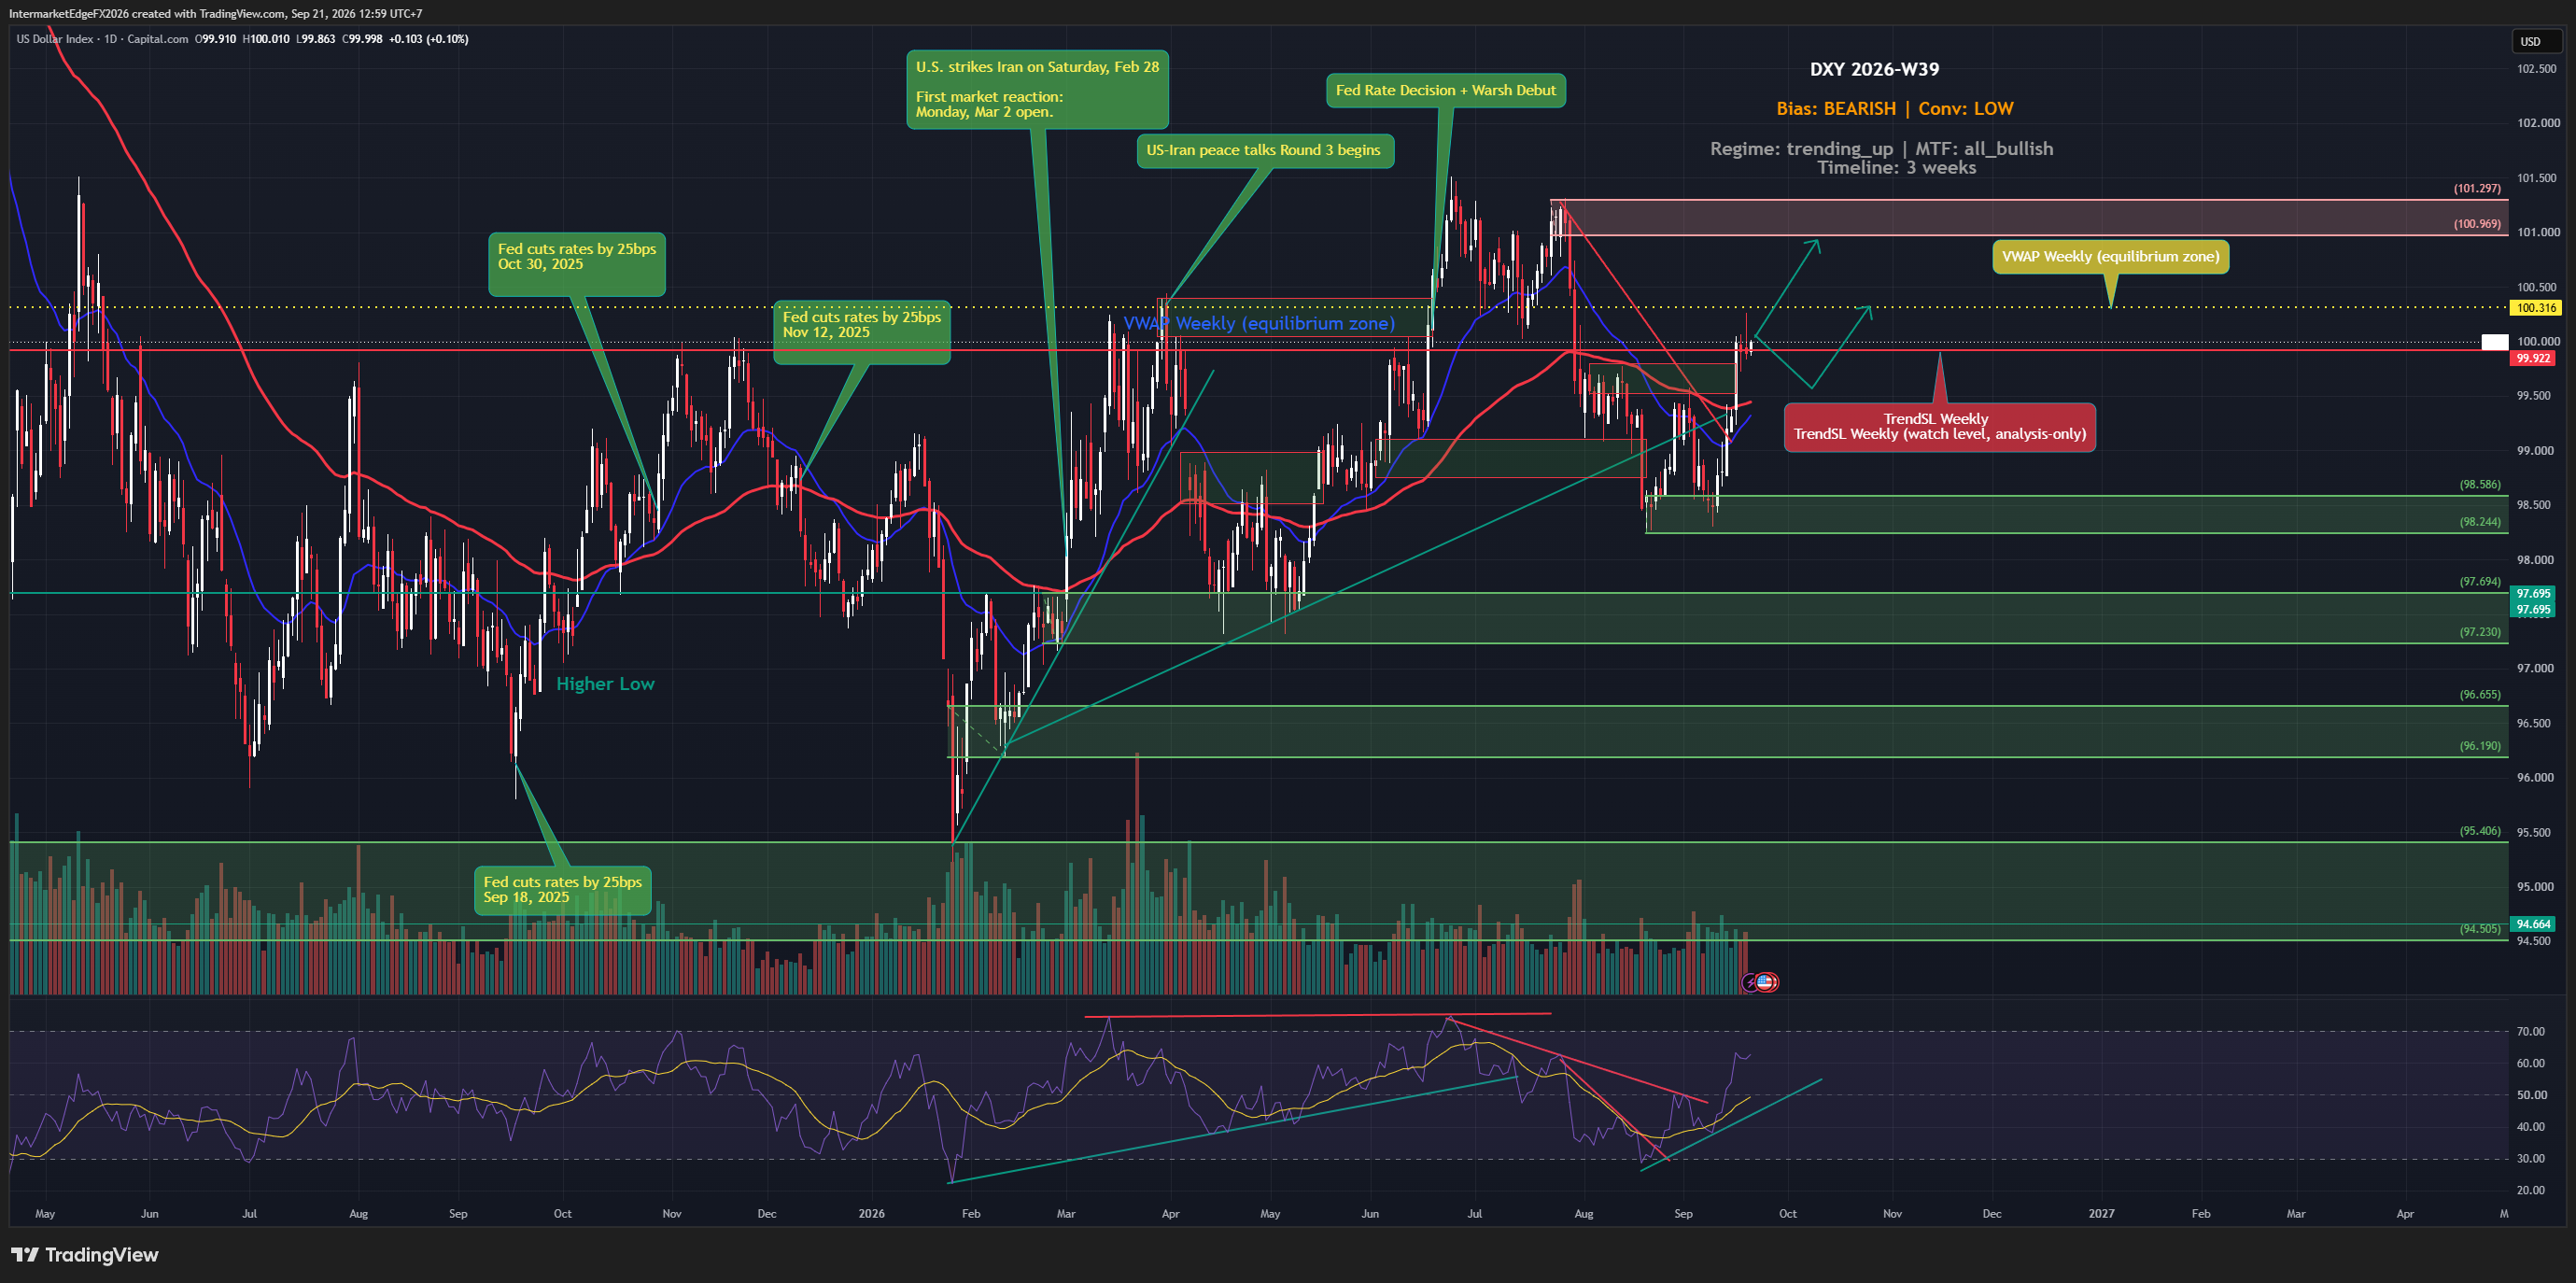
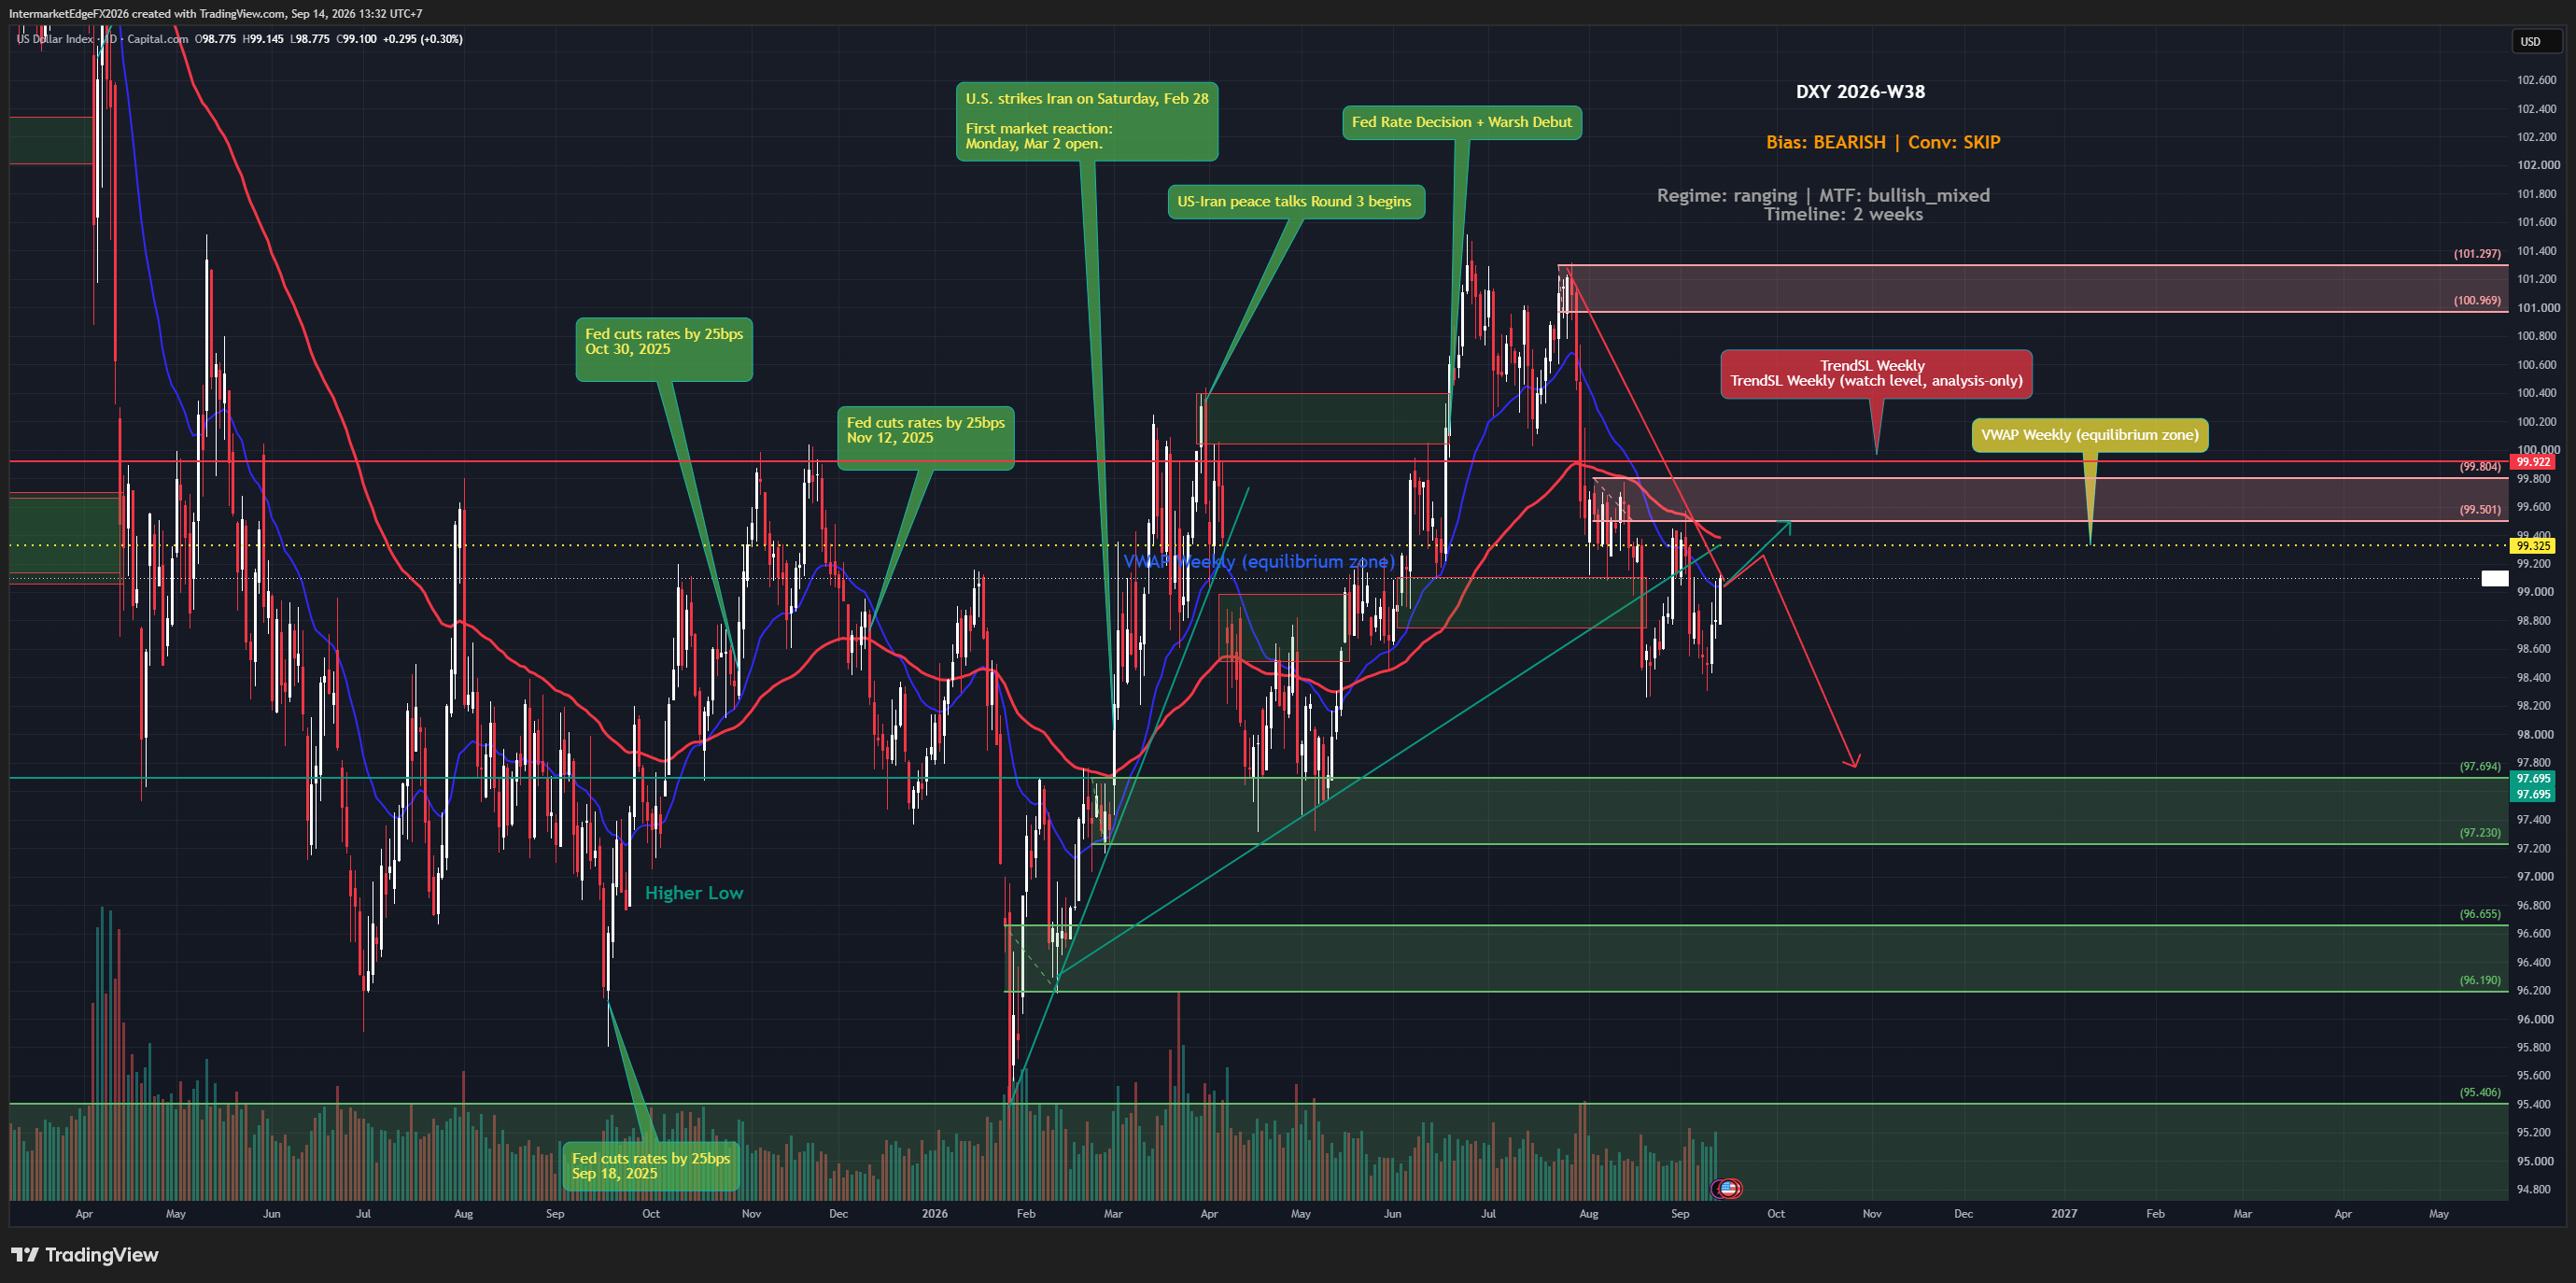
DXY - SUMMARY 29/06/2026 Regime: Wave (4) Absorbing, Neutral Near Term, Bullish Medium Term. DXY 101.019, pulled back from wave (3) high at 104.2 -- a 13-month high -- to 100.6 last week then bounced modestly to 101.0. Elliott five-wave structure intact. Declining volume in the pullback confirms correction, not reversal. Bias: Medium-High Bull medium term. Neutral within current wave (4). Macro foundation: US CPI actual 4.2% (pipeline 2.4% stale), Fed Warsh hawkish hold, rate differential +225bps vs EUR (ECB 2.00% neutral hold), +325bps vs JPY (BoJ 1.00%). US10Y 4.372%, yield curve steepening +27bps, real yield +0.172%. Data corrections: JP10Y 2.63% (not 1.47%); US-JP spread 1.742% (not 2.924%); DE10Y 2.85% (not 2.99%); ECB neutral 2.00% (not cutting 2.50%). D1 structure: wave (4) absorption zone 99.6 (Fib 0.382) to 99.1 (Fib 0.5). Resistance: 101.5 / 102.0 / 102.5. Support: 100.48 (Higher Low) / 99.6 / 99.1 / 98.0. Wave (5) target 103-104.5. Extended: 106. Invalidation: 97.695. Scenarios: test 99.6-99.1 then wave (5) 103-104.5 (60%); low already printed at 100.6, break of 102.0 = early wave (5) (30%); NFP miss, below 98 (10%). Event risk: Chicago PMI 30 June, ADP 1 July, NFP 3 July -- decisive catalyst. Above 220K = early wave (5) trigger. Do not chase before NFP. For informational purposes only. Not financial advice.

USDJPY - Wave (5) Exhaustion Confirmed as Price Failed to Break 161.94 for an Entire Week, Tokyo CPI Beat Gives the BoJ More Ammunition

USDJPY - Wave (5) Exhaustion Confirmed as Price Failed to Break 161.94 for an Entire Week, Tokyo CPI Beat Gives the BoJ More Ammunition

USDJPY 161.651 | Wave (5) exhaustion confirmed, Tokyo CPI beats | 26 June 2026 Last week: "Wave (5) exhaustion at the intervention ceiling, expect correction to 155-157." One week later: price stood at 161.6, unable to break 161.94 despite DXY at a 13-month high. Exhaustion is no longer speculation. Then Tokyo CPI June released today. Core-core 1.9% y/y, beat 1.8% forecast, up from 1.6%. The BoJ has fresh ammunition to hike again. Yen-supportive. DXY pulled back from 101.5 to 100.6. VIX jumped to 20.20 (+7.1%). Risk-off intensifying, carry-unwind pressure. Pipeline showed wrong numbers. JP10Y: 1.47% (actual 2.600%). US-JP spread: 2.924% (actual 1.790%). BoJ: "Hold" (actual: hiked to 1.00%). D1 structure: wave (5) at the 161.94 ceiling, failed to break after one full week. Correction targets: 158.953 (0.382), 155.244 (0.5), 153.5 (0.618). Extension if breaks 161.94: 164. Invalidation: below 152. Three scenarios: → Correction (a)(b)(c) to 155-157. Probability: 40% → MOF intervention, sharp drop to 155 then 152. Probability: 25% → DXY bounces, breaks 161.94, extension to 164. Probability: 20% The tell: one week at the ceiling, it didn't break. Then the BoJ's data came in hot. Exhaustion confirmed. Conviction: Medium Bear near-term (shifted from Med Bull correction lean). --- Intermarket Edge | Institutional Macro & Intermarket Analysis For informational purposes only. Not financial advice.

USDCAD - CAD Hits a 14-Month Low as Oil Breaks Below $70 and DXY Holds a 13-Month High, a Double Squeeze Drives Wave (3) Toward 1.4447

USDCAD - CAD Hits a 14-Month Low as Oil Breaks Below $70 and DXY Holds a 13-Month High, a Double Squeeze Drives Wave (3) Toward 1.4447

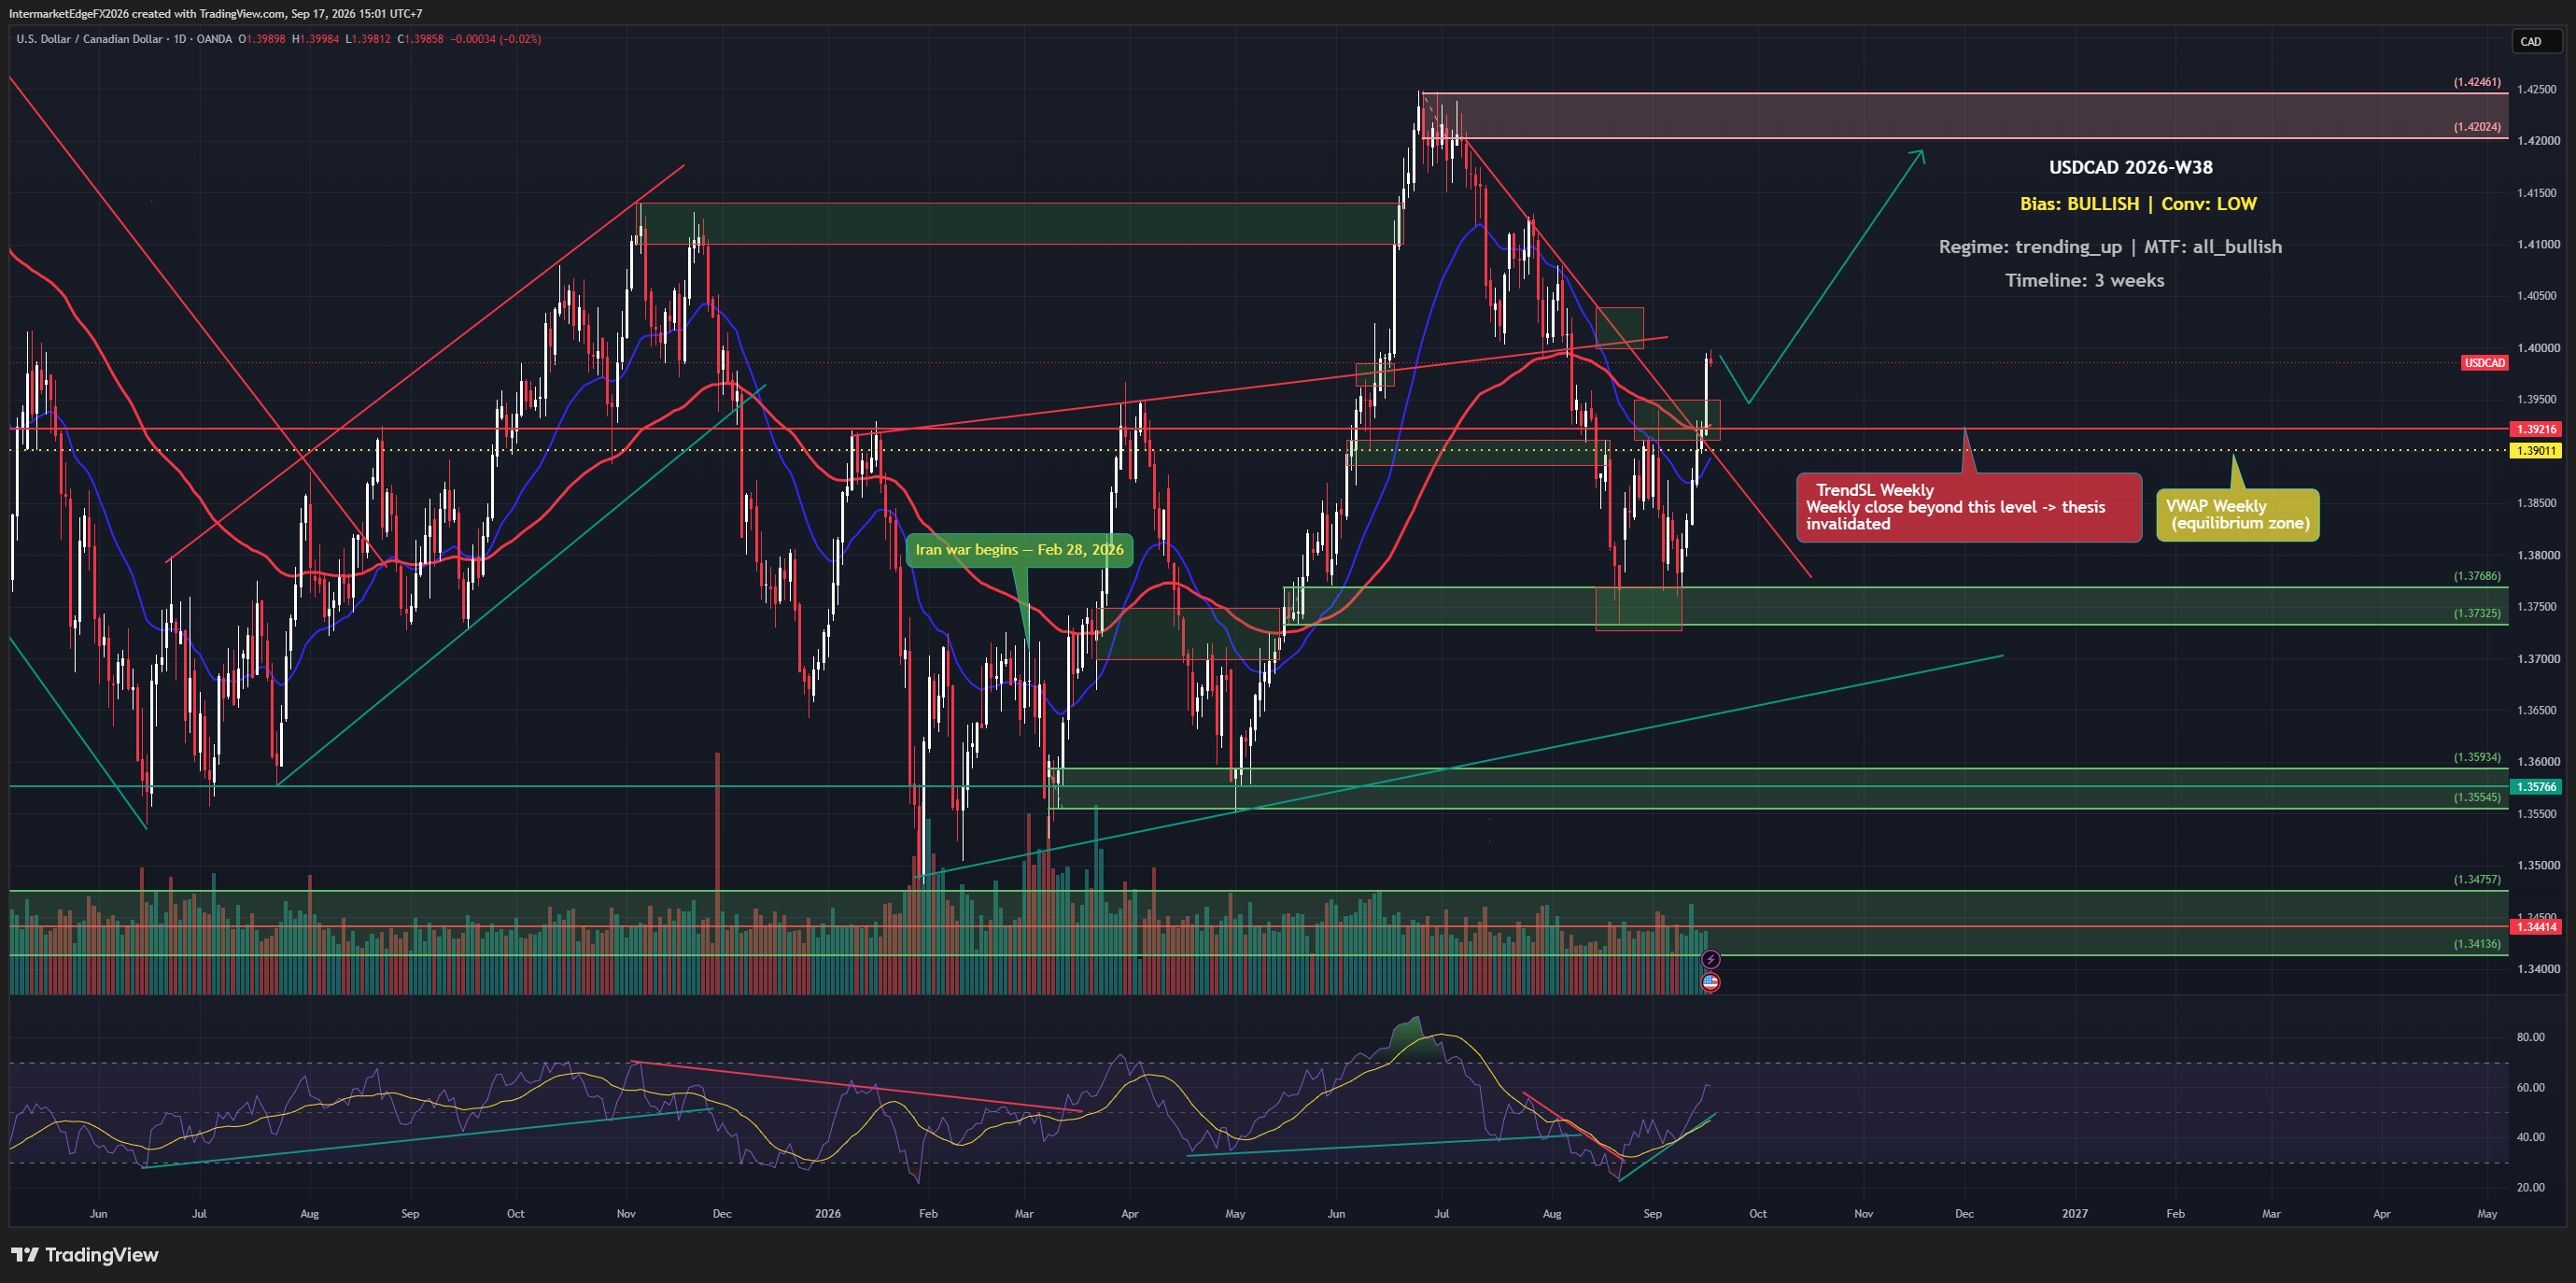
USDCAD 1.4232 | Double squeeze: 13-month DXY high + oil below $70 | 25 June 2026 CAD hits a 14-month low, pressured from both sides simultaneously. USD leg: 13-month high post-hawkish FOMC. CAD leg: oil broke below $70 and the pre-war 71.11 support. When both legs tilt the same way, this is the strongest bullish configuration. BoC Macklem today: not seeing spillovers from higher oil prices into CPI. Implicitly dovish, BoC in no hurry to hike. Canada benchmark yields slipping. CAD at a 14-month low as tech selloff drives safe-haven into USD. AUDUSD at 0.691, broad commodity FX weakness. CAD weakness is not idiosyncratic. D1 structure: wave (3) impulse running. Target 1.4447 then 1.4540. Support 1.4100 then 1.3993. Invalidation: below 1.3476. Three scenarios: → Wave (3) continues to 1.4447 then 1.4540. Probability: 45% → Sub-wave 4 correction to 1.40 then resumes. Probability: 25% → Oil bounces + dovish Fed, drops to 1.39. Probability: 15% The tell: both legs tilting simultaneously. DXY strongest in 13 months, CAD weakest in 14. Not a coincidence. A double squeeze. Conviction: High Bull (upgraded from Med-High). --- Intermarket Edge | Institutional Macro & Intermarket Analysis For informational purposes only. Not financial advice.

USOIL - Below $71 Confirms the War Premium Fully Erased, Persian Gulf Flows Accelerate as the Market Shrugs Off a -6M Draw

USOIL - Below $71 Confirms the War Premium Fully Erased, Persian Gulf Flows Accelerate as the Market Shrugs Off a -6M Draw

USOIL $69.36 | Below $71, war premium fully erased | 25 June 2026 Last week: "Do not chase shorts into 71.11. A break confirms a further leg, target 67 then 63." It broke. Oil now $69.36, below the pre-war starting point. The most notable signal: the EIA drew 6.088M (forecast just 3.9M), the second consecutive larger-than-expected draw. The market shrugged it off entirely. Oil kept falling. When good news is ignored, the selling force dominates. Three forces: Persian Gulf flows accelerating as Hormuz reopens; global supply recovering + OPEC+ +411kbpd; DXY 101 at a 13-month high. Leading headlines: "Oil Sinks Toward Pre-War Levels", "Crude Oil Falls Below $70", "Oil Market Shrugs Off Large Crude Stock Draw." D1 structure: 71.11 broken (now resistance). Nearby support 67.05 then 63.57 then 62.77. Deep: 57.60 (pre-war bottom). Invalidation: daily close above 74.49. Three scenarios: → Continued decline to 67.05 then 63.57. Probability: 45% → Hormuz fully reopens, accelerates to 57.60. Probability: 25% → Technical bounce to test 71.11 (broken support), resumes lower. Probability: 20% The tell: two consecutive bullish draws, price still falls. The market has answered. Conviction: High Bear (upgraded from Medium Bear). --- Intermarket Edge | Institutional Macro & Intermarket Analysis For informational purposes only. Not financial advice.

EURJPY - Head and Shoulders Confirmed, the DE-JP Carry Collapses to 0.21% as Hawkish BoJ Meets Neutral ECB, Target Neckline 181 Then 171

EURJPY - Head and Shoulders Confirmed, the DE-JP Carry Collapses to 0.21% as Hawkish BoJ Meets Neutral ECB, Target Neckline 181 Then 171

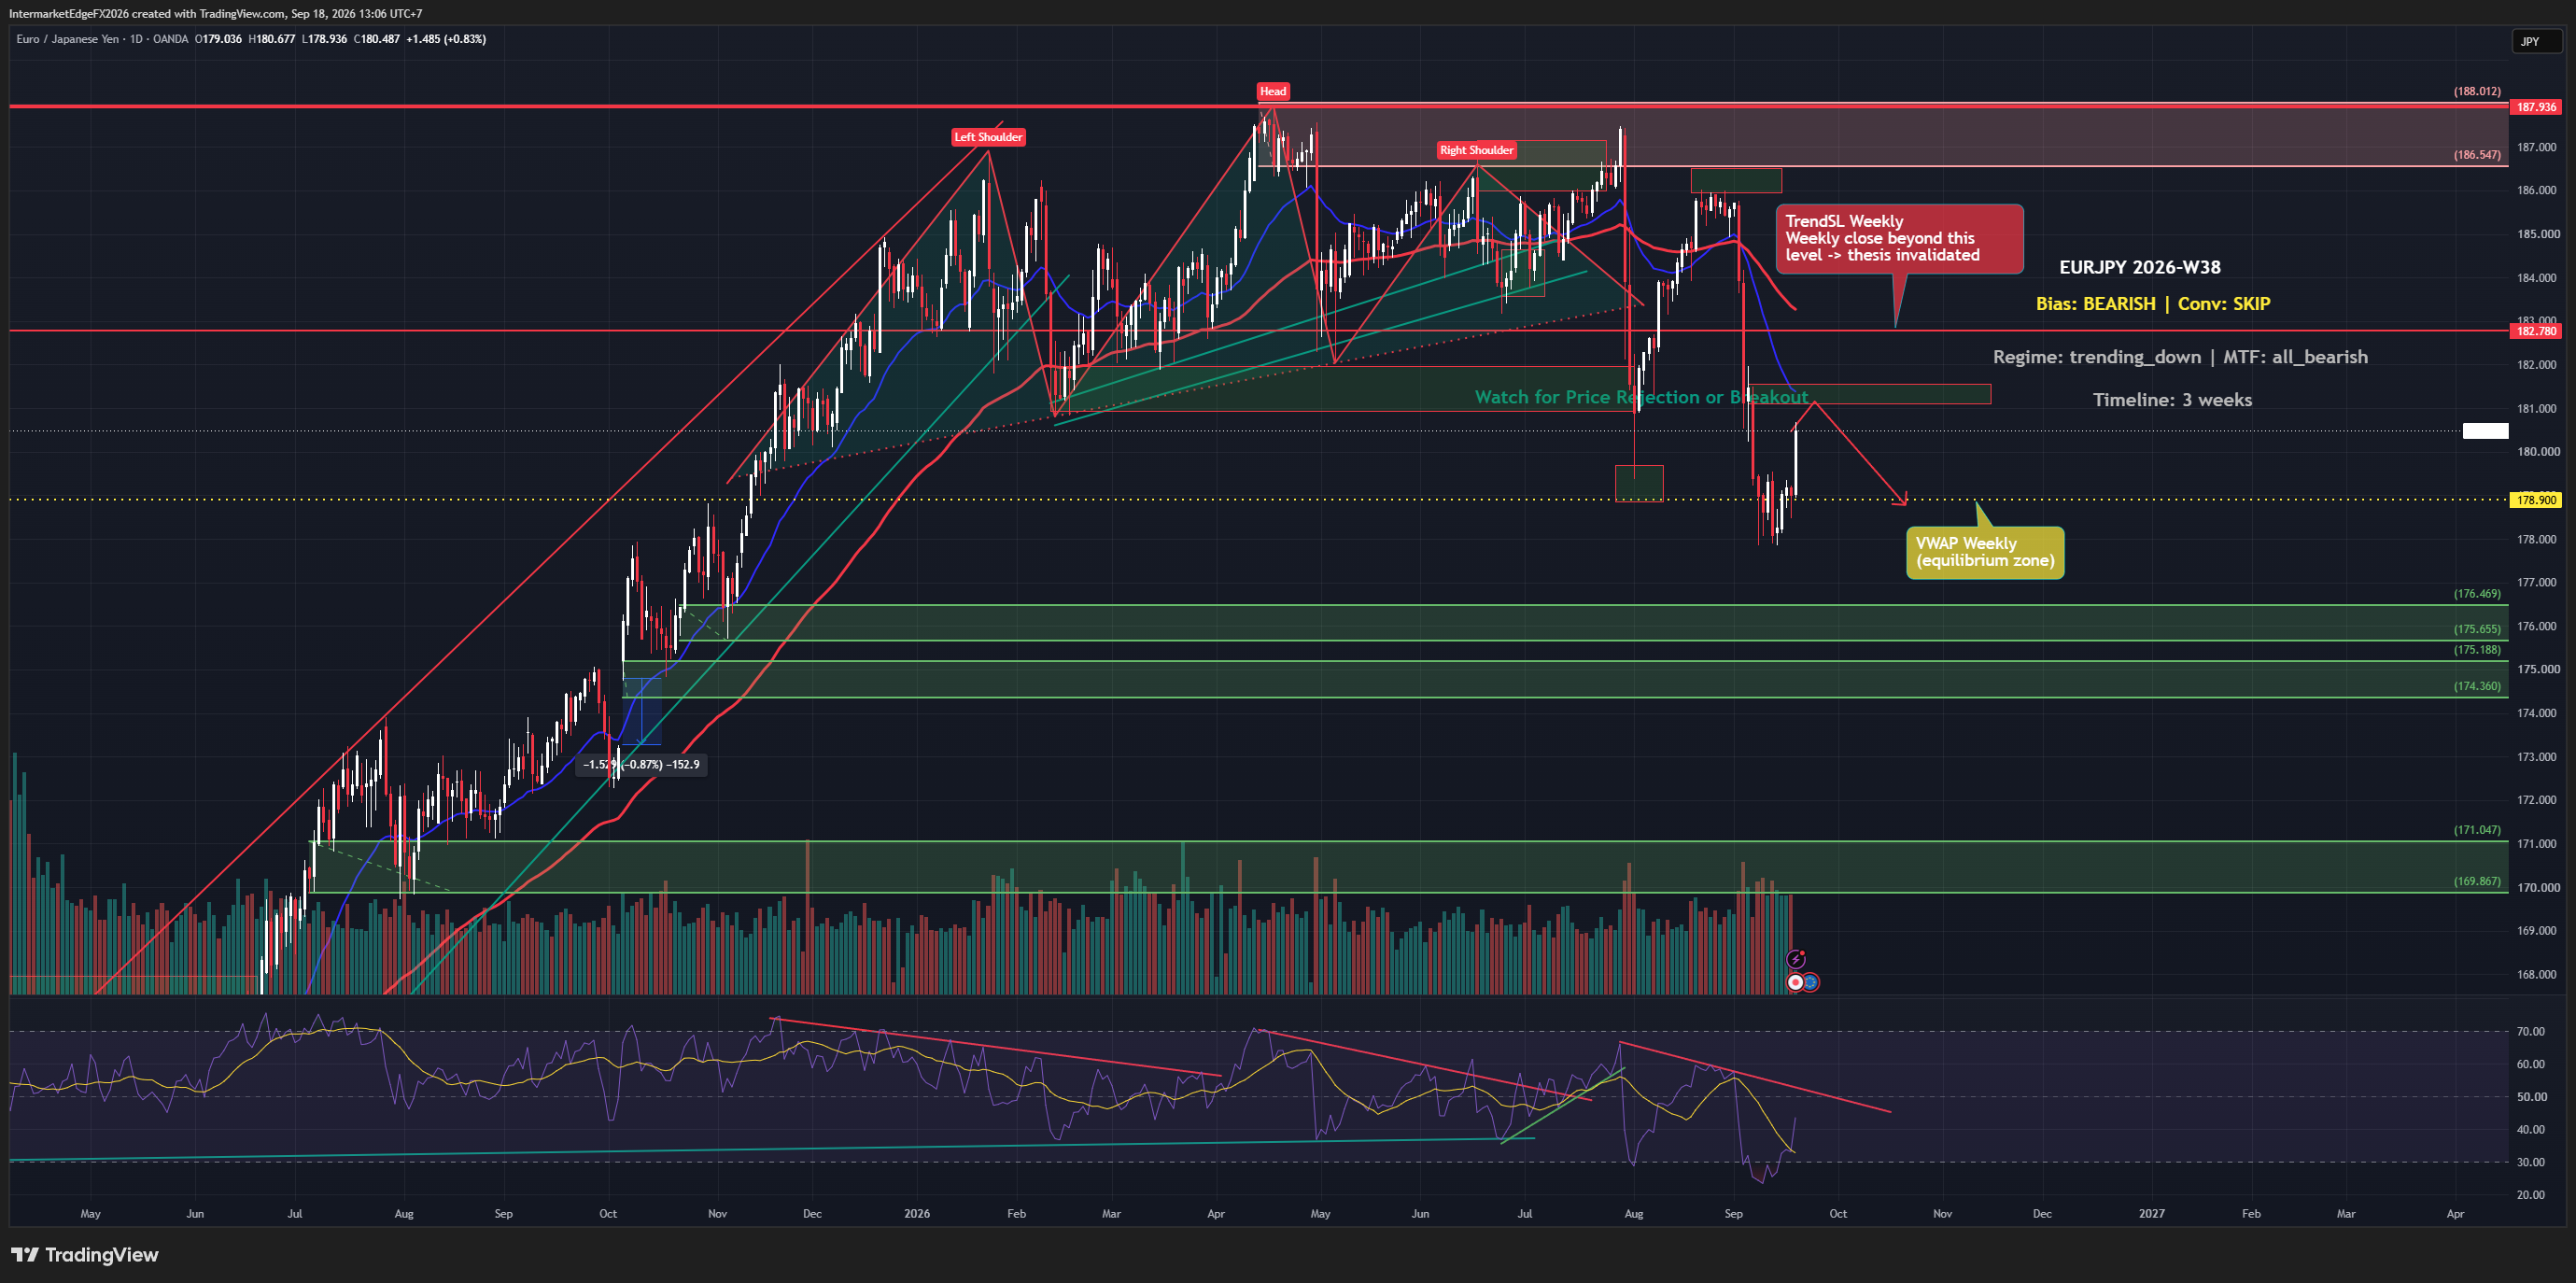
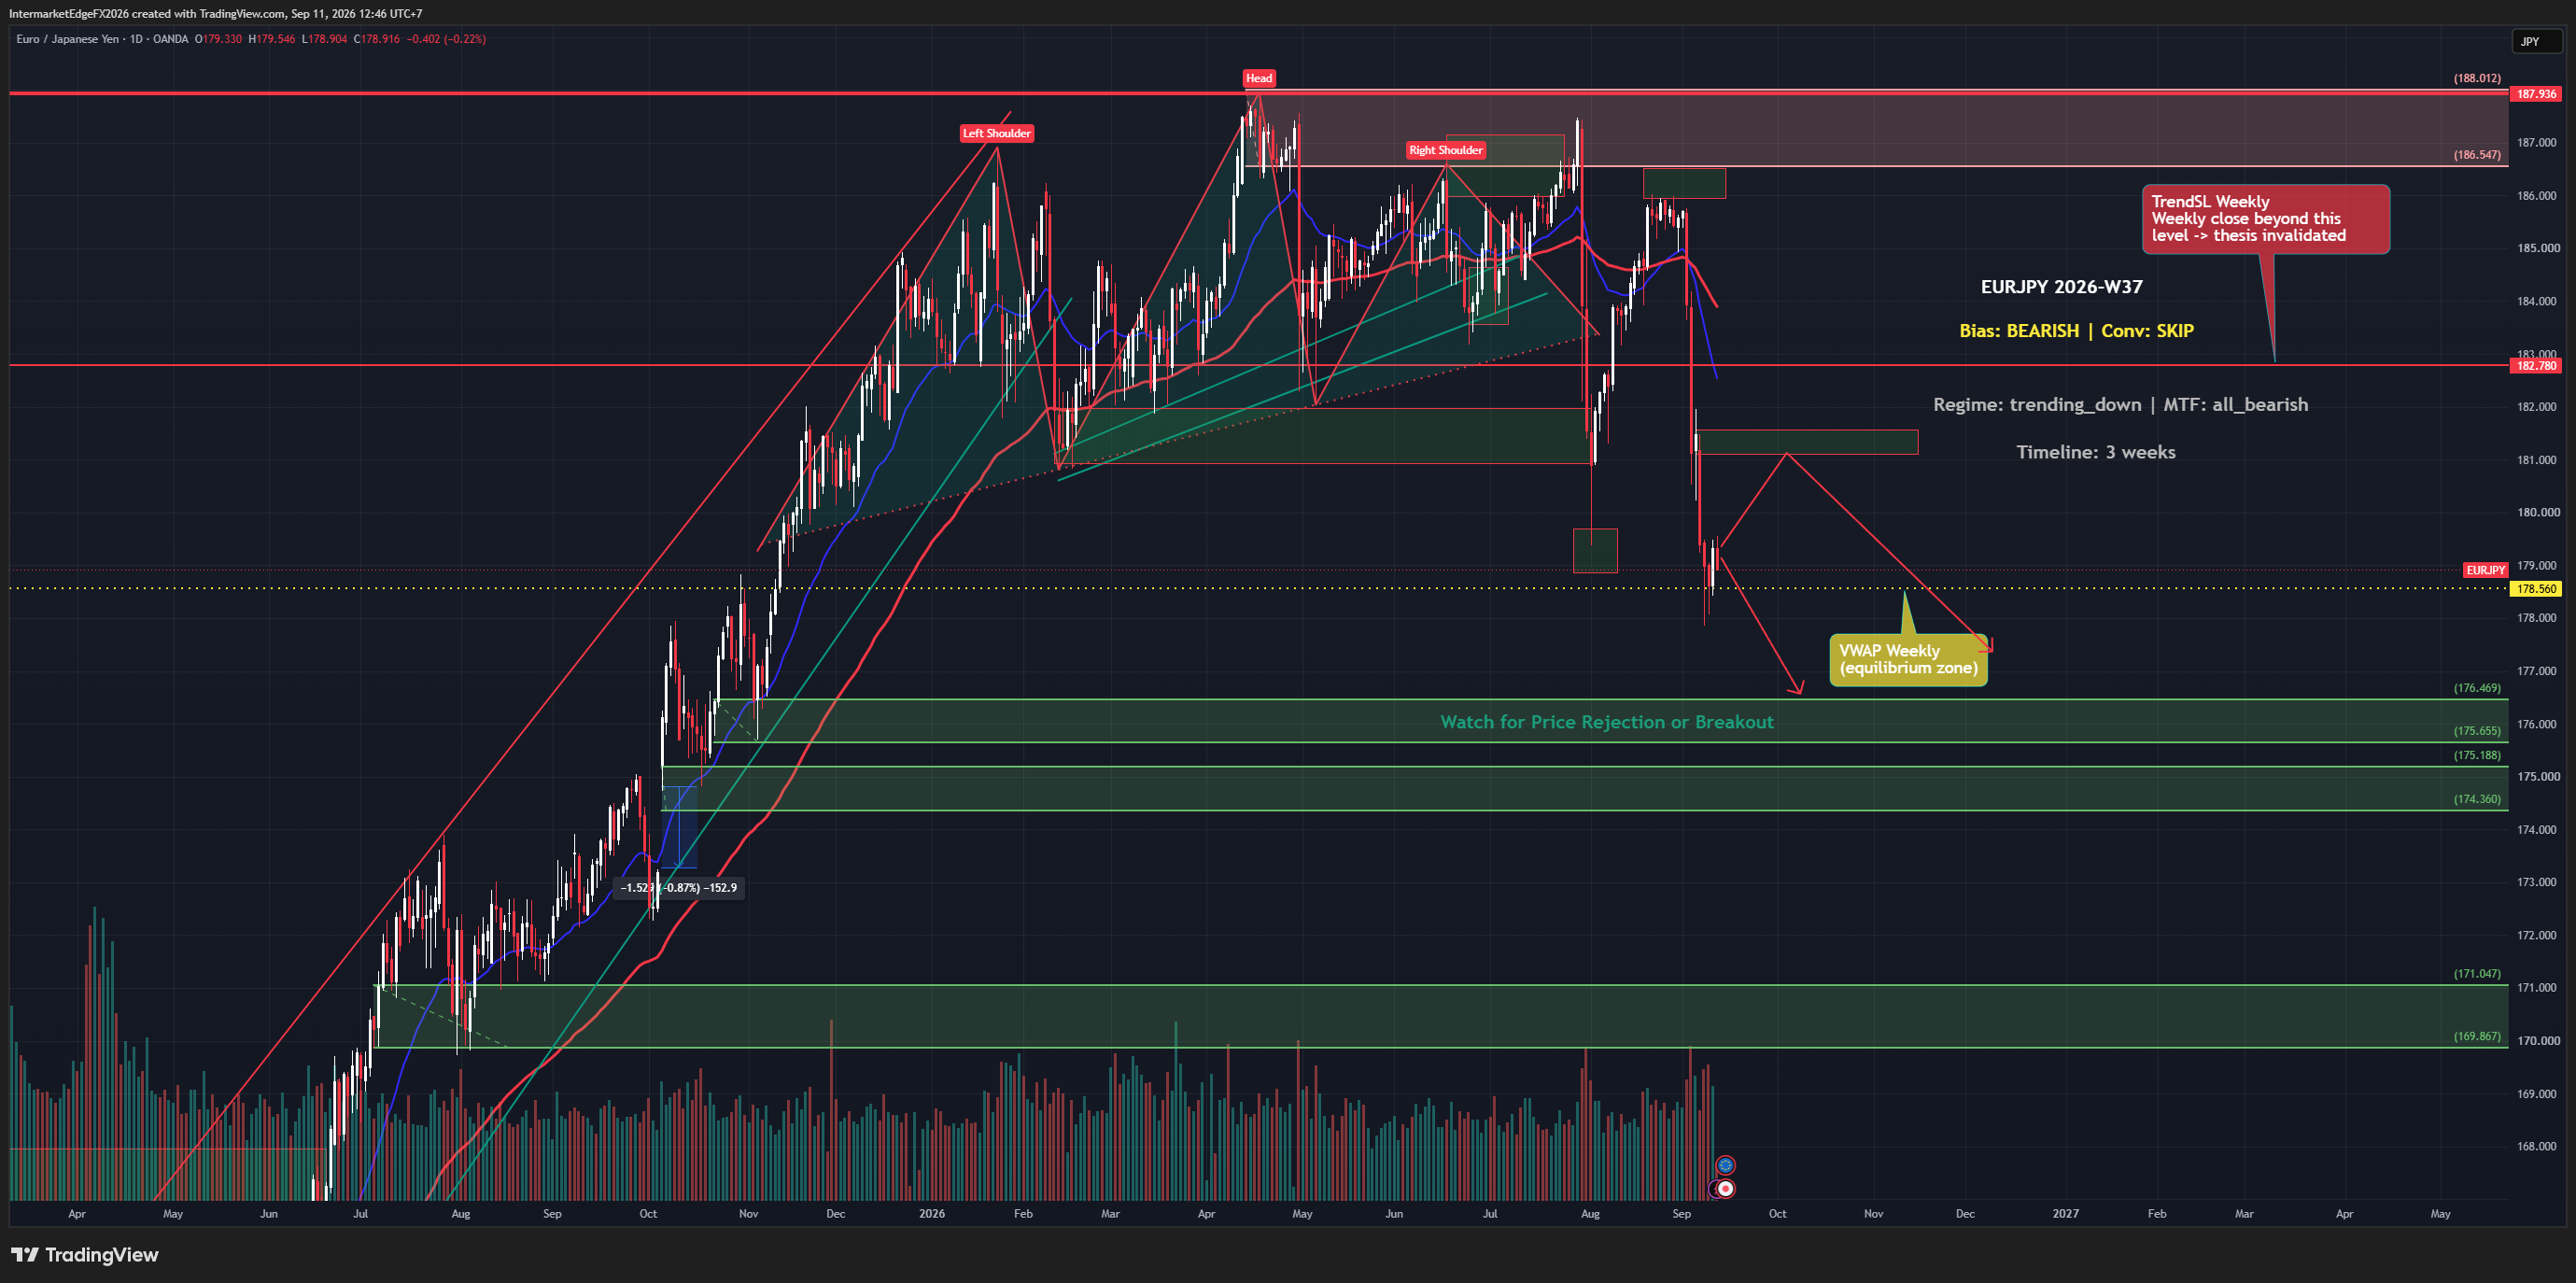
EURJPY 183.465 | H&S confirmed, carry collapses to 0.21% | 24 June 2026 Last week: "RS forming 185.5-186.5." This week: RS completed at 186.547, price left the RS, wave (c) running. H&S confirmed. But the bigger story is the carry. The pipeline shows DE-JP spread at about 1.52%. Entirely wrong. Actual: JP10Y jumped to 2.660% after the BoJ hike, DE10Y fell to 2.870%. The real spread is just +0.210%, near zero. This is the largest correction of all nine instruments this week. When carry vanishes, the top pattern forms naturally. The H&S is the structural consequence. Tokyo CPI June forecast to accelerate on commodity prices -- giving the BoJ grounds to hike further. Markets watching for follow-up. ECB 2.00% neutral, no EUR catalyst. D1 structure: LS ~185.5, Head 188.012, RS 186.547 (completed). Neckline 181. Price 183.465 between RS and neckline. Targets: break neckline 181, wave c 1.618 at 177, H&S measured 171.047, deep 169.867. Three scenarios: → Break neckline 181, target 177. Probability: 40% → Break then H&S measured 171. Probability: 25% → Technical bounce to 185 then resumes lower. Probability: 20% Invalidation: daily close above RS 186.547. The tell: the pipeline shows 1.52% carry. The real number is 0.21%. When the market catches up, the decline accelerates. Conviction: High Bear. --- Intermarket Edge | Institutional Macro & Intermarket Analysis For informational purposes only. Not financial advice.

EURUSD - Wave (c) Confirmed After Breaking 1.141, a 13-Month DXY High and PMI Beat Push Euro Toward the 1.119 Projection

EURUSD - Wave (c) Confirmed After Breaking 1.141, a 13-Month DXY High and PMI Beat Push Euro Toward the 1.119 Projection

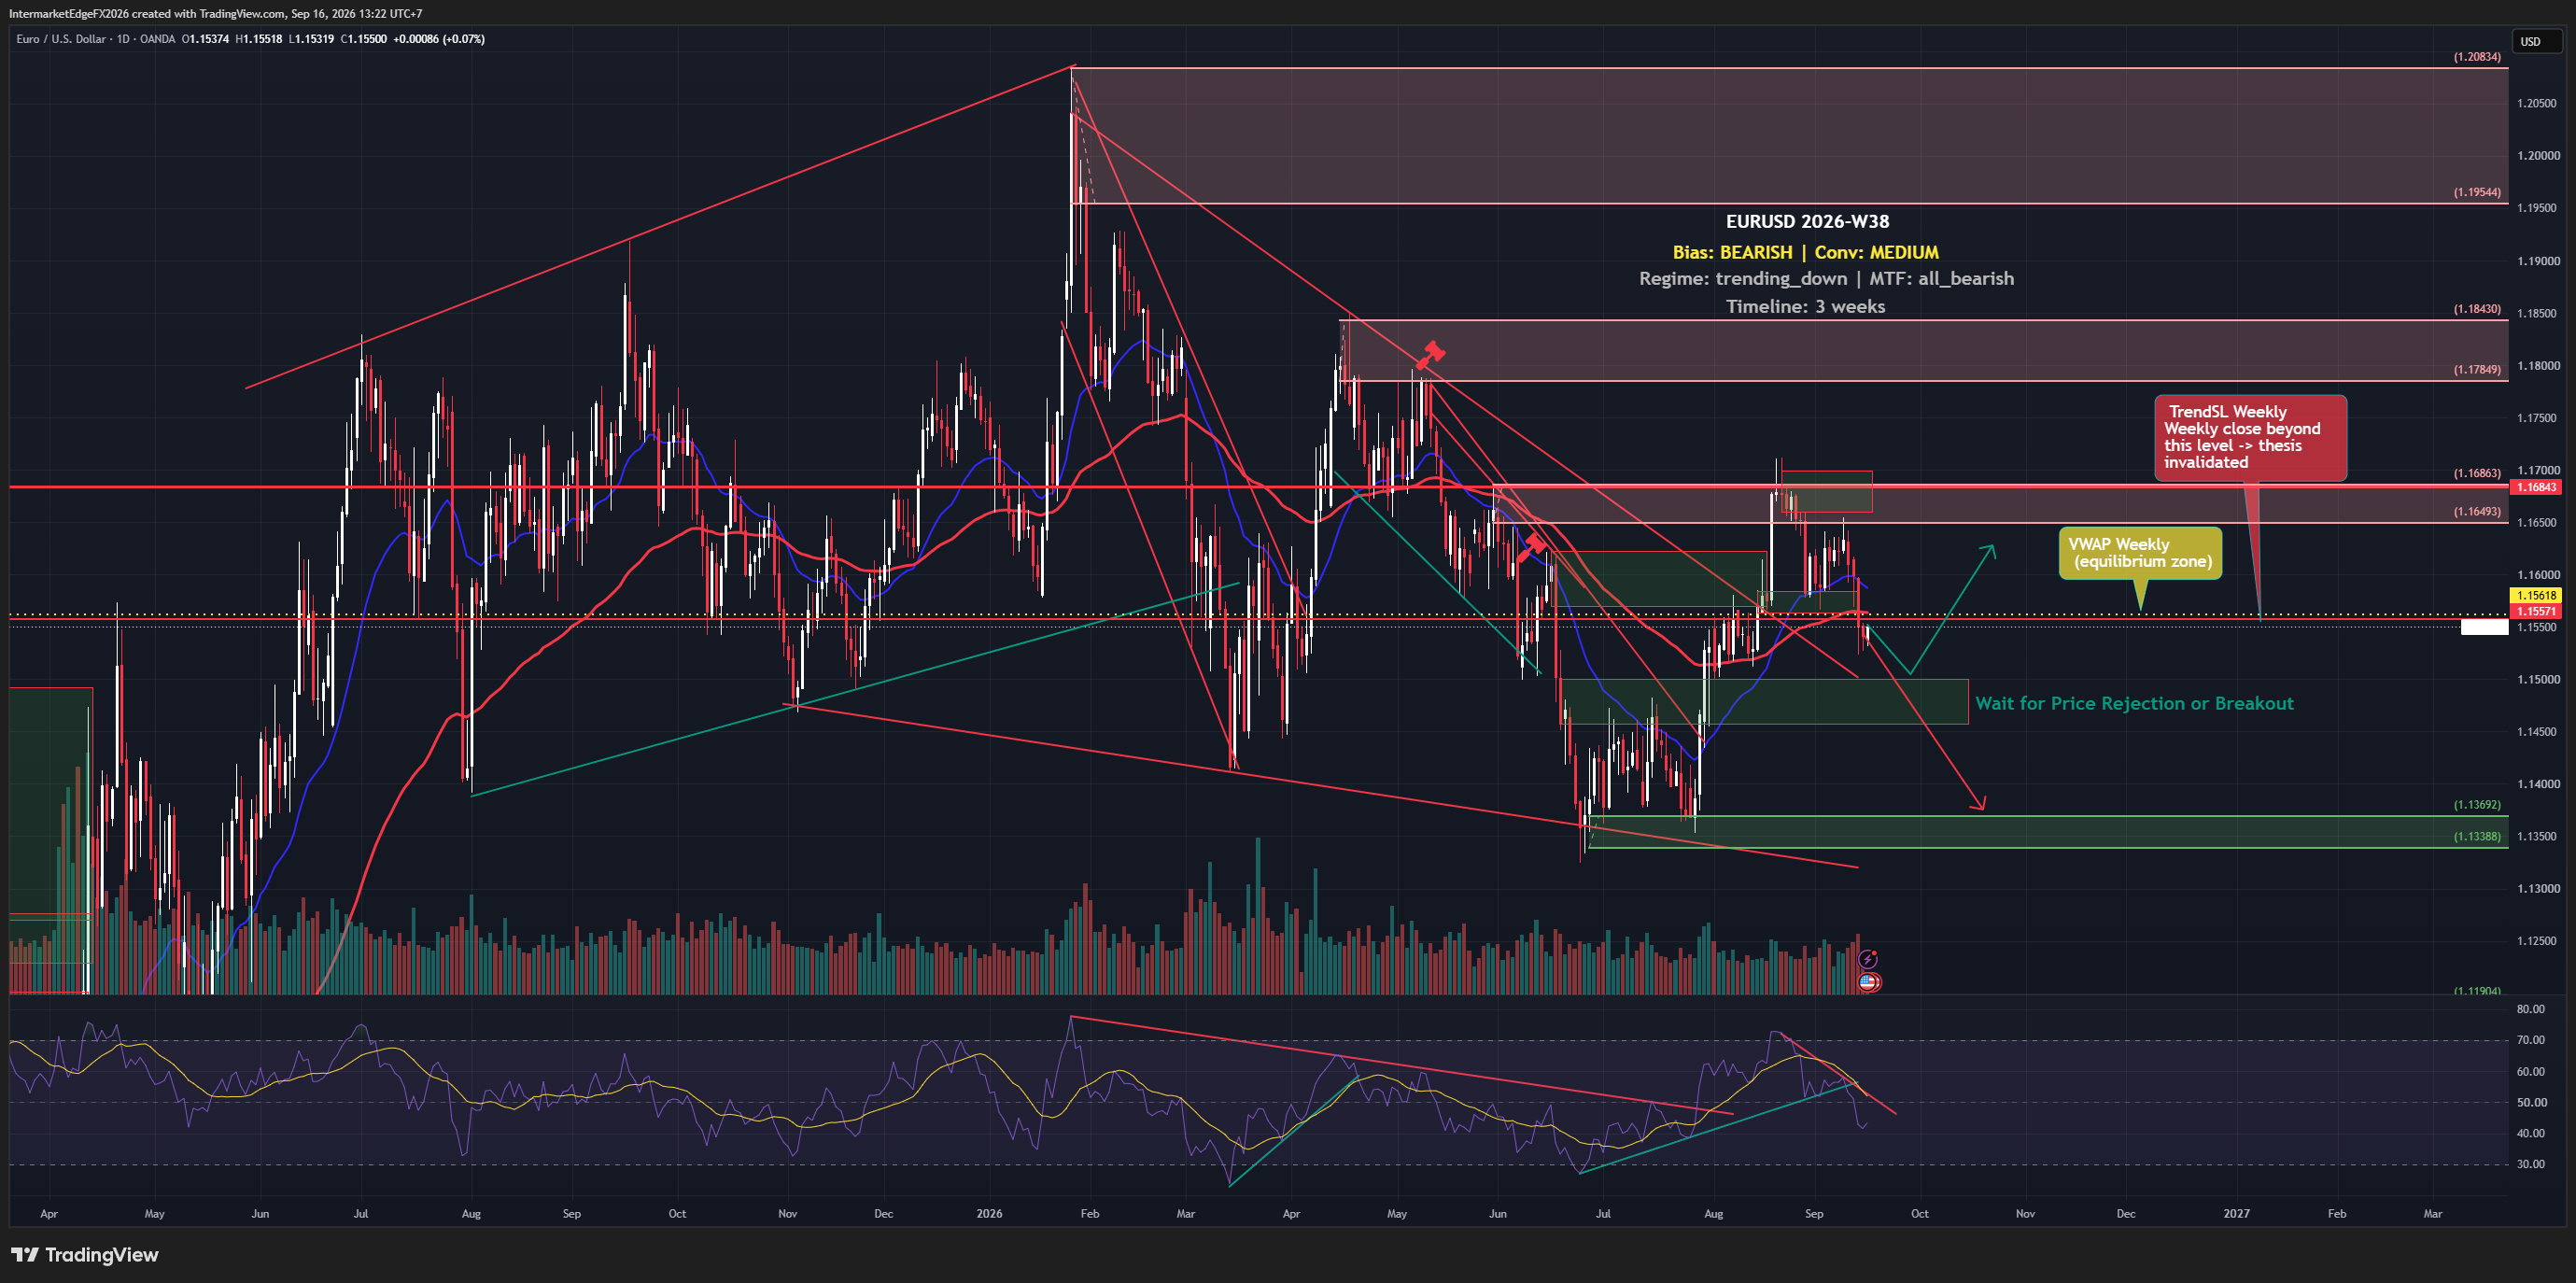
EURUSD 1.1370 | Wave (c) confirmed after breaking 1.141 | 24 June 2026 Last week's analysis set 1.141 as the bearish confirmation level. It broke. Wave (c) is now the base case, no longer a scenario. Three forces have converged since last week. DXY climbed to 101.476, a 13-month high. US PMI Manufacturing 55.7 beat the 54.7 forecast -- the economy is strong, the hike case is intact. Risk-off intensified: VIX 19.40, NAS -3.1% as tech slumped on rate bets. The euro leg has no catalyst. ECB 2.00% neutral. Vujcic: "haven't discussed the neutral rate." DE10Y fell to 2.920%, widening the DE-US spread to -1.570%. The pipeline showed wrong numbers. CPI US: 2.4% (actual 4.2%). DE10Y: 2.99% (actual 2.920%). ECB: 2.50% (actual 2.00%). Real yield: 0.290%, not 2%. D1 structure: wave (c) running with clear sub-waves. Sub-1 ~1.157, sub-2 bounce, sub-3 running (~1.137). Expect sub-4 bounce then sub-5 target 1.119. Deeper: 1.113 then 1.079-1.073. Three scenarios: → Sub-5 to 1.119. Probability: 45% → Strong data + risk-off accelerates through 1.119 to 1.079. Probability: 25% → Surprise weak data, sub-4 bounces to 1.145-1.150, resumes. Probability: 20% Invalidation: daily close above 1.192. Warning: reclaim 1.141. Conviction: High Bear (upgraded from Med-High). Every channel bearish, no divergence. --- Intermarket Edge | Institutional Macro & Intermarket Analysis For informational purposes only. Not financial advice.

EURGBP - The PM Resigned and the Pair Didn't Flinch, a 1.86% Carry Crushes Political Risk at the 0.86110 Support

EURGBP - The PM Resigned and the Pair Didn't Flinch, a 1.86% Carry Crushes Political Risk at the 0.86110 Support

EURGBP 0.8622 | 1.86% carry crushes political risk | 23 June 2026 The UK Prime Minister just resigned. The pound should be weaker. EURGBP should be bouncing. But the pair barely moved, still pinned at the 0.86110 support. This is not an anomaly. This is the strongest bear signal of the week. Carry decides. UK10Y 4.770% above DE10Y 2.910% by 1.860 percentage points. The spread is nearly identical to last week (1.862%). Starmer's exit did not narrow carry, and when a pair doesn't react to a PM-level shock, the structural force is overwhelming. EUR is not strong enough to push it higher either. EURUSD 1.1392 falling. ECB neutral at 2.00%. Lane/Lagarde rhetoric mixed. The pipeline showed wrong numbers. UK10Y: 4.50% (actual 4.770%). DE10Y: 2.99% (actual 2.910%). ECB: 2.50% (actual 2.00%). D1 structure: descending channel intact from the 0.888 top. Wave (c) testing the 0.86110 support. A break opens 0.84418 then 0.84117. Invalidation: 0.87415. Three scenarios: → Break 0.86110, wave (c) to 0.84418 then 0.84117. Probability: 40% → Hold 0.86110, carry pins, range 0.860-0.865. Probability: 25% → Political crisis escalates, UK yields drop, delayed bounce to 0.87415. Probability: 20% The tell: EURGBP didn't react to a PM resignation. The 1.86% carry controls this pair. As long as it holds, the downside has the higher probability. Conviction: Medium-High Bear, increased versus last week. --- Intermarket Edge | Institutional Macro & Intermarket Analysis For informational purposes only. Not financial advice.

GBPUSD - Triangle Breaks Down After Three Shocks in One Week: Starmer Resigns, Hawkish FOMC, Soft UK CPI

GBPUSD - Triangle Breaks Down After Three Shocks in One Week: Starmer Resigns, Hawkish FOMC, Soft UK CPI

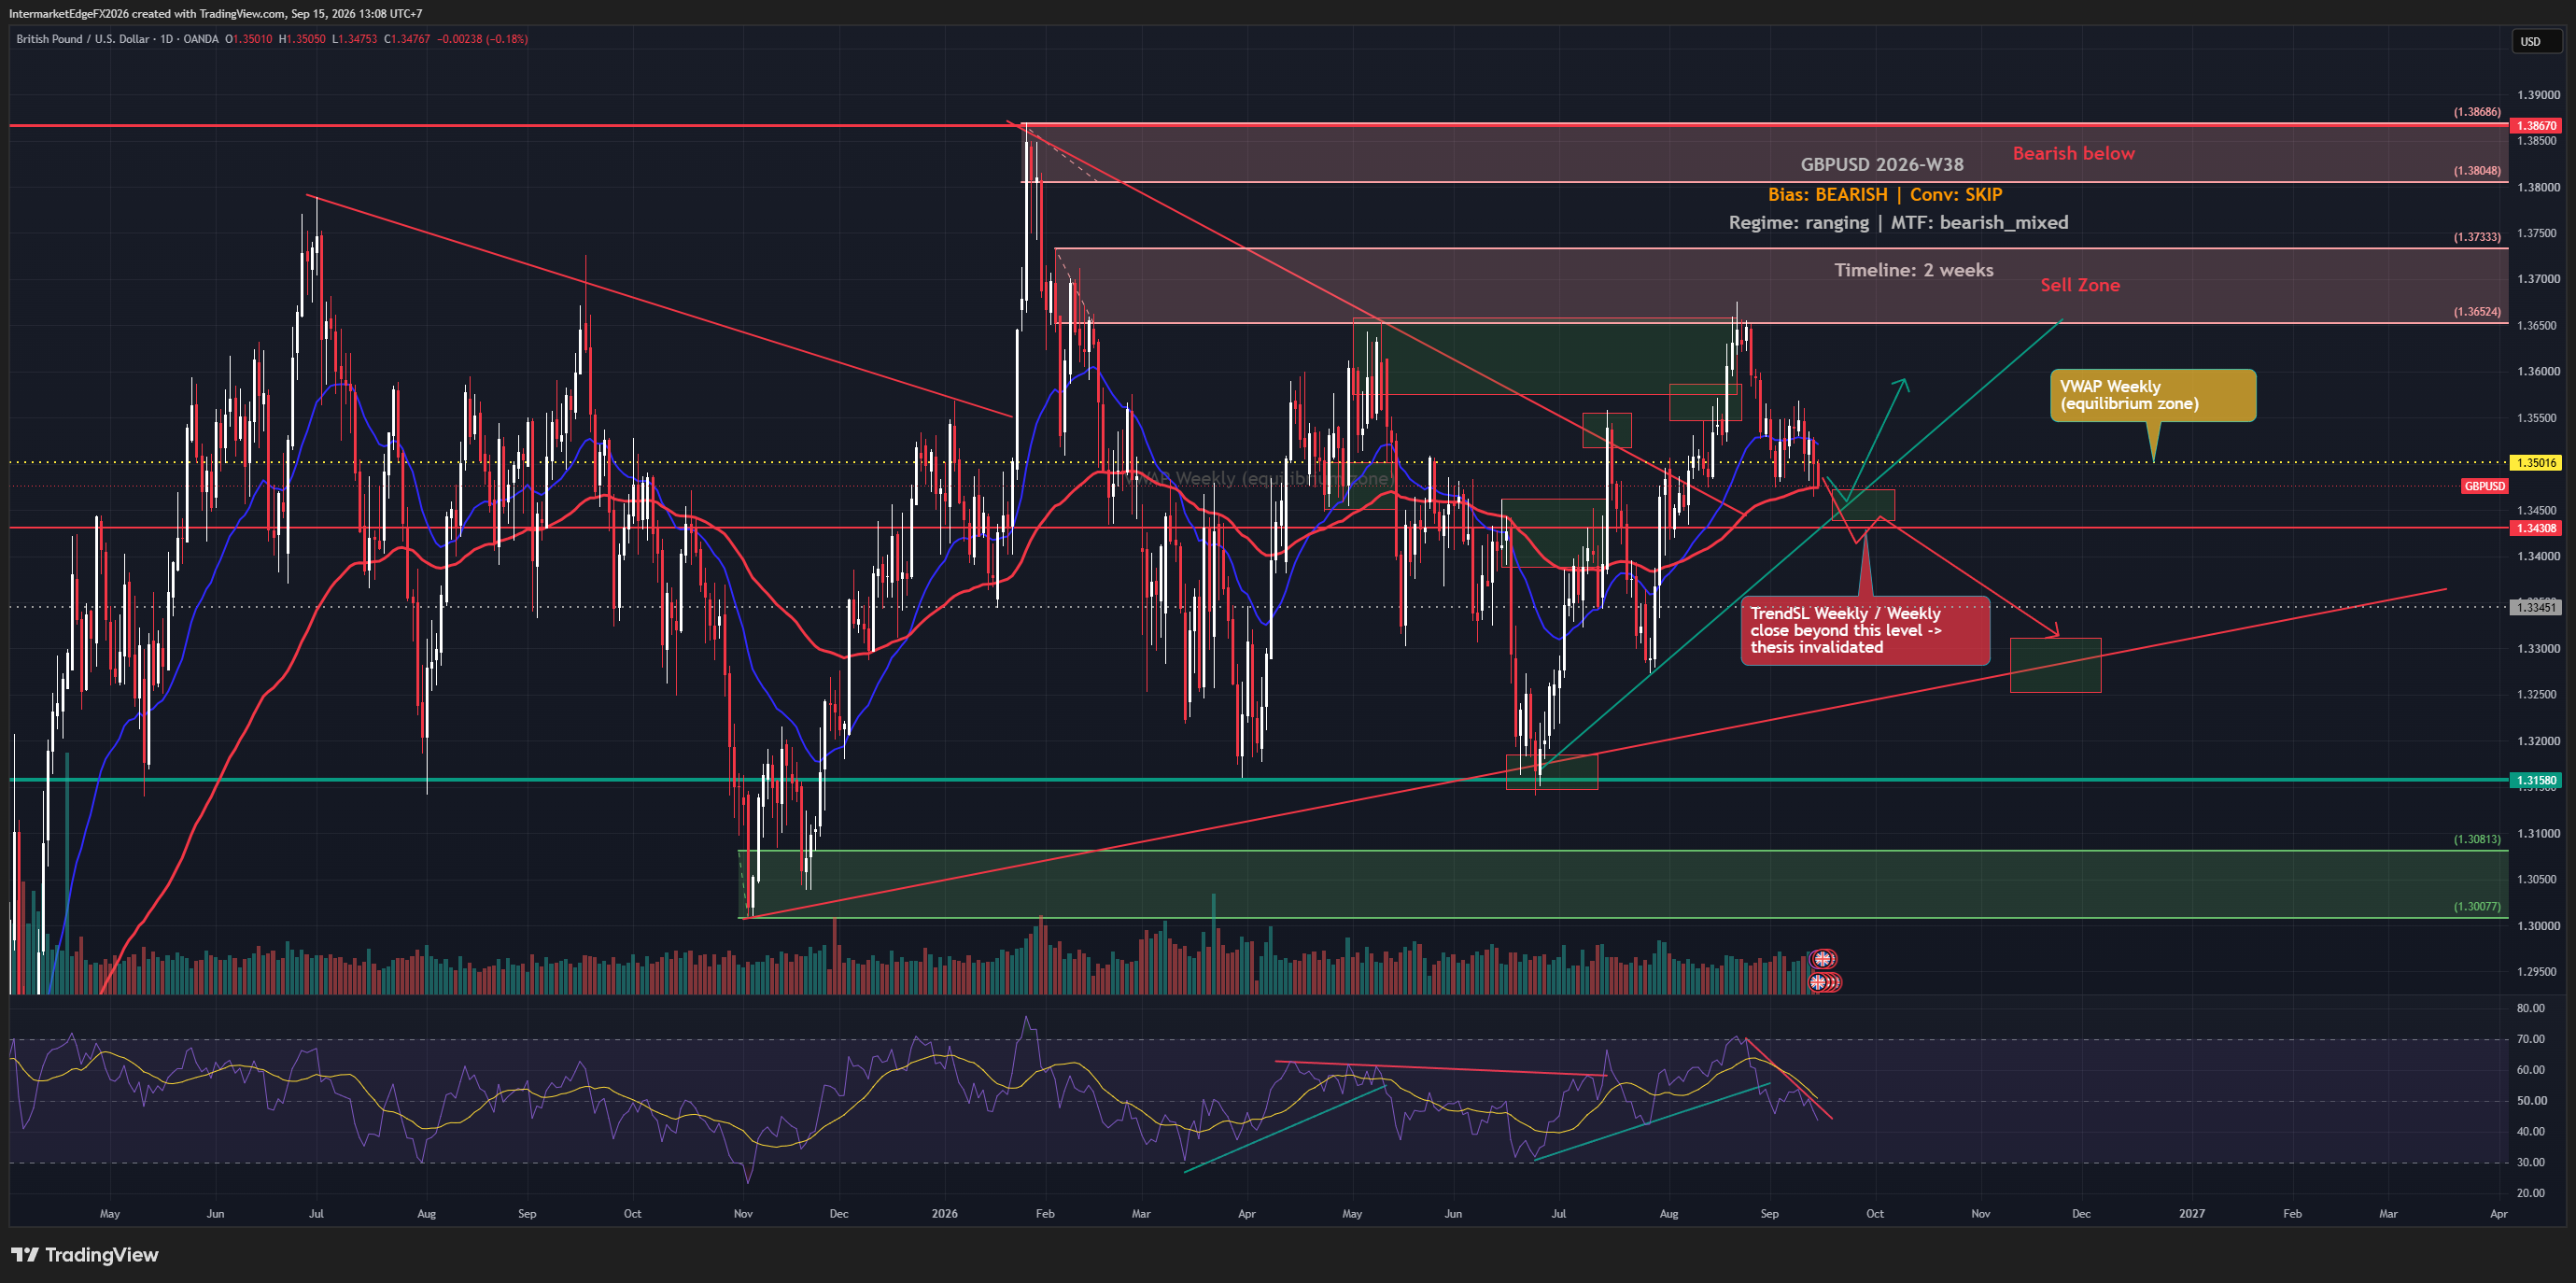
GBPUSD 1.3246 | Triangle breaks down after three shocks in one week | 23 June 2026 Last week GBPUSD was a two-sided setup awaiting two catalysts. Both landed bearish. Then yesterday the UK Prime Minister resigned. The triangle is broken. The debate is over. Three shocks, one week: → Starmer resigned 22/06. Leadership vacuum until 09/07. Pound dipped on the exit. → Hawkish FOMC 17/06. DXY at a 13-month high. Dot plot projects a hike later this year. → UK CPI soft miss 17/06. 2.8% vs 3.0%, m/m 0.2% vs 0.4%. Higher-for-longer BoE case weakened. The pipeline showed wrong numbers. GB10Y: 4.50% (actual 4.770%). UK-US spread: 0% (actual +0.290%, narrowed from +0.348%). CPI US: 2.4% (actual 4.2%). D1 structure: the contracting triangle broke down (confirming last week's 35% bearish scenario). Wave (c) is running. Price at 1.3246 heading to support 1.31580, target 1.30813 then 1.30077. Clear risk-off: VIX 19.90 (+15%), NAS -2.2%. Haven dollar strengthens. Only support: UK-US carry still positive but political risk outweighs it. Three scenarios: → Wave (c) continues to 1.30813 then 1.30077. Probability: 45% → Strong PMI bounces to 1.335, resumes lower. Probability: 25% → Risk-off + political risk accelerates, below 1.300. Probability: 20% Invalidation: daily close above 1.355. The tell: three shocks pointed one way. The triangle confirmed it. The political vacuum extends it. Conviction: Medium-High Bear. --- Intermarket Edge | Institutional Macro & Intermarket Analysis For informational purposes only. Not financial advice.

Stay in the loop

Get notified about new research, macro insights, and market analysis.

InterMarketEdge

© 2026 InterMarketEdge. Financial intelligence for inter-market traders.