Instrument Deep Dive — InterMarketEdge

Instrument Deep Dive

Full L0–L8 structural analysis on a single instrument — conviction, invalidation, and time horizon

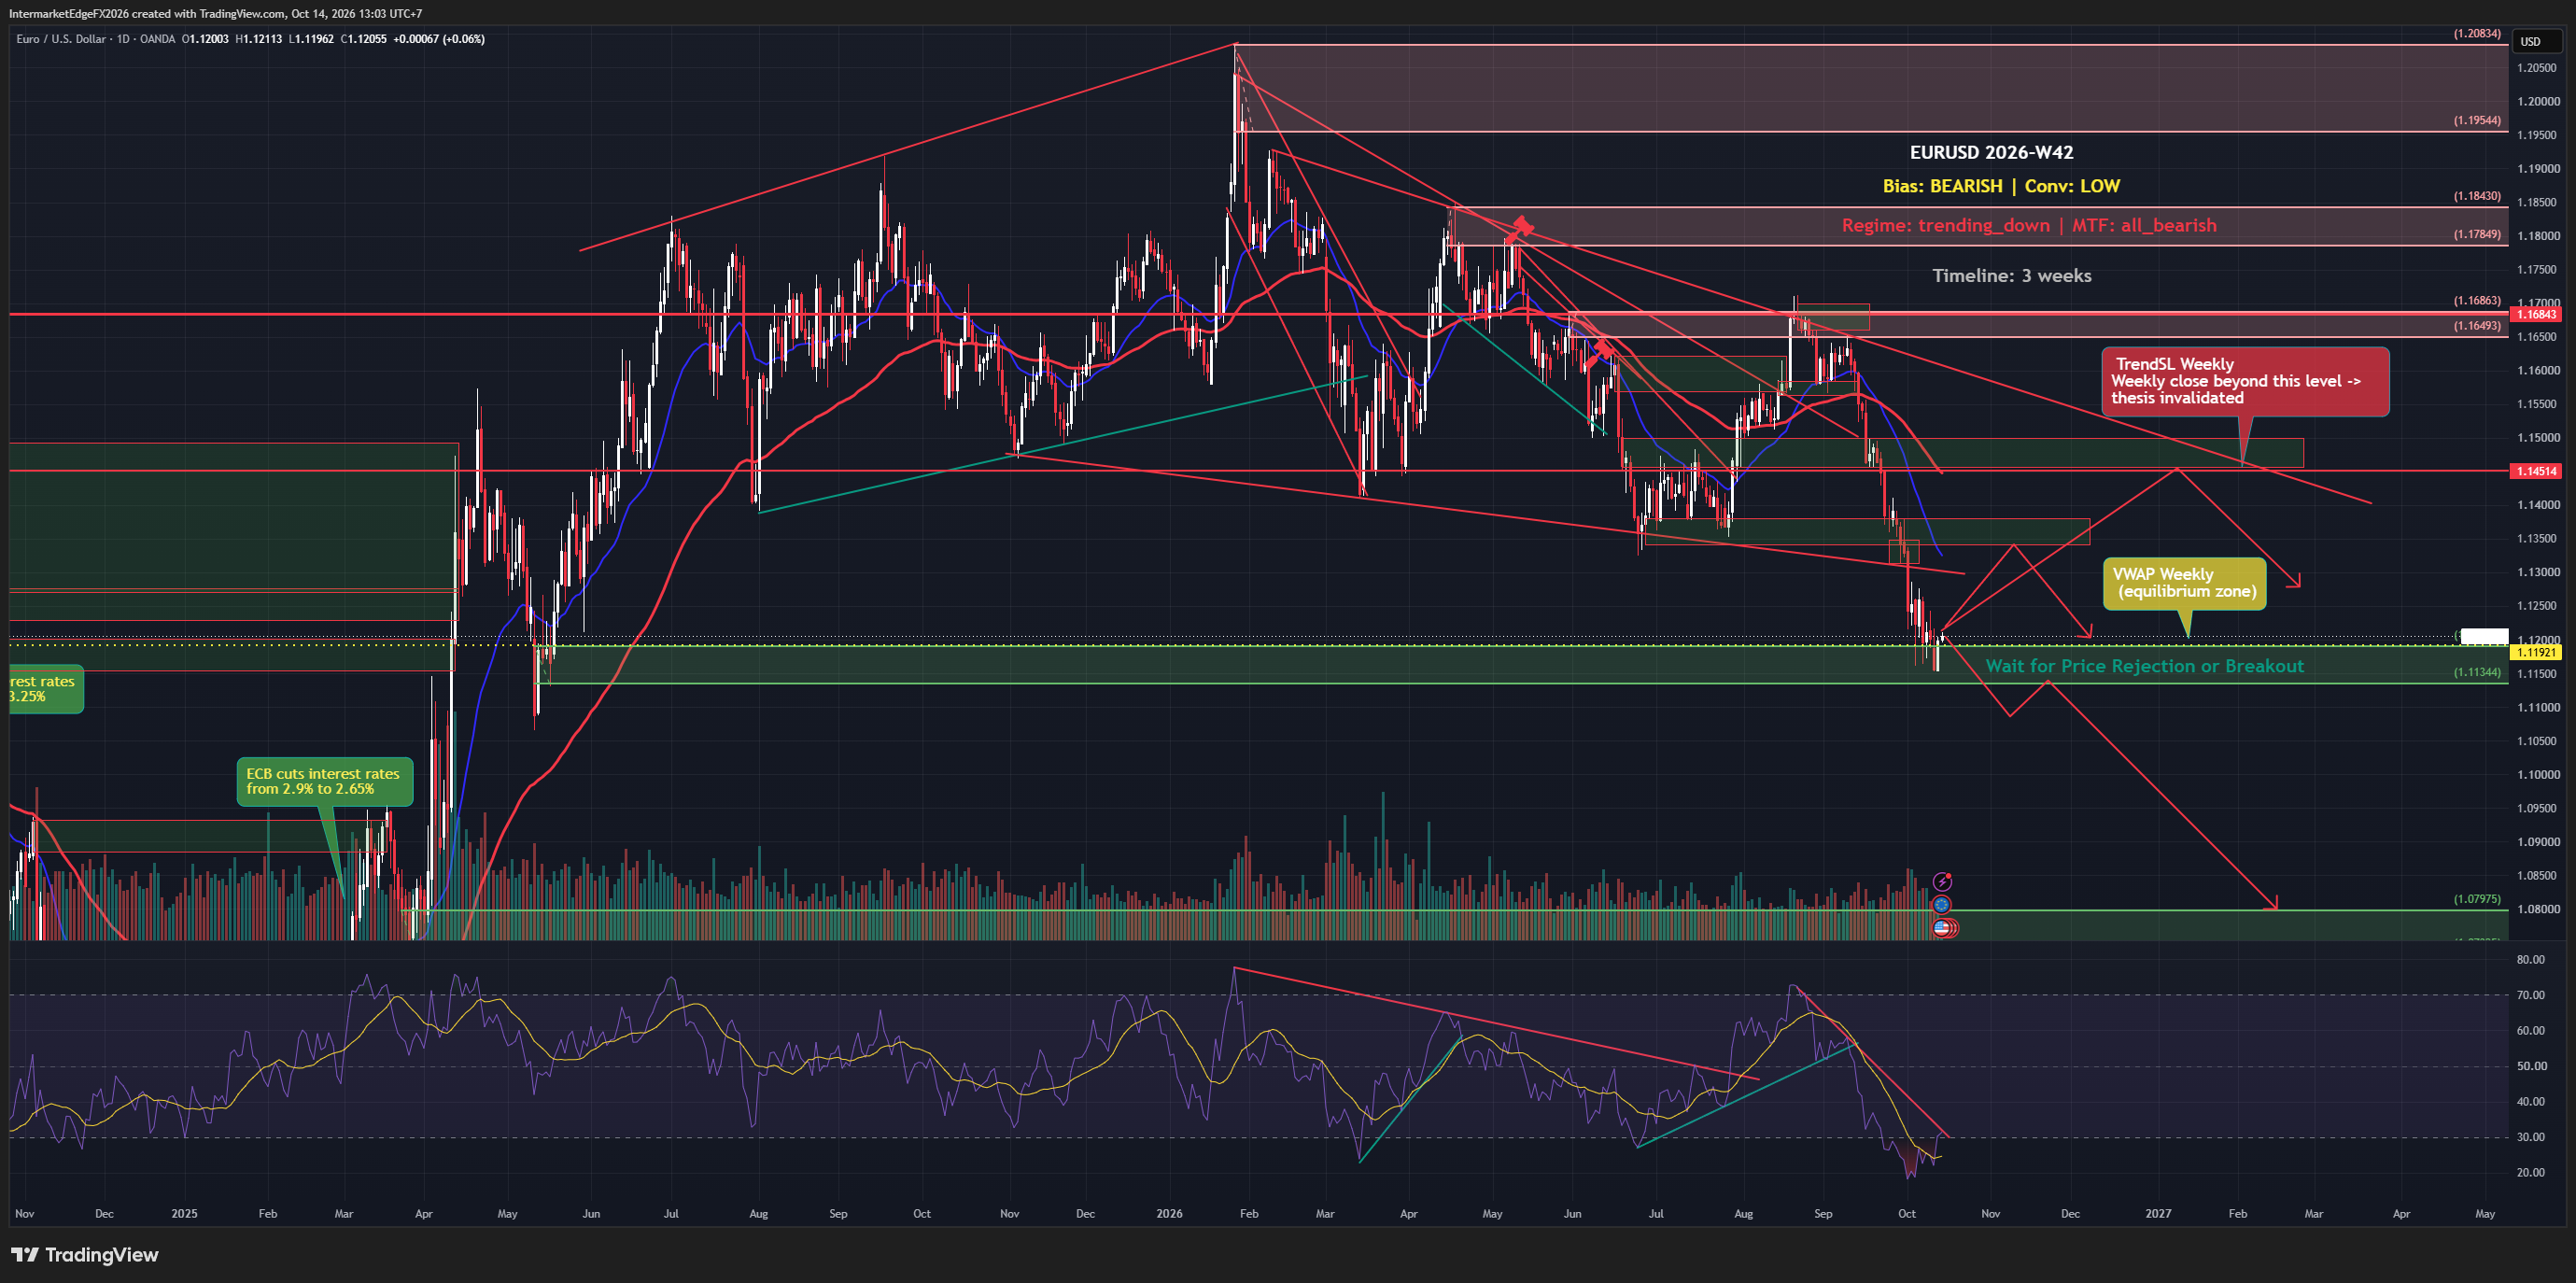
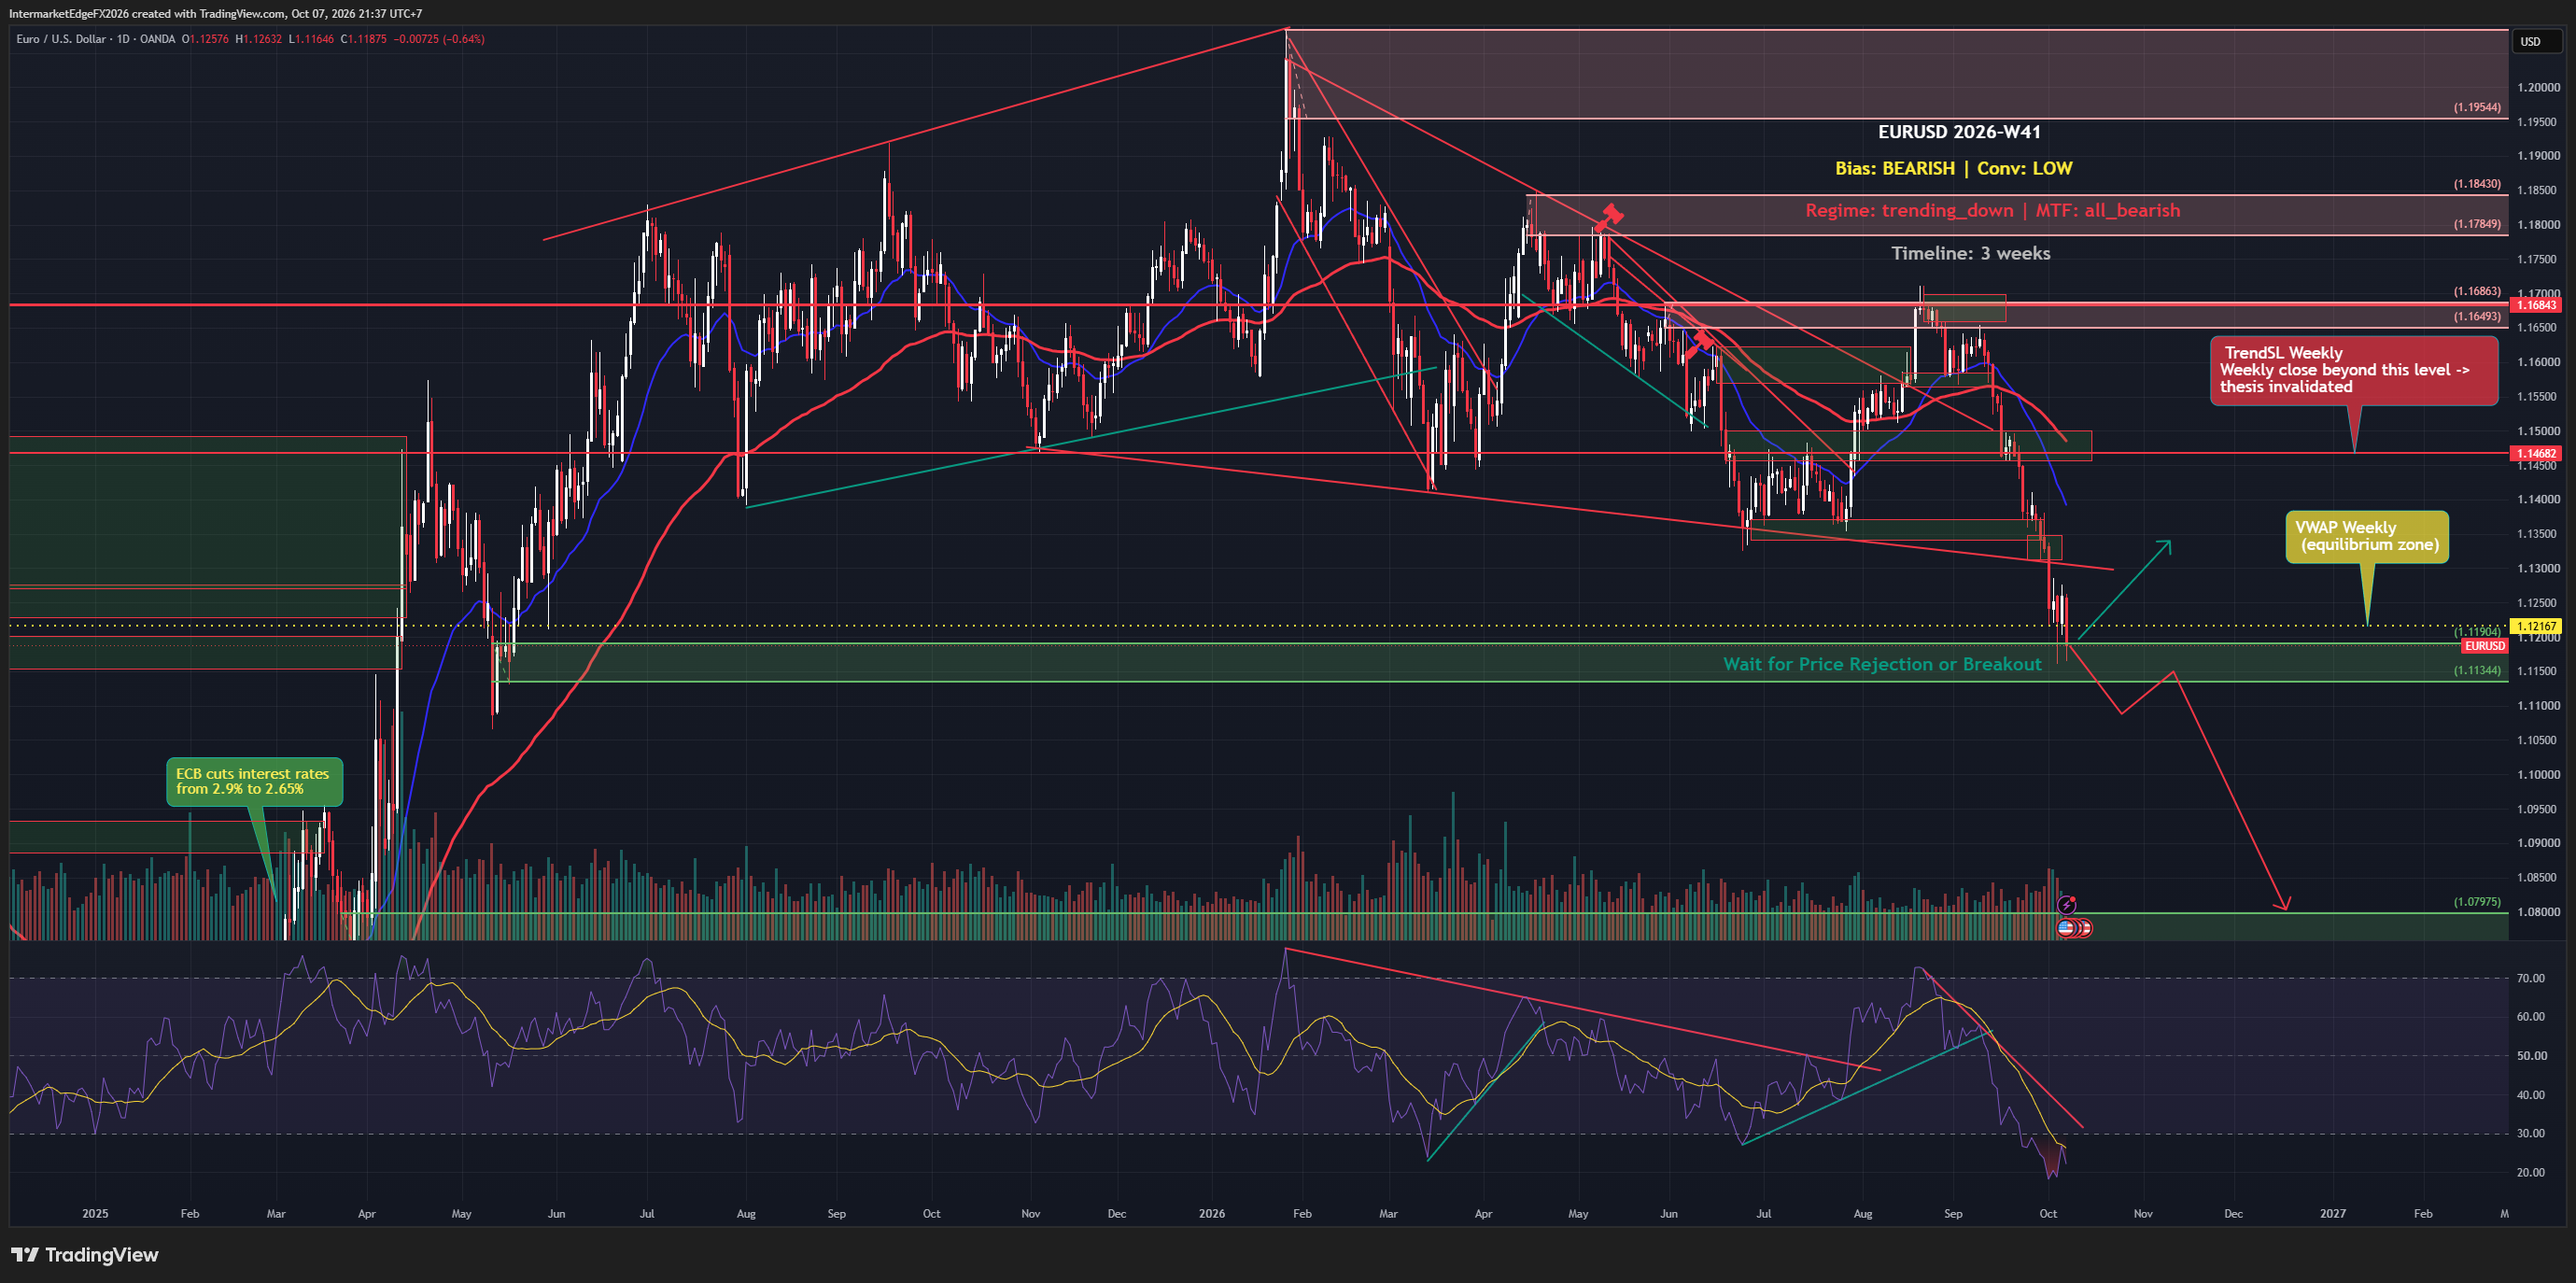
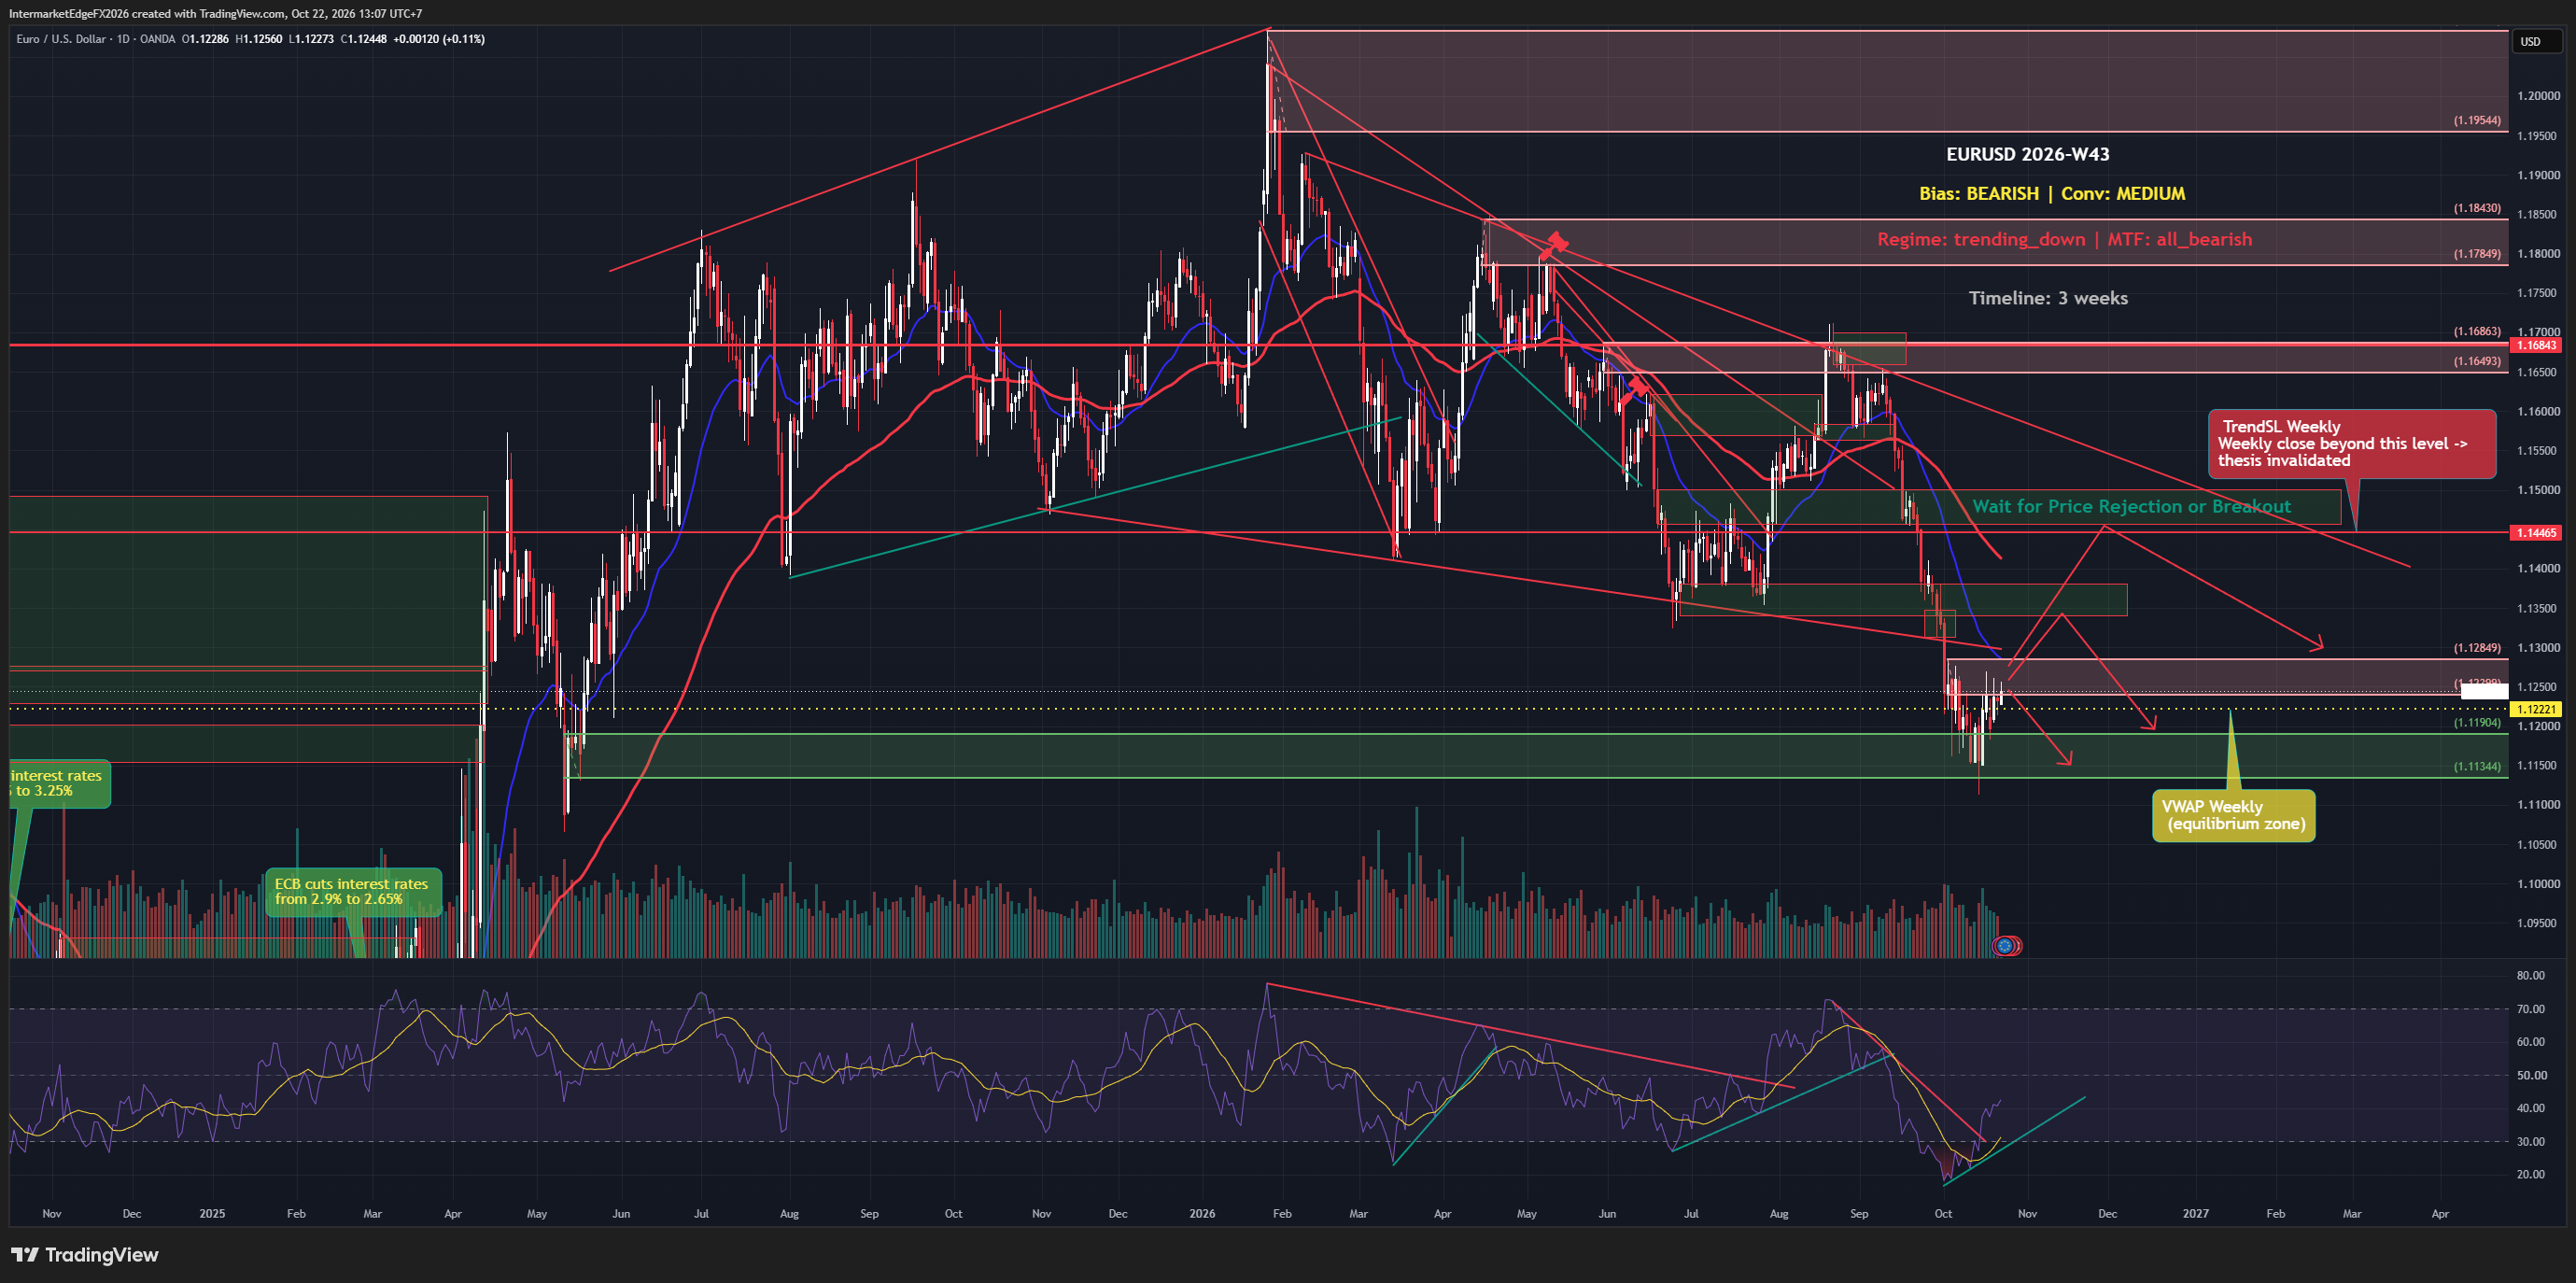
EURUSD Week W36-2026: Price Holds Above 1.15942 VWAP as Fed Beige Book Strengthens the Dollar Case, But the Chart Refuses to Confirm

EURUSD Week W36-2026: Price Holds Above 1.15942 VWAP as Fed Beige Book Strengthens the Dollar Case, But the Chart Refuses to Confirm

EURUSD is trading at 1.15972 as of Thursday, 03 September 2026, sitting above the weekly VWAP at 1.15942, and that positioning alone tells you the bearish macro thesis has not yet found technical confirmation. The Fed Beige Book flagged modest growth and elevated input-price pressures, keeping the hawkish USD narrative alive. But daily, weekly, and monthly trend signals are all pointing the same direction: up. That conflict is the trade problem this week, not the direction call. The analytical framework carries a bearish bias on EURUSD for the next three weeks, driven primarily by the ECB-versus-Fed rate differential. The causal chain runs as follows: the Fed remains hawkish because inflation, particularly in goods inputs, has not fully cooled, which means rate cuts are off the table near-term; that keeps real US yields elevated; elevated real yields make dollar assets genuinely attractive on a return-adjusted basis, not just nominally; and that sustained demand for dollars exerts downward pressure on EURUSD over a multi-week horizon. The conviction behind this view is medium, not high, and the reason matters. The conflict embedded in this setup is serious and should not be minimized. Price, COT positioning, and the technical trend structure are all reading bullish, not marginally, but comprehensively. Daily, weekly, and monthly trend signals are simultaneously aligned to the upside, which represents the maximum level of multi-timeframe technical conviction available. COT data shows a bullish lean as well, though the specific report week and net-position figures are not disclosed in this brief, so that reading should be treated as directional evidence rather than a precise positioning snapshot. What this means practically: the bearish label here is a macro-structural override, not a technically confirmed setup. -- Intermarket Edge

DXY Weekly Outlook W36: Hawkish Fed, Bearish Structure

DXY Weekly Outlook W36: Hawkish Fed, Bearish Structure

Fed Chair Kevin Warsh just opened the door to further rate hikes if inflation stays sticky, pushing the September hike probability from roughly 36% to around 58%, and the dollar responded, rising about 0.6% to the 99.6-99.7 range. That repricing sounds unambiguously bullish for the DXY. But leveraged funds are already sitting on extreme short positions in the dollar, which means the crowd most likely to fuel a sustained rally may already be largely offside. The payrolls report on September 4 is now the deciding test. The multi-timeframe structure on DXY remains bearish, with alignment across timeframes pointing in the same direction, the regime is trending down, and the framework's FX implication is to follow that trend rather than fade it. That said, the conviction behind this week's bearish read is deliberately low, and staying out of a full position is the rational response to the current evidence, not a failure of analysis. The reason conviction is suppressed comes down to a specific, unresolved conflict. Price action over the past week has been technically constructive, the dollar bounced, reclaimed short-term levels, and printed near a two-week high. Meanwhile, COT positioning data shows leveraged funds holding extreme short positions in the dollar. This is a meaningful divergence: if speculators are already heavily short, there is a contrarian question worth taking seriously, who is left to sell? A market where the bearish crowd is already crowded (crowding risk, meaning the position is so consensus that a reversal triggers forced covering rather than fresh selling) can squeeze sharply on any positive catalyst, and Warsh's hawkish signal plus the geopolitical oil spike are exactly the kind of catalysts that can trigger such covering. -- Intermarket Edge (Note: COT (Commitment of Traders) data is released weekly by the CFTC with a reporting-period lag -- it is not a real-time position feed. See cftc.gov for the exact release schedule.)

USDJPY: A Bullish Macro Lean Still Lacks Technical Confirmation

USDJPY: A Bullish Macro Lean Still Lacks Technical Confirmation

USDJPY is caught between two equally weighted forces right now: a Fed that keeps real yields at 2.34%, firmly supporting the dollar side of the trade, and a BOJ whose hawkish posture remains the single biggest tail risk capable of unraveling the entire carry position. As of Friday 28 August 2026 at 03:59 UTC, the pair sits at 159.37, holding above the weekly VWAP at 159.17 but unable to push through the TrendSL at 159.56. That gap tells the real story this week. The framework flags a bullish bias on USDJPY for the next two weeks, but the conviction attached to that label is deliberately low, meaning the evidence tilts directionally positive without being strong enough to justify aggressive sizing. The two pillars holding the bullish case together are COT positioning, which leans bullish (though the specific report week, net-position figure, and release date are not specified in the available data, so this should be read as directional evidence rather than a precise statistic), and price action itself, which is currently holding above the weekly VWAP at 159.17 as of Friday 28 August at 03:59 UTC. The critical tension sits in the causal chains pulling in opposite directions with roughly equal force. Fed hawkishness, anchored by real yields at 2.34%, pushes USDJPY higher by widening the rate differential and reinforcing dollar demand. BOJ hawkishness, simultaneously, pushes it lower by threatening to narrow that same differential and triggering carry unwinds. Both forces carry substantial weight, and the data this week does not resolve which dominates. Tokyo CPI missed slightly, which temporarily reduces immediate BOJ pressure, but the improving labor market and the BOJ's own gradual recovery narrative keep the hawkish scenario on the table. -- Intermarket Edge

GBPUSD Week W35-2026: Sterling Pauses at Six-Month Highs as Iran Sanctions and Debt Nerves Pull in Opposite Directions

GBPUSD Week W35-2026: Sterling Pauses at Six-Month Highs as Iran Sanctions and Debt Nerves Pull in Opposite Directions

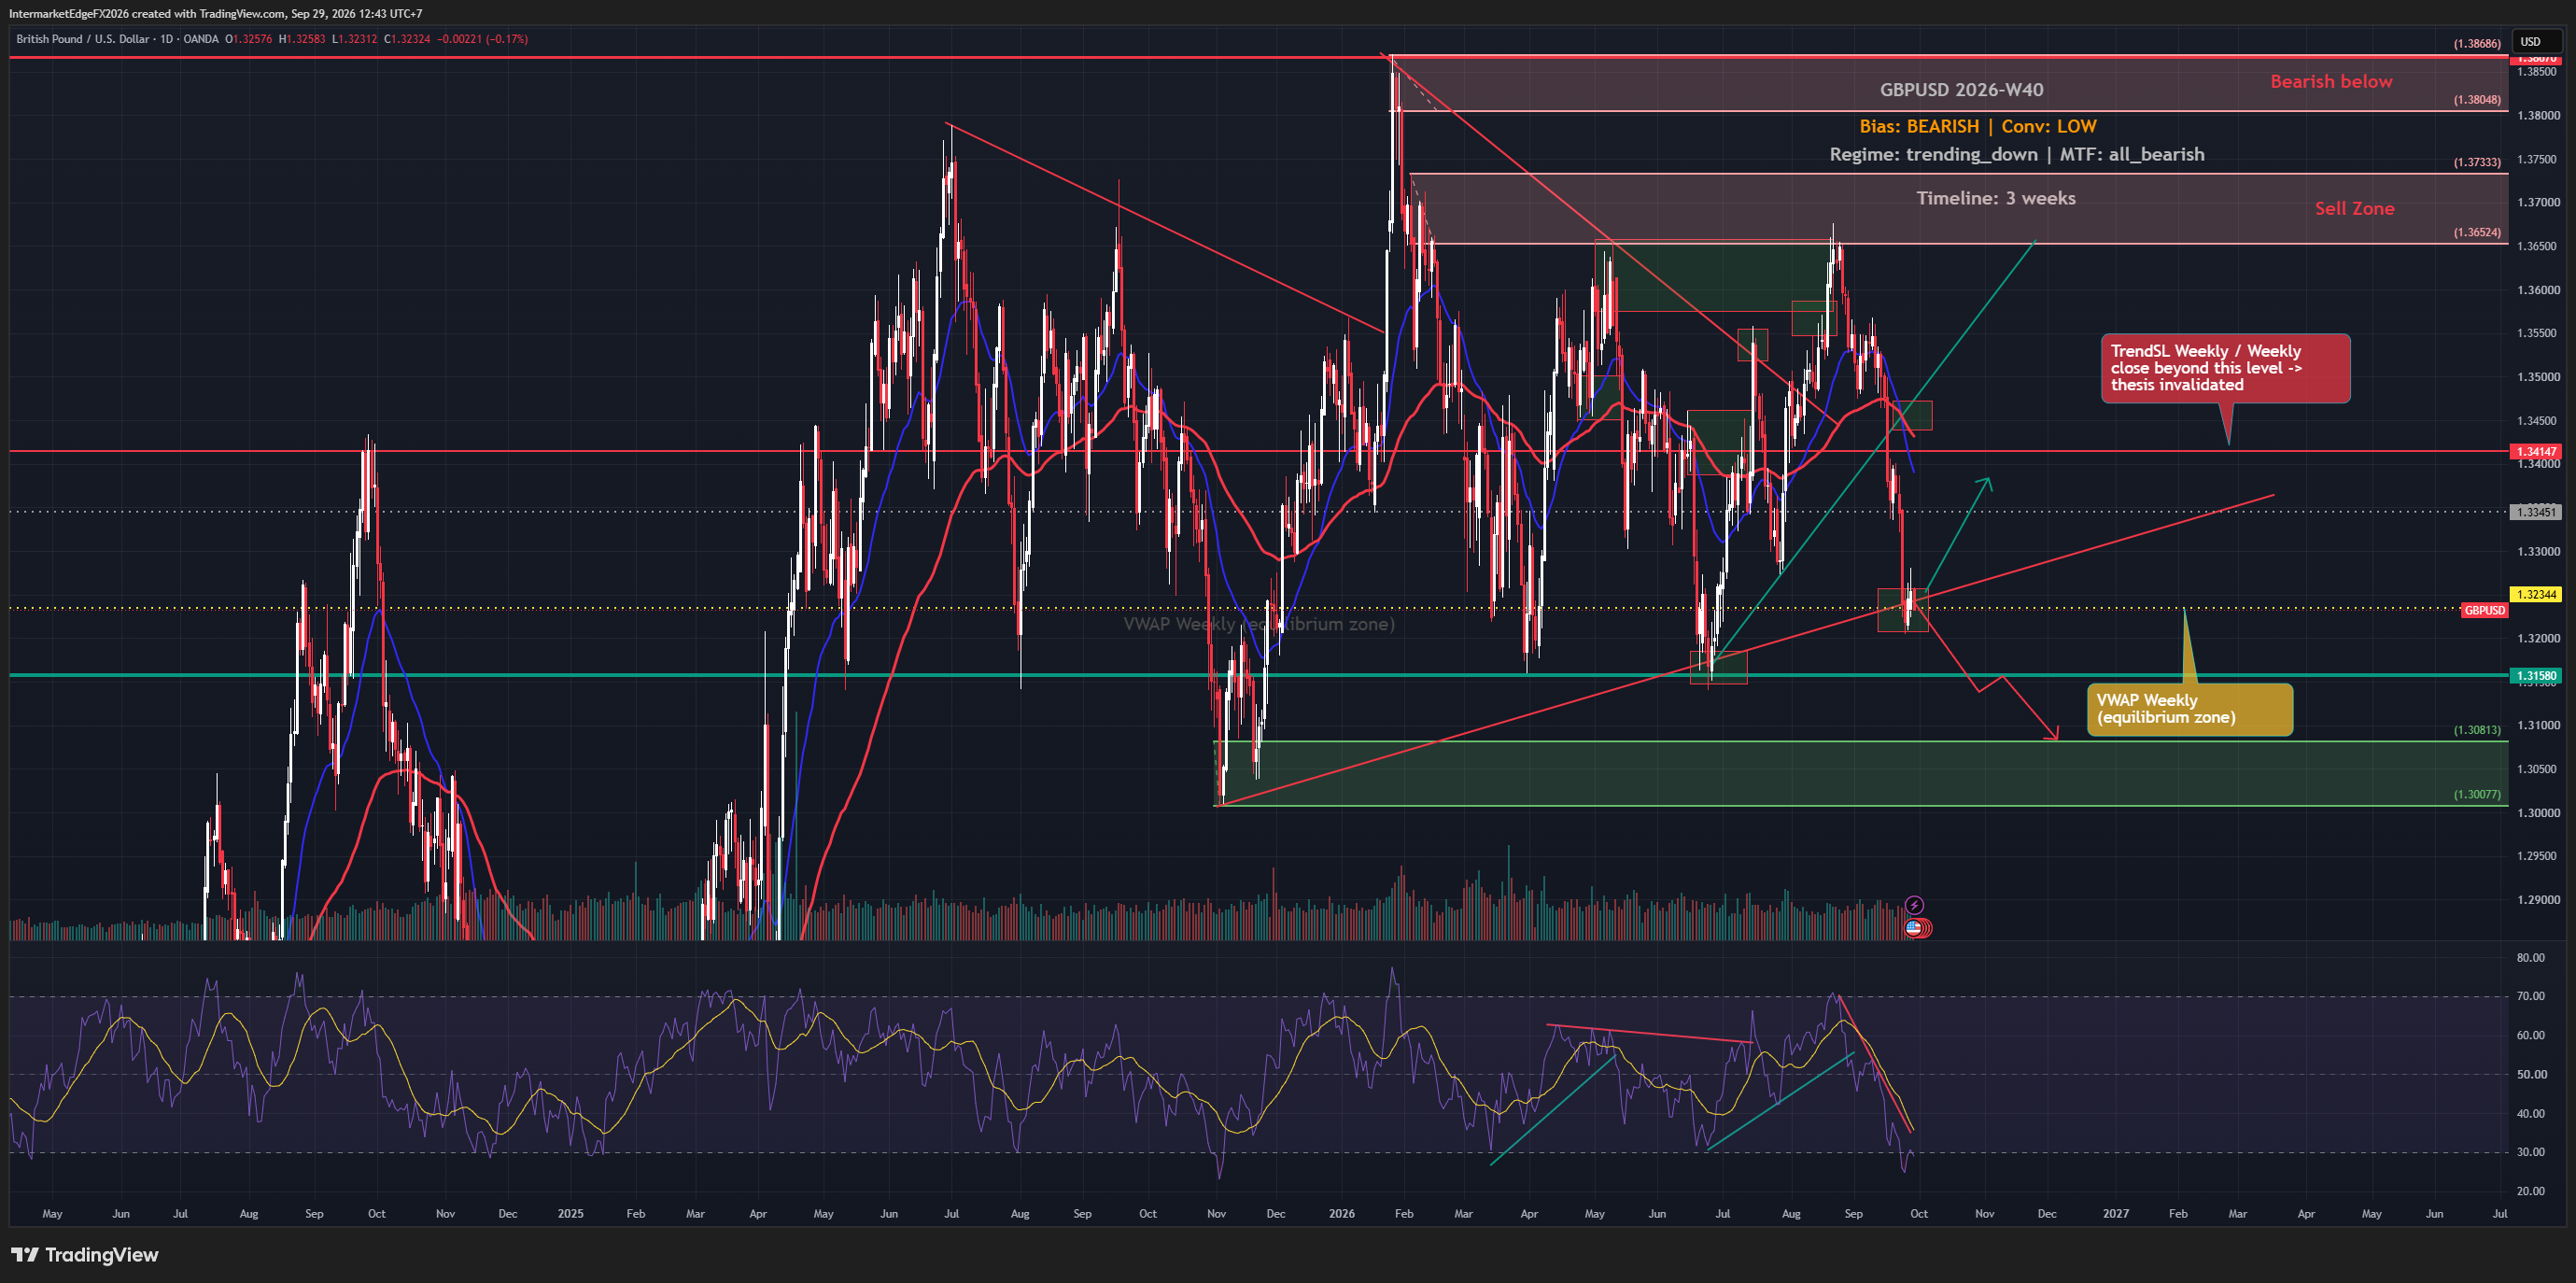
Sterling has climbed for four straight weeks, but as of Tuesday 25 August the rally has quietly stalled just beneath the weekly VWAP at 1.36331, a ceiling the market is testing from underneath. The pause is not random: speculators are already extreme long GBP according to COT data, and US real yields are sitting at 2.4%, a level that mechanically favors dollar strength. The direction everyone thinks they know may be the setup that punishes them. The framework carries a bearish bias on GBPUSD this week, but the conviction behind that call is deliberately low, and understanding why matters more than the label itself. The bearish case rests on two pillars: macro and positioning. On the macro side, Fed hawkishness combined with a 2.4% real yield creates conditions where the dollar should attract flows regardless of what the BOE does, because the USD is offering inflation-adjusted return that sterling cannot easily match. On the positioning side, COT data, which tracks the net futures positioning of speculative accounts, used here as a directional sentiment gauge rather than a standalone citable statistic since the specific report week and net-position figures are not available in this brief, shows speculators are already extremely long GBP. The practical implication of crowding risk, meaning positioning so concentrated on one side that the market runs out of new buyers, is that any negative catalyst does not just stop the rally: it triggers a cascade of exits from the same crowded trade, accelerating the move lower far beyond what fundamentals alone would justify. The problem is that everything else is still pointing up. Price action scores bullishly, the multi-timeframe alignment is entirely bullish, and the macro backdrop for sterling, firm rate-hike bets, subdued dollar, has not broken down. -- Intermarket Edge

USDCAD Week W34-2026: CAD Hits a 2.5-Month High, But the Bullish Case for USD Is Not Dead Yet

USDCAD Week W34-2026: CAD Hits a 2.5-Month High, But the Bullish Case for USD Is Not Dead Yet

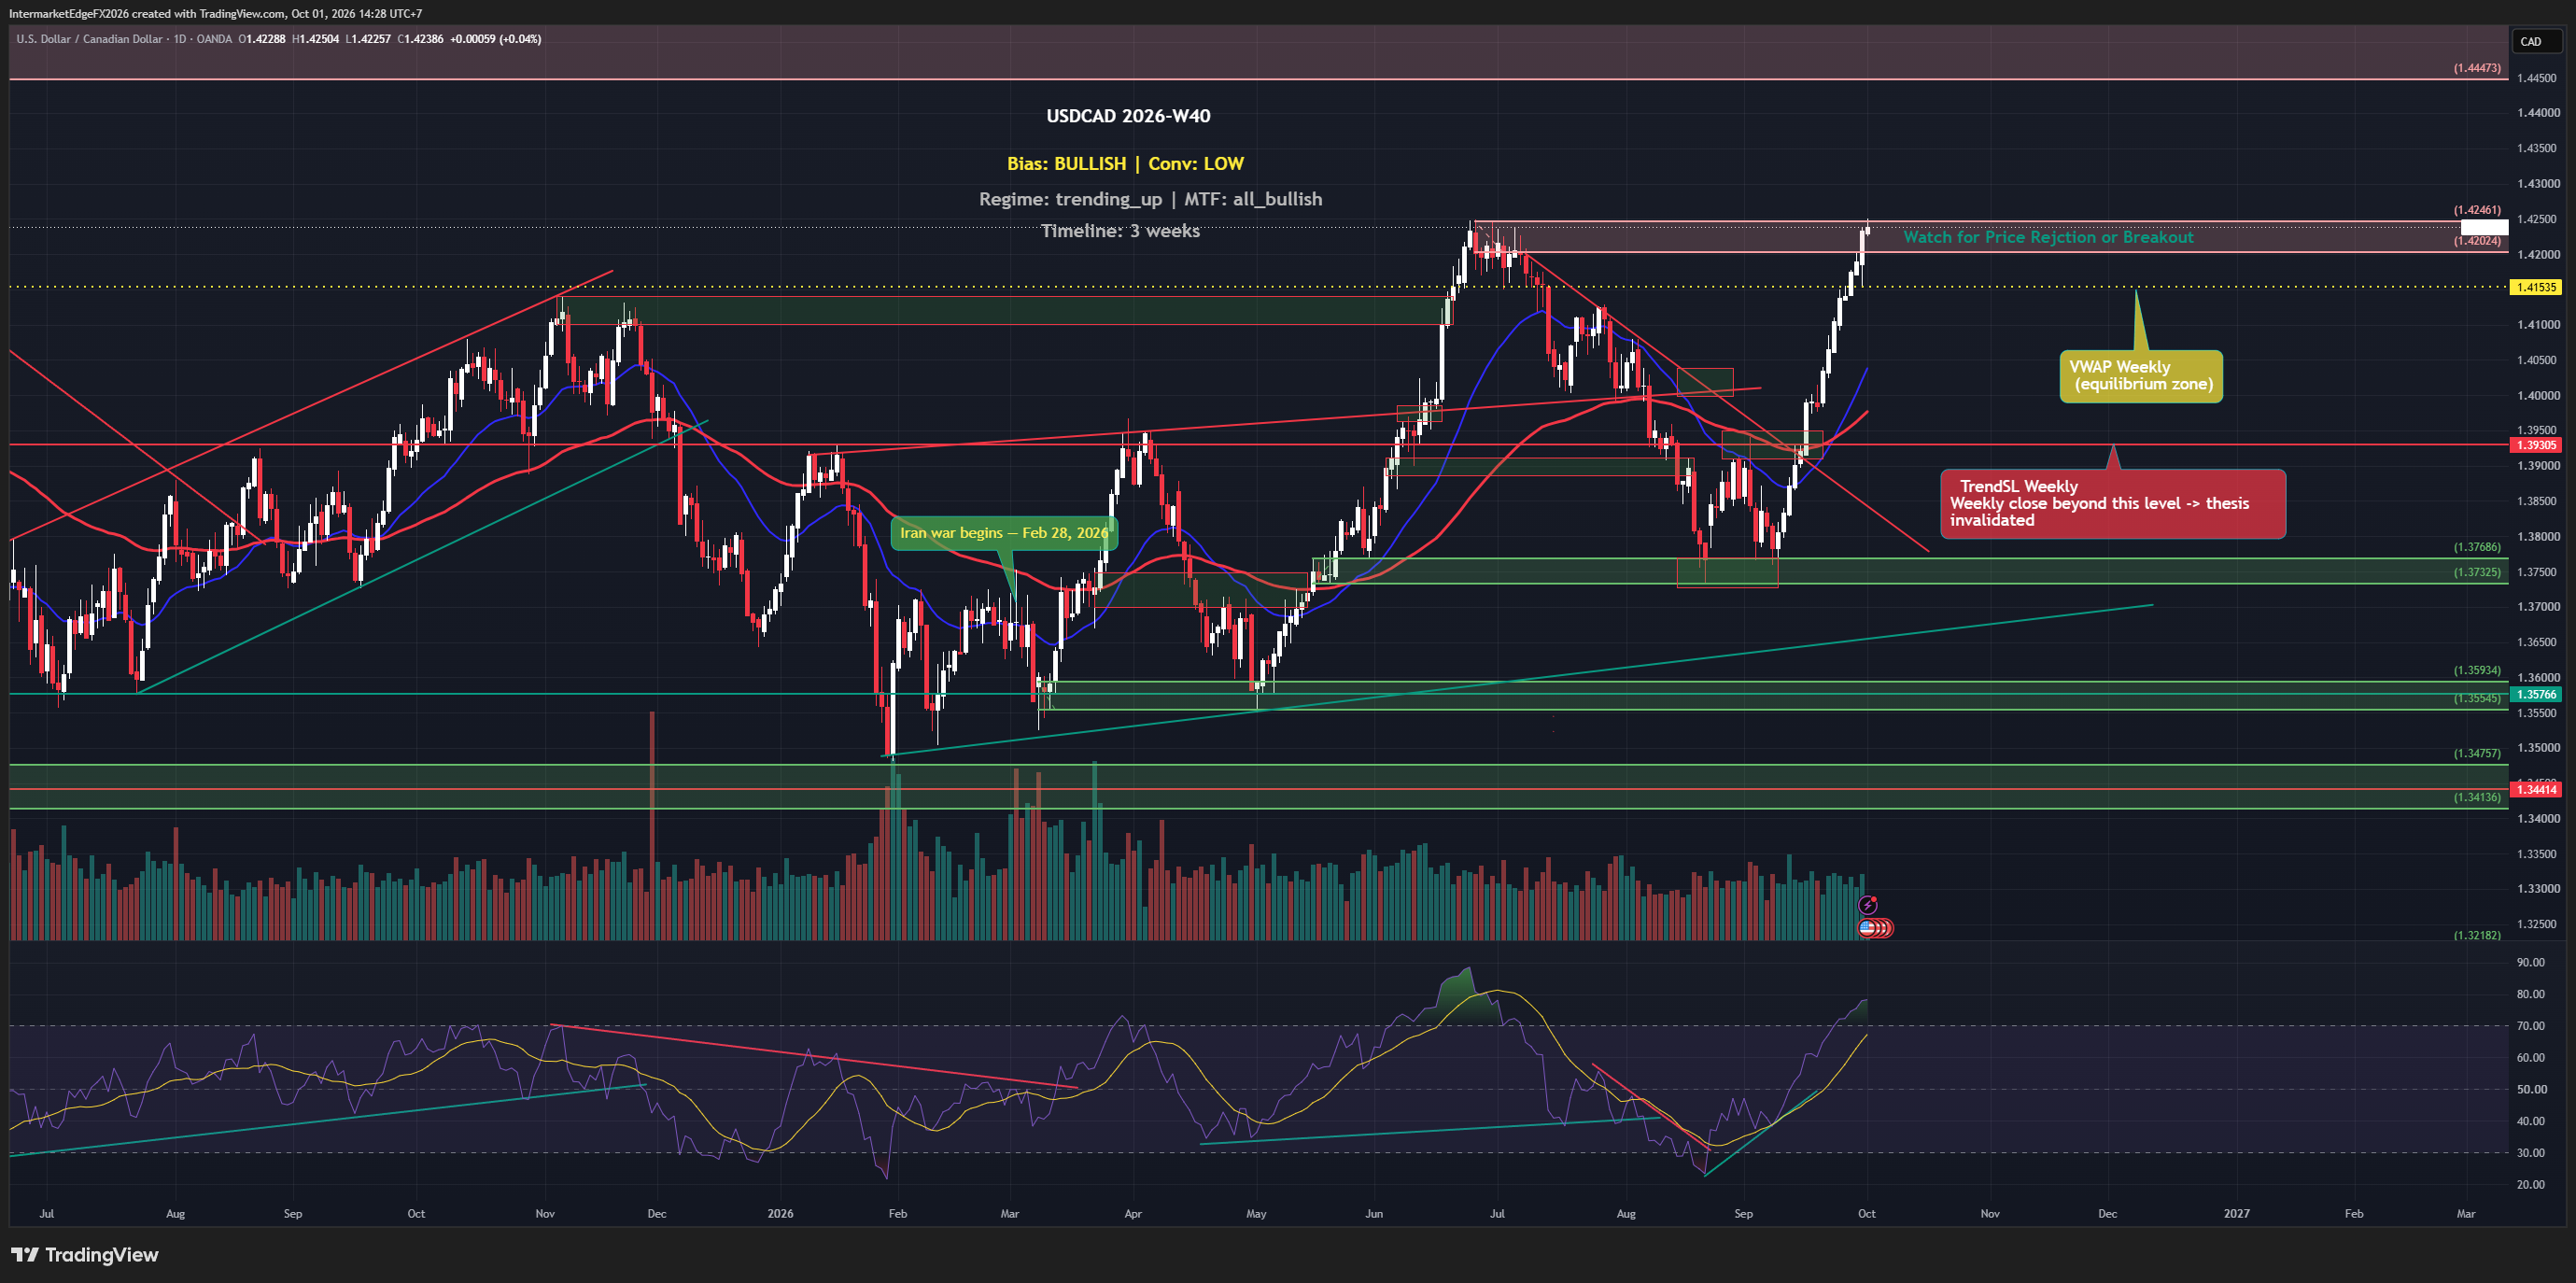
USDCAD is printing a bullish macro thesis this week, anchored by Fed hawkishness and rising real yields, yet as of Thursday, 20 August 2026, price at 1.37743 sits below both the weekly VWAP and the trend stop-loss level. The Canadian dollar just hit a 2.5-month high on a US tariff reprieve, and that headline momentum is running directly against the bullish USD framing. When macro and price structure disagree this sharply, the setup demands patience, not commitment. The framework carries a bullish bias on USDCAD this week, but that label comes with a structural caveat that matters enormously for how to read it. At the time the thesis was generated, the reference close of 1.37943 was already sitting below the weekly trend stop-loss at 1.39539, meaning the technical structure contradicted the bullish label from the outset. This is not a setup where price pulled back to test support after confirming the trend; it is a setup where the trend-defining level was never reclaimed in the first place. Treat the bullish designation as a framework-level view driven by macro and COT inputs, not as a technically-endorsed signal. The macro pillar is real: Fed hawkishness paired with a 2.41% real yield creates a genuine USD tailwind, and the rate differential does historically favor USD strength when the Fed is the more hawkish central bank. The COT picture adds a complementary angle, speculator positioning in CAD is at an extreme short, which historically precedes short-squeeze episodes where crowded trades unwind rapidly and push the currency higher than fundamentals alone would justify. COT crowding risk, as a concept, means that the more one-sided positioning becomes, the less fuel remains for the trend to extend, and any catalyst can flip the direction hard. -- Intermarket Edge (Note: COT (Commitment of Traders) data is released weekly by the CFTC with a reporting-period lag -- it is not a real-time position feed. See cftc.gov for the exact release schedule.)

EURGBP Week W34-2026: Sterling Dips on Labour Data but Holds Above 0.85519, Leaving Bulls Without a Technical Foundation

EURGBP Week W34-2026: Sterling Dips on Labour Data but Holds Above 0.85519, Leaving Bulls Without a Technical Foundation

EURGBP is sitting in a narrow corridor this week, above its weekly VWAP at 0.85519 but still pinned below the TrendSL at 0.85973, a gap of roughly 40 pips that tells two different stories. UK labour market data has cooled, sterling dipped in response, yet better-than-expected GDP for Q2 has given the pound enough footing to post a weekly gain. The pair's direction is technically labeled bullish, but the evidence behind that label is thin enough that standing aside is the deliberate call right now. The framework arrives at a bullish bias on EURGBP for the week of W34-2026, but it is important to understand what is actually driving that label before treating it as actionable. The sole active input is price-based, the positioning of price relative to key levels nudges the score marginally positive. Every other source that the analysis monitors, positioning data, macro rule sets, liquidity conditions, and sentiment, contributed nothing this week. That near-total absence of corroborating evidence is the defining characteristic of this setup, and it is why the deliberate decision here is to stand aside rather than size a position. A bullish label supported by only one weak input, with structural bias sitting at neutral, is not a setup, it is an unresolved question. The ECB versus BOE rate differential is named as the primary driver of the thesis. Rate differential is the interest rate gap between two central banks; in practical terms it determines the cost or benefit of holding one currency over the other, and when it shifts it tends to be the dominant force on a cross like EURGBP over a multi-week horizon. The conflict is that no macro rule actually fired this week despite that driver being identified, the named catalyst has not translated into a quantified signal. -- Intermarket Edge

USDCAD W33: The Bullish Thesis Is Still Waiting for Price

USDCAD W33: The Bullish Thesis Is Still Waiting for Price

USDCAD carries a bullish bias into Week W33-2026, yet every timeframe is aligned against that label. A core CPI miss, actual 0.0% versus the 0.2% forecast, has already taken pressure off the Fed narrative, and the Canadian dollar hit a two-month high as oil prices rose. The bullish case is real but structurally unconfirmed, and that gap between label and structure is exactly where traders get hurt. The framework carries a bullish bias on USDCAD for the next three weeks at medium conviction, meaning there is a directional view, but the evidence is not strong enough to treat it as a high-confidence positioning decision. The core argument rests on two pillars: Fed hawkishness anchored by elevated real yields, and a persistent rate differential that historically favours USD over CAD. Those fundamentals have not collapsed; they have simply been pressured by this week's inflation data and Canadian-specific positive news flow. What makes this setup genuinely difficult is a structural contradiction that was present from the moment the thesis was generated: the reference price at thesis time (1.39479) was already sitting below the weekly trend stop level (1.39824). That means the bullish label was issued without technical confirmation behind it, the trend structure was already contradicting the directional call. Traders should treat this as a low-confidence rule-engine override, not a textbook bullish setup. Compounding this, COT data shows speculator positioning is at extreme short levels, a condition called crowding risk, which refers to the danger that when too many traders are on the same side, any reversal can be violent and self-reinforcing as they all exit simultaneously. That crowding raises the probability of a short squeeze (a rapid covering rally driven by stop-loss orders rather than genuine demand) that could temporarily push USDCAD lower even as the fundamental bias points higher. -- Intermarket Edge (Note: COT (Commitment of Traders) data is released weekly

GBPUSD Week W33-2026: Sterling Climbs to a One-Month High While the Bearish Macro Case Quietly Builds Against It

GBPUSD Week W33-2026: Sterling Climbs to a One-Month High While the Bearish Macro Case Quietly Builds Against It

GBPUSD is trading at 1.35276 as of Wednesday, 12 August 2026, sitting above its weekly VWAP at 1.35004 and hovering near a one-month high for Sterling. A surprise Core CPI miss-actual 0.0% against a 0.2% forecast-briefly knocked the dollar's footing, but the broader macro argument for USD strength through elevated real yields hasn't structurally changed. The tension between what price is doing right now and what the macro environment implies is exactly the kind of setup that quietly catches traders off-guard. The framework's overall bias for GBPUSD this week is bearish over a three-week horizon, driven primarily by the BOE-versus-Fed rate differential-the gap between where each central bank's policy rate sits and where markets expect it to go-which currently favors the dollar because the Fed's commitment to restrictive policy is backed by real yields that remain historically elevated. When real yields are positive and rising, as the 2.4% US 10-year real yield suggests, capital tends to seek dollar exposure, which mechanically pressures currency pairs where the dollar is the quote side, like GBPUSD. Several reinforcing causal chains support this logic: Fed hawkishness sustains USD demand, and a DXY that finds its footing would directly compound downward pressure on Cable. The critical caveat-and it is not a minor one-is that the price-based and positioning-based evidence is pointing in the opposite direction. COT data (directional evidence only; the brief does not specify the report week, net-position figure, or release date, so treat this as a sentiment lean rather than a precise citable statistic) is reading bullish on Cable positioning. -- Intermarket Edge

USDCAD Week W32-2026: Canadian Dollar Hits Six-Day Low as Oil Drops and Dollar Steadies Near 1.40665, but Bearish DXY Bias Keeps the Bull Case Fragile

USDCAD Week W32-2026: Canadian Dollar Hits Six-Day Low as Oil Drops and Dollar Steadies Near 1.40665, but Bearish DXY Bias Keeps the Bull Case Fragile

USDCAD is trading at 1.40665 as of Wednesday, 05 August 2026 at 08:31 UTC, holding above its weekly VWAP of 1.40112 even as the broader dollar faces pressure from Yen intervention spillover and Middle East-driven risk sentiment. The Canadian dollar recently hit a six-day low as oil prices dropped, lending short-term support to the pair. The bullish bias this week is real but fragile, conviction is low, the regime is ranging, and the macro case rests almost entirely on Fed hawkishness and rising real yields rather than any confirmed price-action breakout. The directional bias for USDCAD in Week W32-2026 is bullish, but conviction is low, a designation that carries real practical meaning for position sizing and risk management. The two active drivers supporting the upside case are COT positioning, which is skewed bullish (note: the brief does not specify the exact report week, net-position figure, or release date for this COT reading, so it should be treated as directional evidence rather than a standalone statistic), and macro fundamentals, specifically the Fed's hawkish stance and rising US real yields. The causal chain runs as follows: a hawkish Fed holding rates elevated or signaling further tightening pushes US real yields higher, which widens the rate differential between USD and CAD, making dollar-denominated assets relatively more attractive and supporting USDCAD. This is a coherent and well-established transmission mechanism in FX. However, the bullish case has a critical structural weakness: price action itself is not confirming the thesis. Momentum, liquidity, and sentiment signals are all neutral this week, meaning the market is not yet pricing in the macro story with any conviction. The multi-timeframe alignment is bearish-mixed, which is a direct caution flag, lower timeframes are not aligned with the weekly directional call. -- Intermarket Edge

Stay in the loop

Get notified about new research, macro insights, and market analysis.

InterMarketEdge

© 2026 InterMarketEdge. Financial intelligence for inter-market traders.