Intermarket Analysis — InterMarketEdge

Intermarket Analysis

Cross-asset correlation studies — how oil, yields, equities, and FX interact and what divergences signal

USDJPY W41: An Uptrend With a Momentum Warning

USDJPY W41: An Uptrend With a Momentum Warning

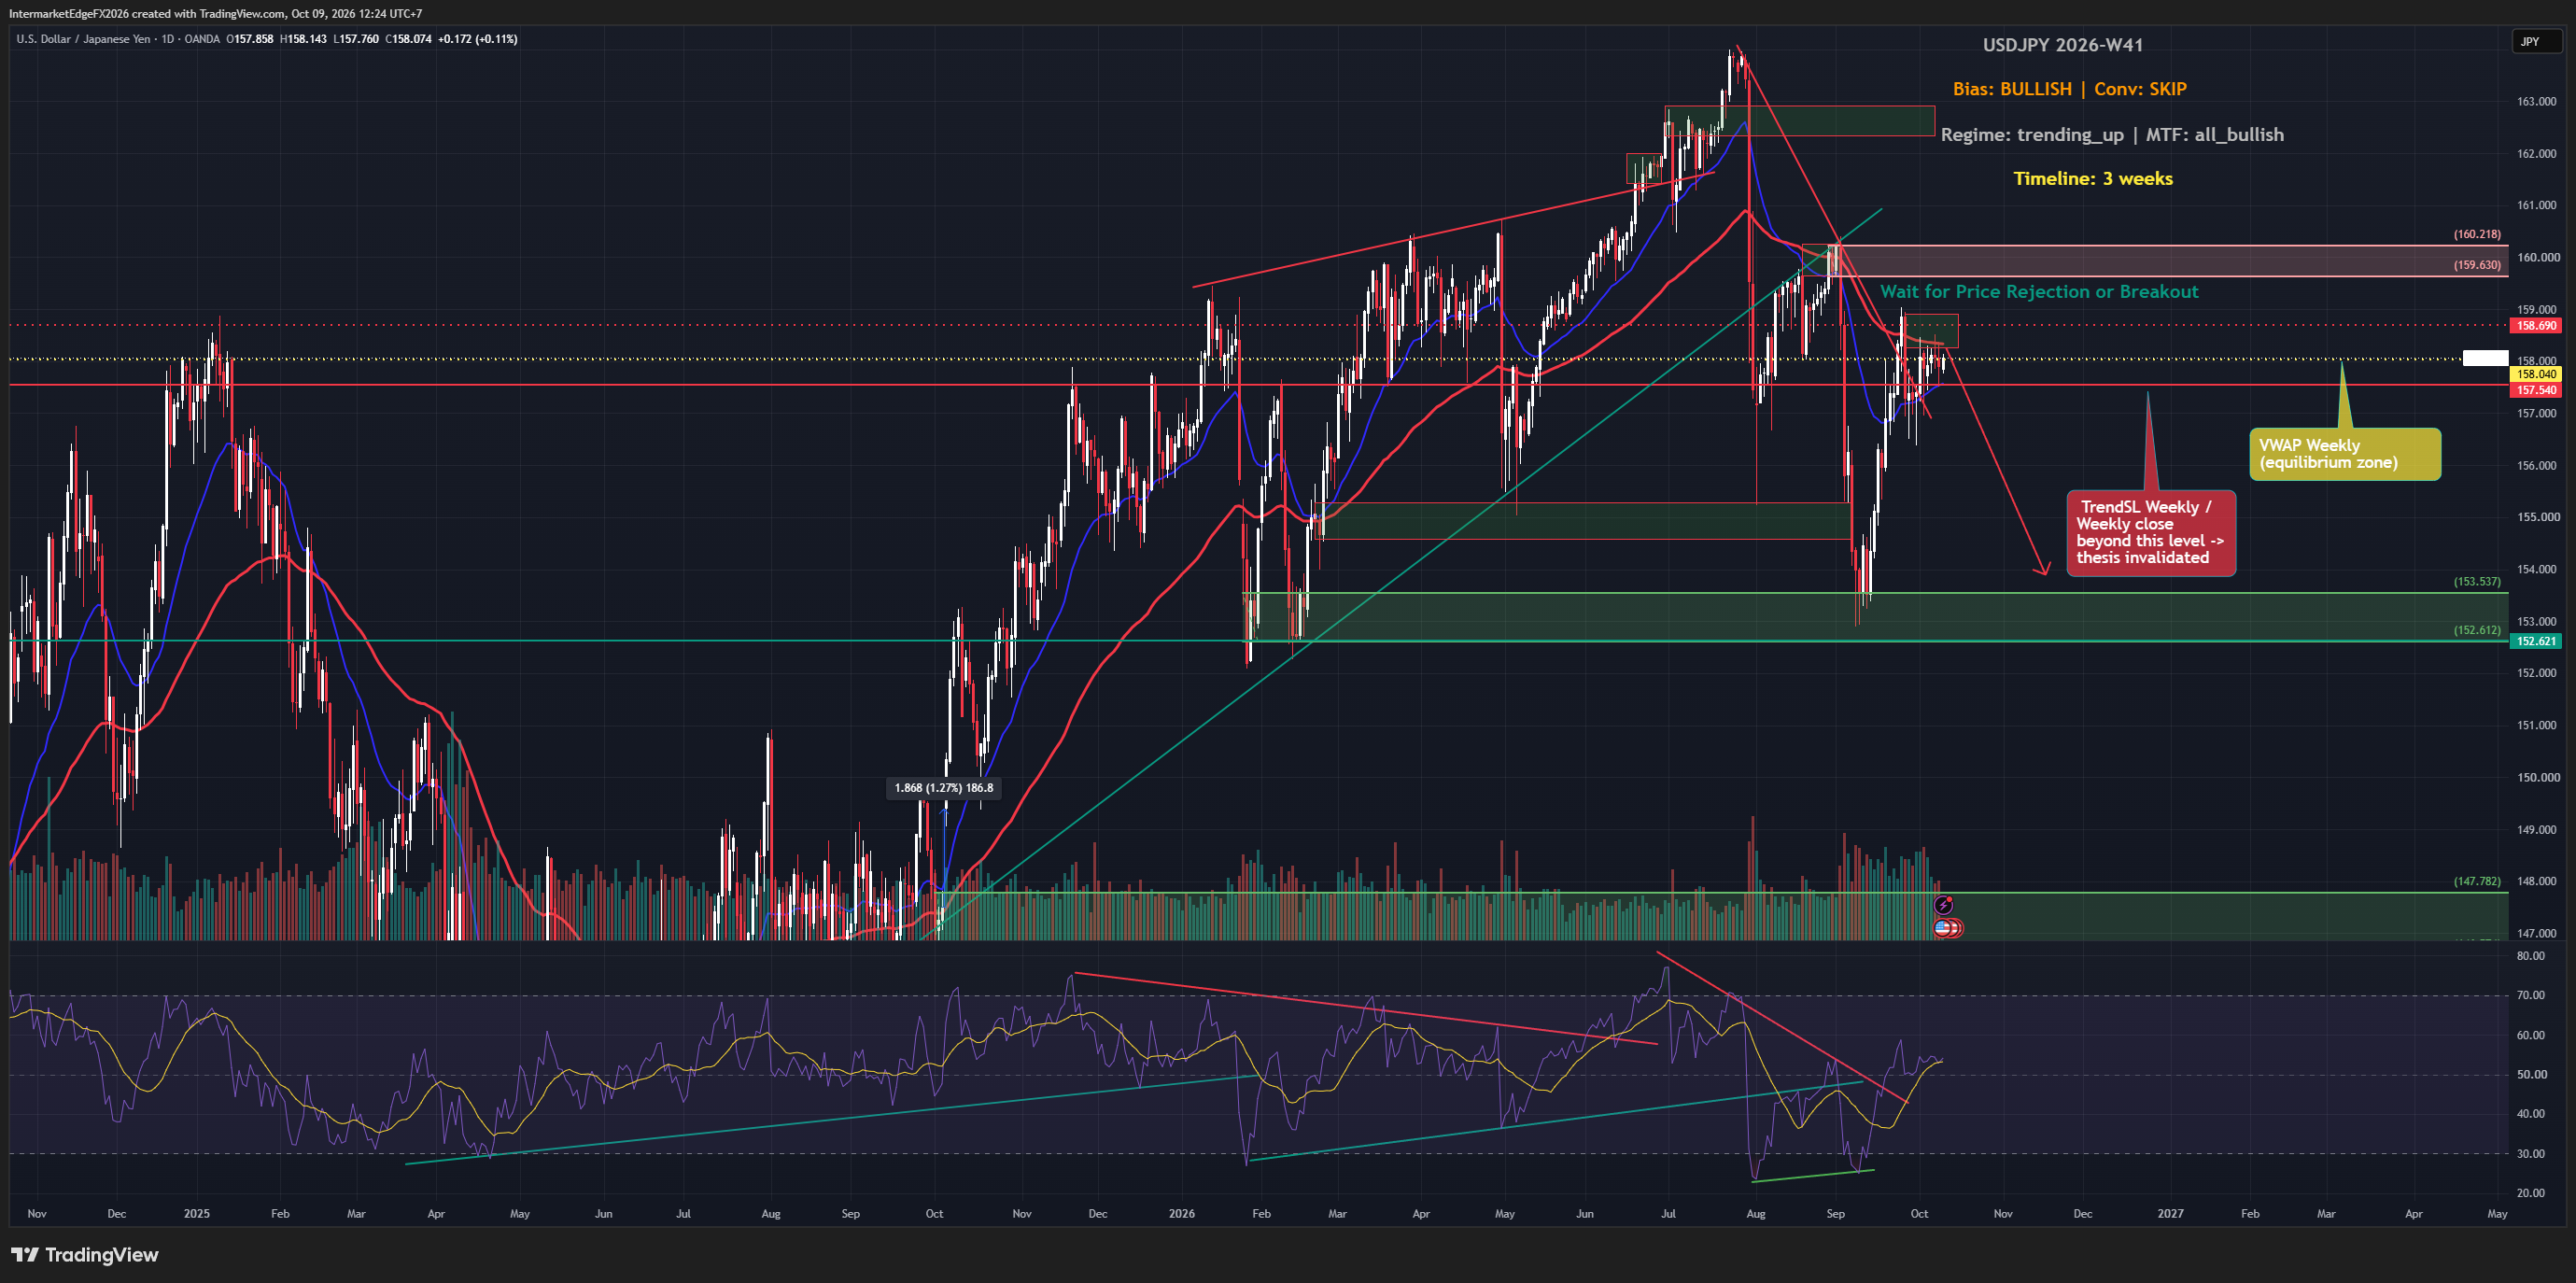
USDJPY W41 | An uptrend with an active momentum warning At 04:54 UTC on October 9, 2026, USDJPY was 157.811 on MT5 USDJPY.sml:1m. Price 157.81 is below weekly VWAP 158.04. The adverse momentum warning is already active, not a future condition. Price remains above TrendSL 157.54. Only a completed weekly close below 157.54 would invalidate the bullish structure. That condition is pending; an intraday crossing is insufficient. A sustained recovery through the weekly average would prompt reassessment of momentum. This does not require a weekly close. The decision at the snapshot is to stand aside, with a three-week review window. Japan's August real household spending fell 3.1% YoY but increased 0.1% MoM seasonally adjusted, according to the supplied Mace News headlines. Compare fresh US-Japan yields and dollar behavior; equity weakness alone does not establish yen inflows. FXSSI Current Ratio collected at 04:54:25 UTC on October 9: 57% Buy / 43% Sell. Collection time, not verified provider observation time. This broker retail sample is not the whole FX market or a standalone entry signal. Intermarket Edge | Institutional Macro & Intermarket Analysis For informational purposes only. Not financial advice.
GBPUSD W41: Sterling Outperforms the Euro, but the Dollar Test Remains

GBPUSD W41: Sterling Outperforms the Euro, but the Dollar Test Remains

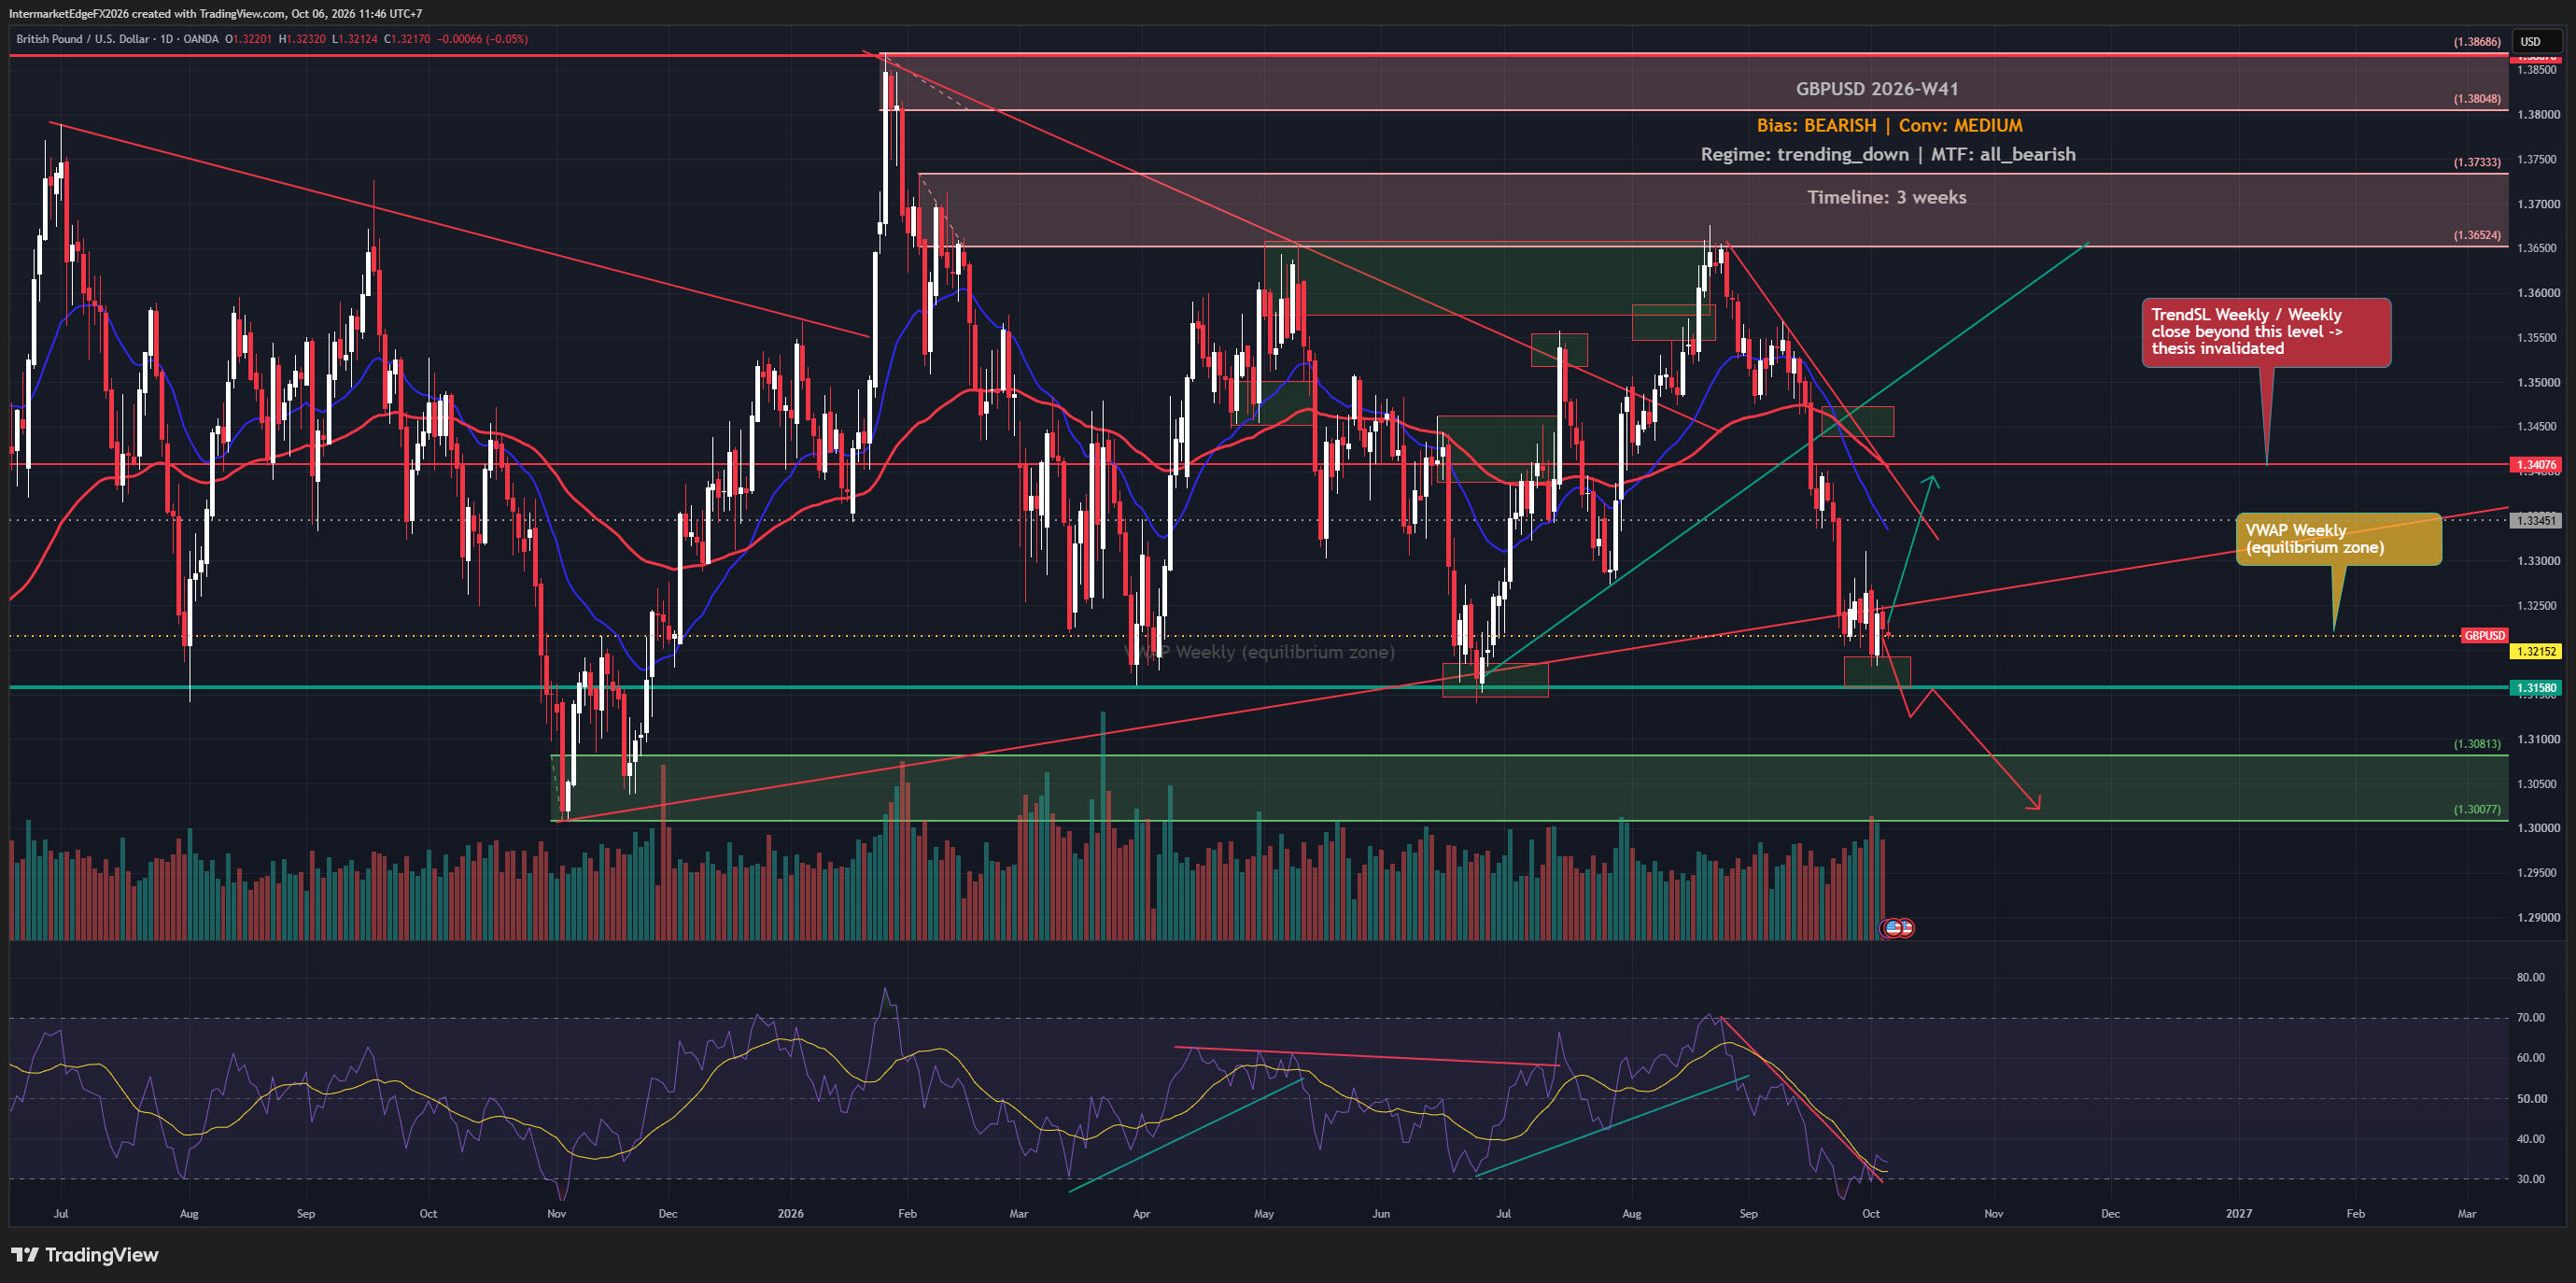
GBPUSD W41 | A bearish structure with an active momentum warning Sterling strength against the euro does not establish strength against USD. Amundi's more favorable GBP view also came alongside a positive dollar view. At 04:36 UTC on 06 October 2026, GBPUSD was 1.3228 (MT5 GBPUSD.sml:1m). Price is already above weekly VWAP 1.32152; the warning against bearish momentum is active now. Price is below weekly TrendSL 1.34076. Only a completed weekly close above 1.34076 would invalidate the bearish structure. That condition remains pending; an intraday touch is insufficient. The outlook remains bearish with medium conviction over a three-week review horizon. Timing is less clear. Existing shorts warrant a risk review now; a new position can wait for stronger agreement. Compare fresh dollar moves and matching UK-US yield observations rather than inferring the pair's direction from EURGBP alone. ForexFactory lists FOMC minutes for October 7 and Bailey remarks for October 8 on its UTC calendar. These are secondary-source listings, not officially verified schedules. Prices above are dated references, not live quotes. FXSSI collected on October 6 at 04:36:18 UTC: 69% Buy / 31% Sell for GBPUSD. Collection time, not provider observation time. This broker retail sample does not represent the entire FX market and is not a standalone entry signal. Intermarket Edge | Institutional Macro & Intermarket Analysis For informational purposes only. Not financial advice.
EURJPY W40: Hotter Tokyo Inflation Supports Yen, but Bears Still Lack Confirmation

EURJPY W40: Hotter Tokyo Inflation Supports Yen, but Bears Still Lack Confirmation

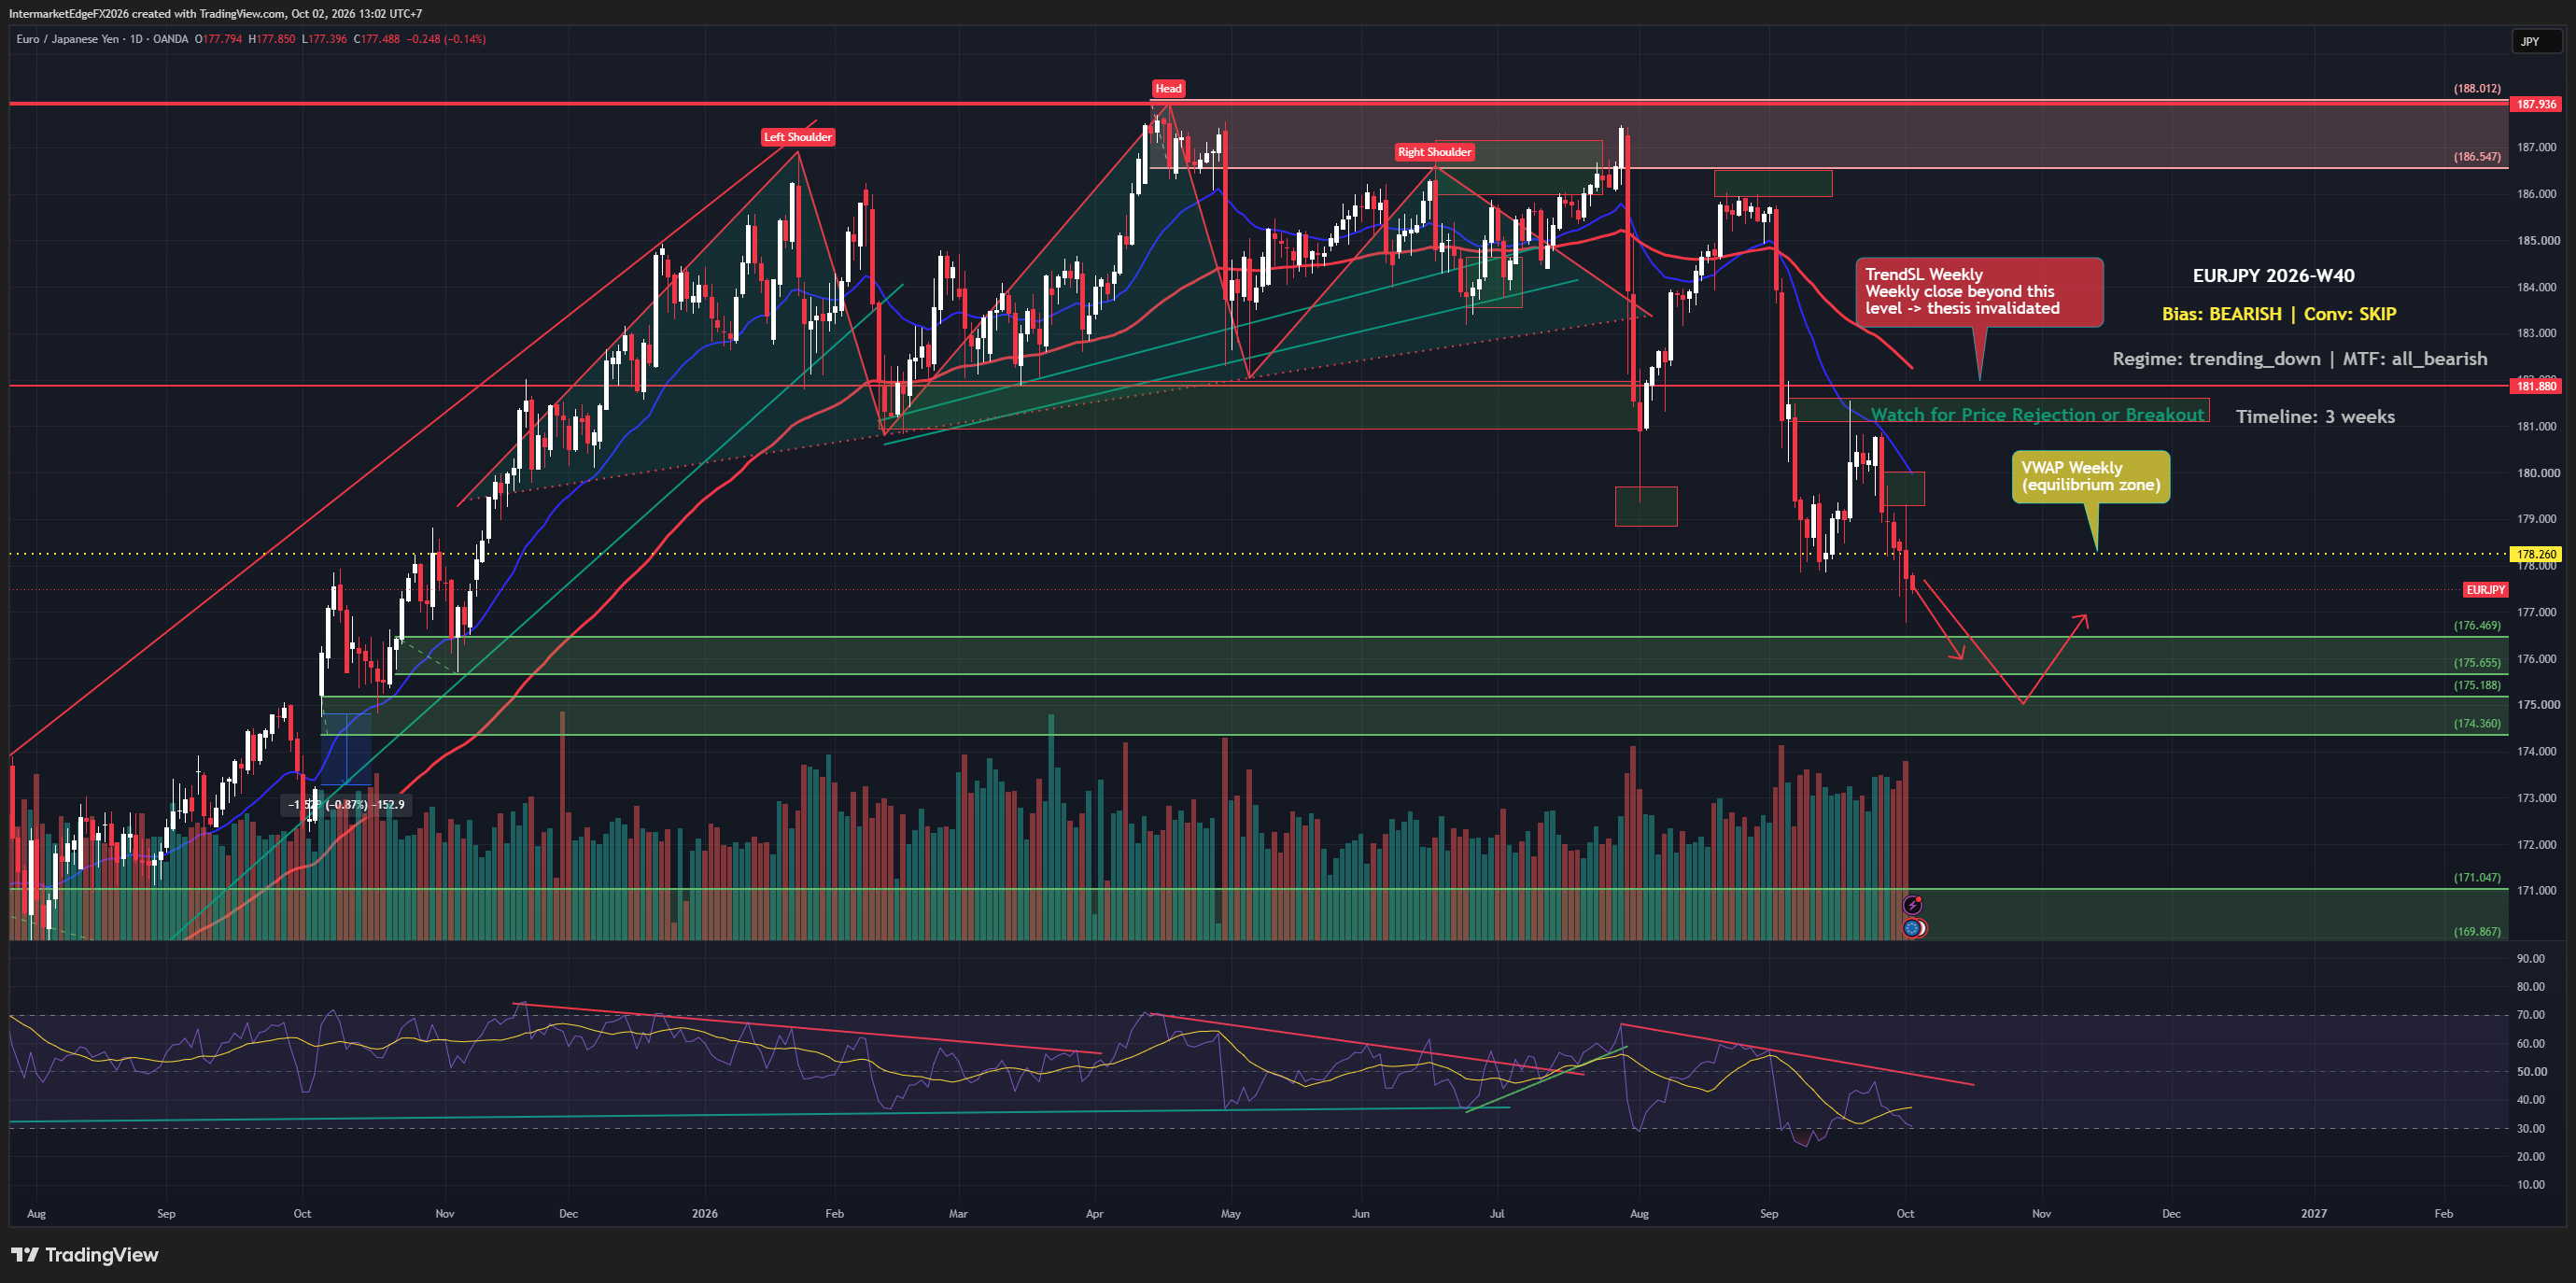
Japan's September Tokyo core-core CPI just printed 3.0% year-on-year against a 2.4% forecast, a significant beat that strengthens the case for BOJ policy tightening and yen appreciation. EURJPY is sitting at 177.59 early Friday, below the weekly VWAP at 178.26, with all timeframes aligned bearishly. The directional case looks clean. The conviction, however, does not, and that gap between direction and certainty is exactly where traders get hurt. The directional lean for EURJPY over the next three weeks is bearish, driven by two converging forces: a BOJ that is being pushed toward further tightening by inflation data that keeps exceeding expectations, and a euro that Reuters described as lagging the dollar during September. When the yen strengthens and the euro weakens simultaneously, EURJPY gets hit from both sides, the numerator falls and the denominator rises. That is the structural setup here. However, the analytical framework is deliberately standing aside rather than treating this as an actionable bearish entry. The reason is a direct conflict between the macro and technical signals: while the regime reads trending-down and all timeframes align bearishly, raw price action is generating a bullish technical signal that cannot be dismissed. This is not a minor discrepancy, it is an explicit disagreement between two evidence streams that normally need to be in agreement before sizing a position. Layered on top of this, the structural longer-term bias for EURJPY remains bullish, meaning that any short positioning is trading against the underlying trend. The retail crowd is 60% net long the pair as of October 2, which provides a contrarian lean toward the bear case, when the crowd is wrong, it tends to be wrong in the direction they are positioned, but this reading alone is not enough to override the technical conflict. -- Intermarket Edge

USDJPY Week W39-2026: JGB Yields Hit 30-Year Highs Yet the Yen Still Can't Rally -- Who Is Trapped?

USDJPY Week W39-2026: JGB Yields Hit 30-Year Highs Yet the Yen Still Can't Rally -- Who Is Trapped?

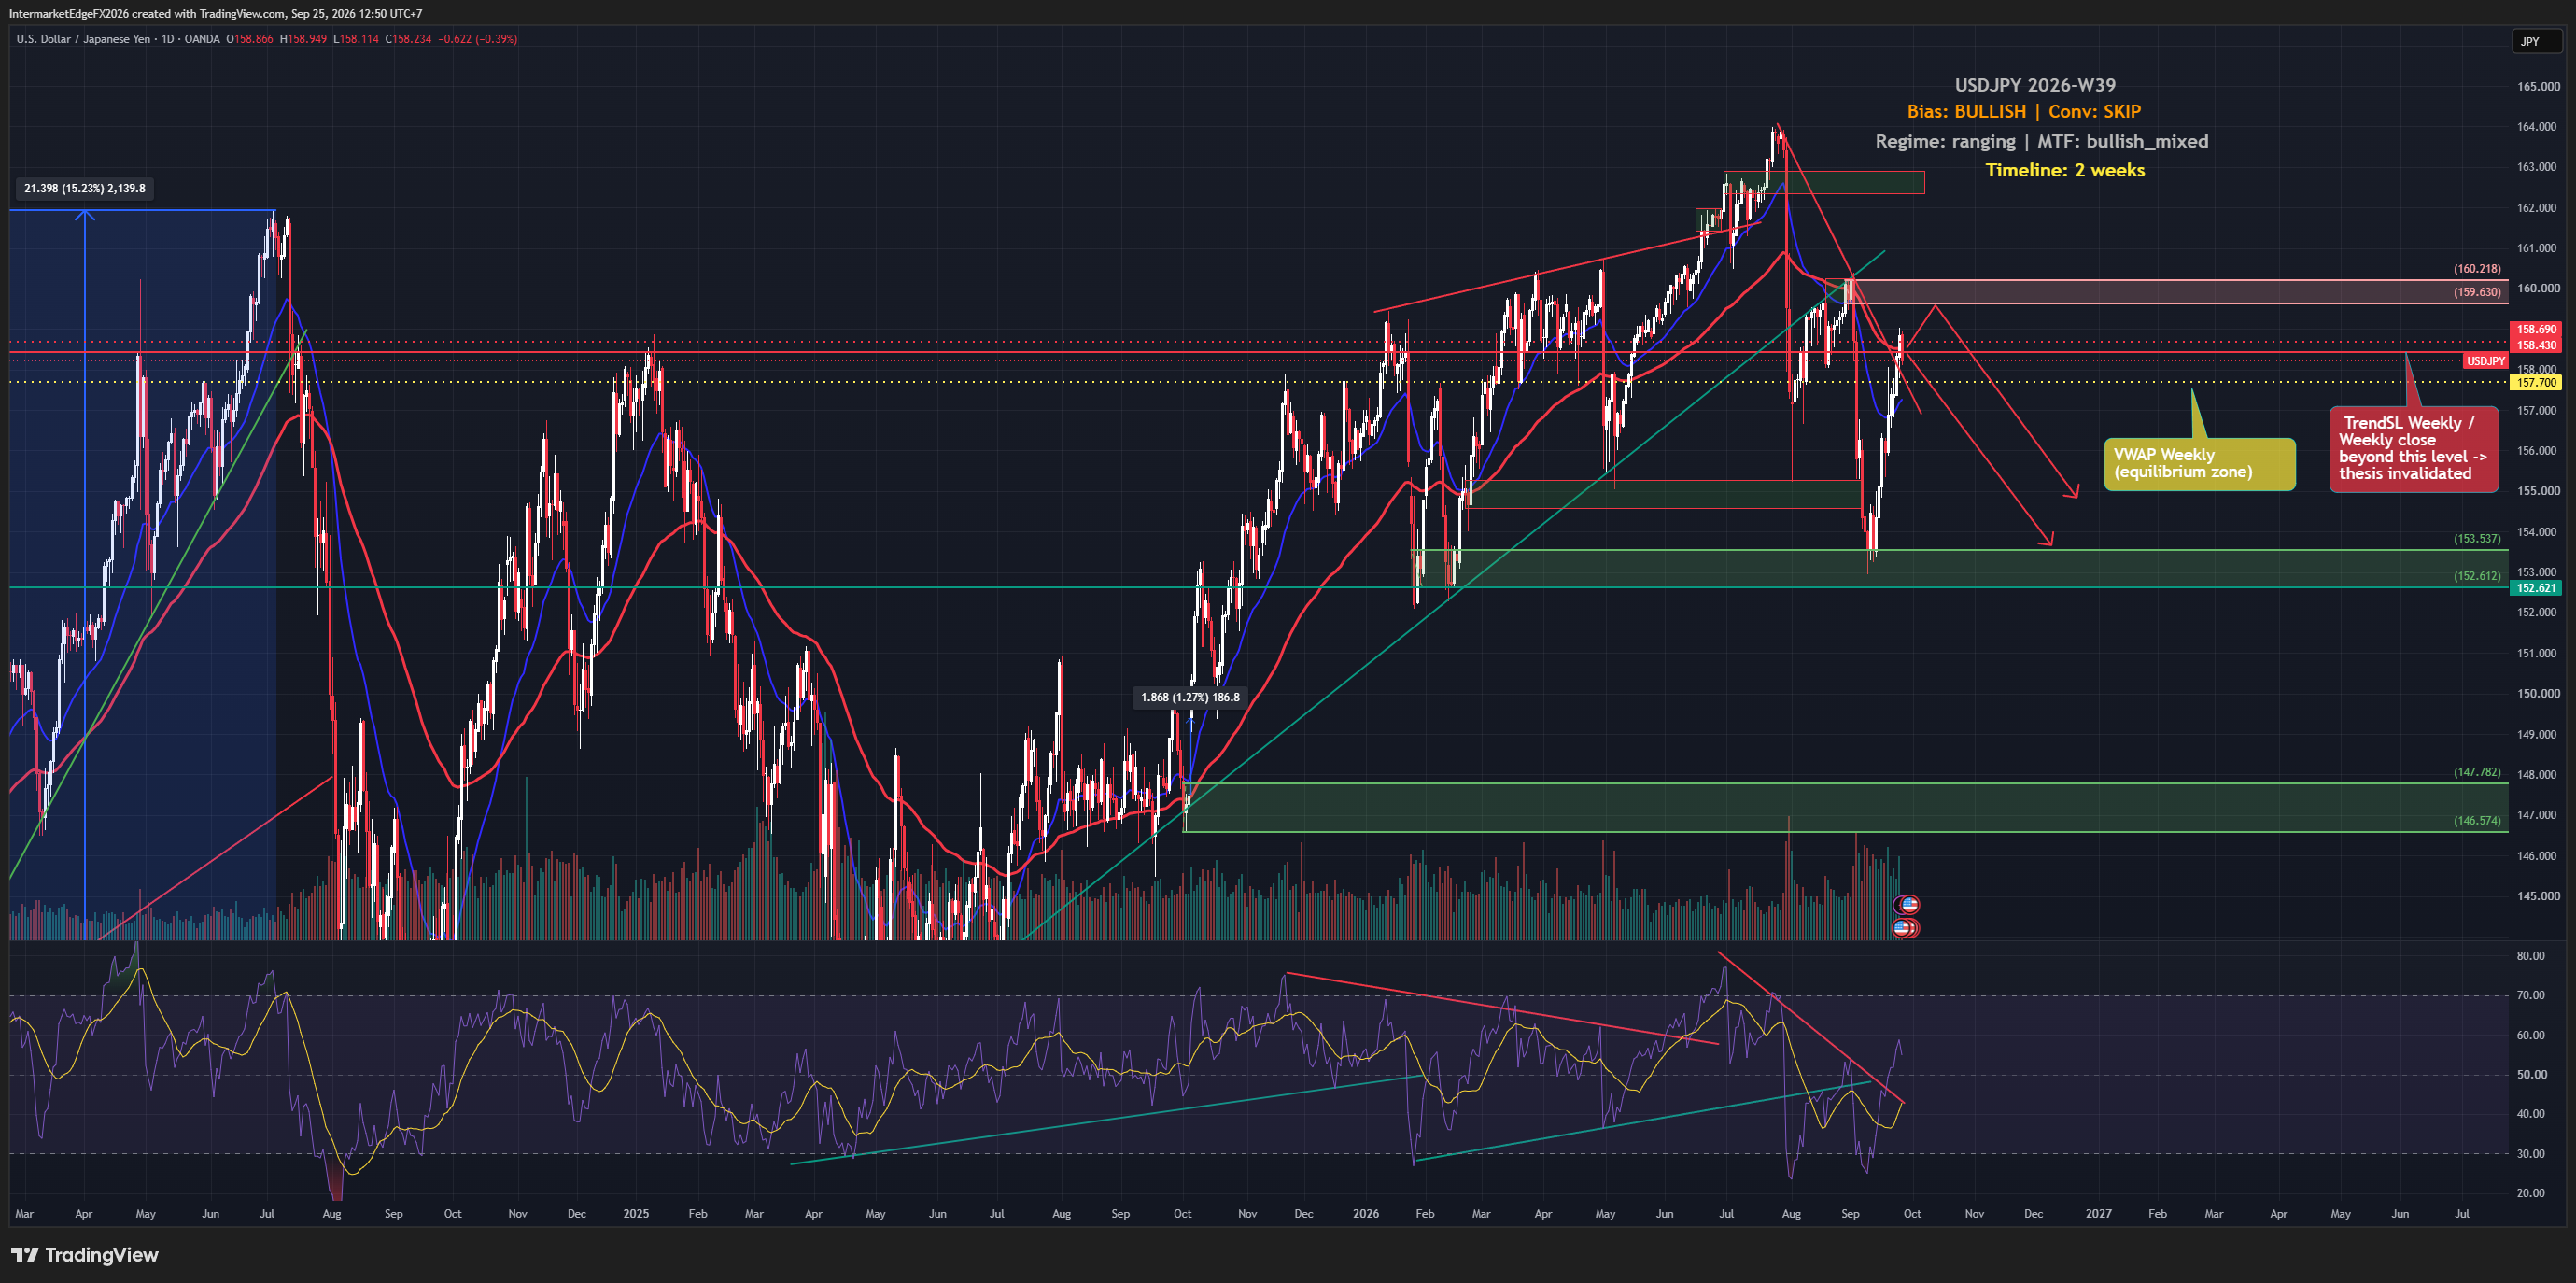
USDJPY is sitting at 158.47 as of Friday, 25 September 2026, having just cleared the weekly TrendSL at 158.43, a level that, if held on close, would mark the first genuine technical alignment with the bullish bias. But that clearance is barely four pips wide, and it arrives at the same moment Japan's 10-year JGB yield has surged to 3.115%, its highest since August 1996, raising serious questions about whether the yen's weakness can last. The analytical framework produces a bullish bias for USDJPY over the next two weeks, but the conviction attached to that bias is low enough that standing aside is the deliberate call, not because the direction is wrong, but because the evidence is not yet convincing enough to size a meaningful position. Understanding why requires separating the two forces that should, in theory, both be clear: macro supports dollar strength through rising US real yields and hawkish Fed expectations, and price action has technically edged above the weekly TrendSL at 158.43. That combination sounds straightforward. What makes it fragile is the COT signal, positioning data from derivatives markets shows speculative traders are already carrying a significant net bearish lean on USDJPY. The COT reading reported here should be read as directional evidence rather than a standalone citable statistic, since the specific report week, release date, and exact net-position figures are not available in this brief, but the directional weight it carries is material enough to cancel the bullish case built by price action alone. The deeper risk is structural. BOJ hawkishness is the most important counterweight in this cycle: higher Japanese yields can encourage repatriation and make yen-funded positions more expensive, allowing USDJPY to fall quickly if policy expectations shift. -- Intermarket Edge

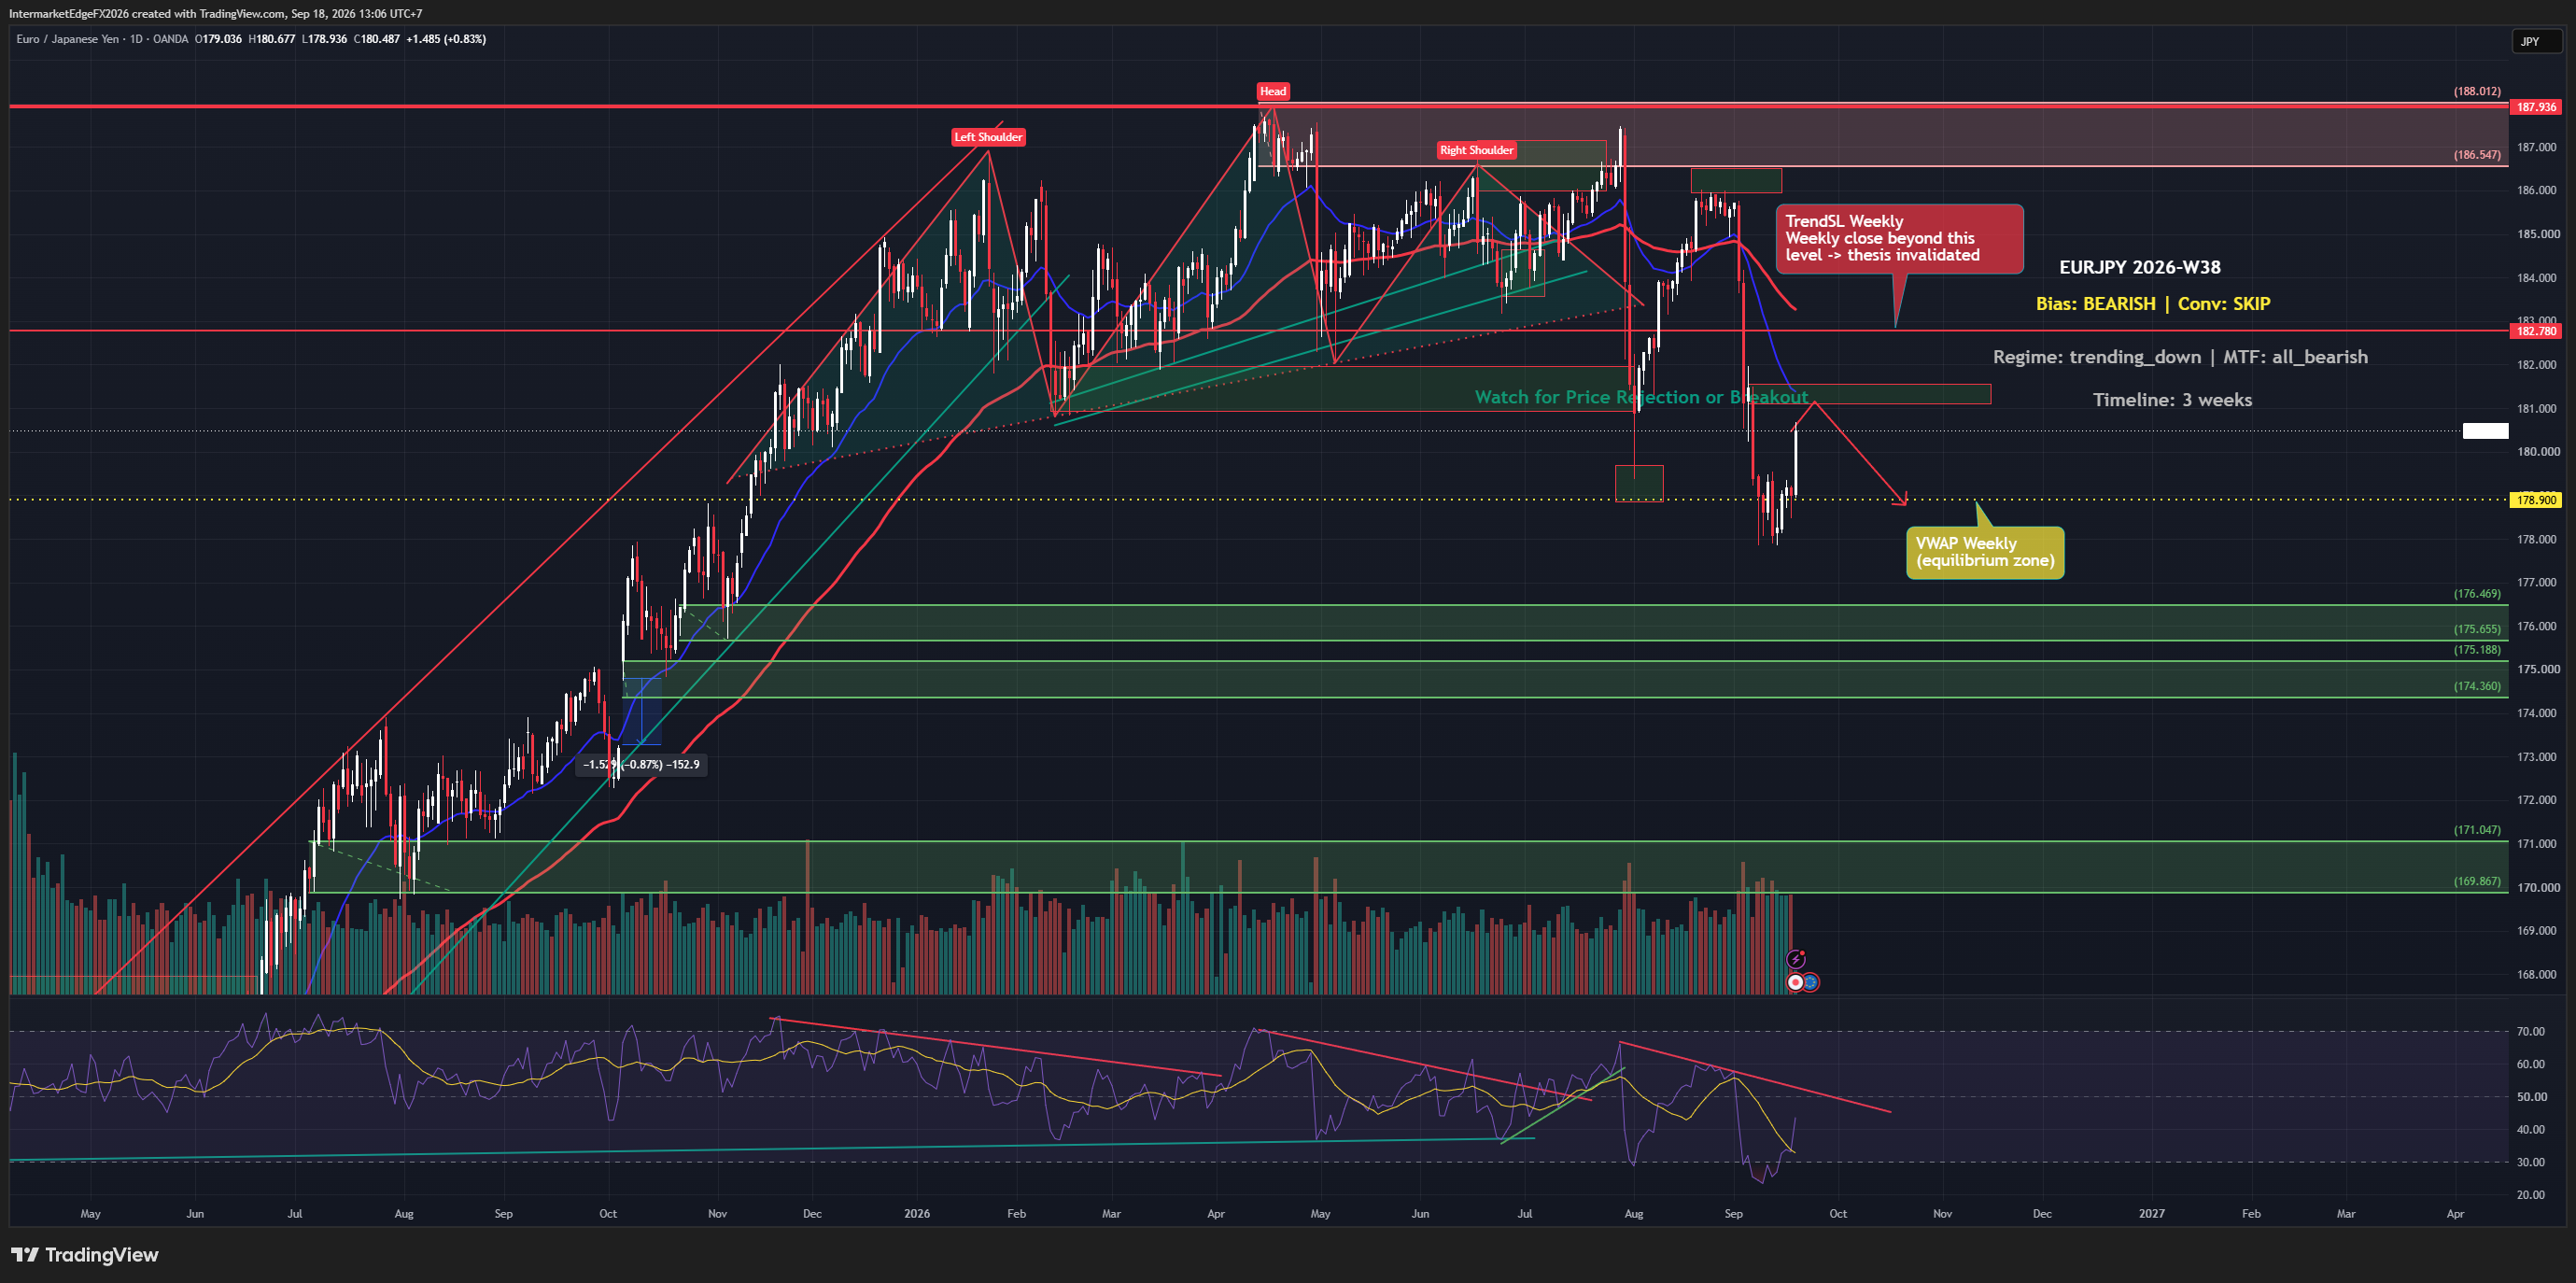
EURJPY W38: BOJ Hikes, but Yen Weakness Leaves Bears Without a Clear Entry

EURJPY W38: BOJ Hikes, but Yen Weakness Leaves Bears Without a Clear Entry

The Bank of Japan just delivered its highest policy rate in 31 years, lifting to 1.25% on September 18, and the yen weakened 0.8% in response. That gap between the headline and the market reaction is the most important signal EURJPY traders need to understand this week. When a hawkish catalyst fails to move the currency in the expected direction, the burden of proof for a carry unwind, where yen-funded positions get rapidly unwound, driving JPY sharply stronger, shifts materially higher. The directional lean on EURJPY is bearish, anchored by two structural arguments that point the same way without yet delivering the confirmation needed to size a position with confidence. The first is regime: the cross has been in a trending-down structure across multiple timeframes, with all timeframe signals aligned bearish. In a trending regime, the path of least resistance is continuation, the question is always whether the trend retains enough energy to keep pulling price lower, or whether it is exhausting itself before a meaningful catalyst arrives. The second argument is the carry unwind risk that the BOJ's rate path creates. A carry unwind happens when the cost of maintaining a short-yen, long-risk position rises fast enough, or when risk sentiment deteriorates sharply enough, that traders close those positions simultaneously, buying back yen and selling the funded assets. The BOJ's September 18 hike was a 7-2 vote with two board members explicitly opposing it on the grounds that growth was insufficient and inflation had not accelerated enough. The BOJ itself retained guidance for further increases, conditional on the inflation outlook being realized, but Japan's August core CPI came in at 1.7% year-over-year, below the 1.8% expected. That miss matters: it suggests the conditions the BOJ needs to justify the next hike are not yet in place, which reduces the urgency of carry unwind pressure in the near term. -- Intermarket Edge

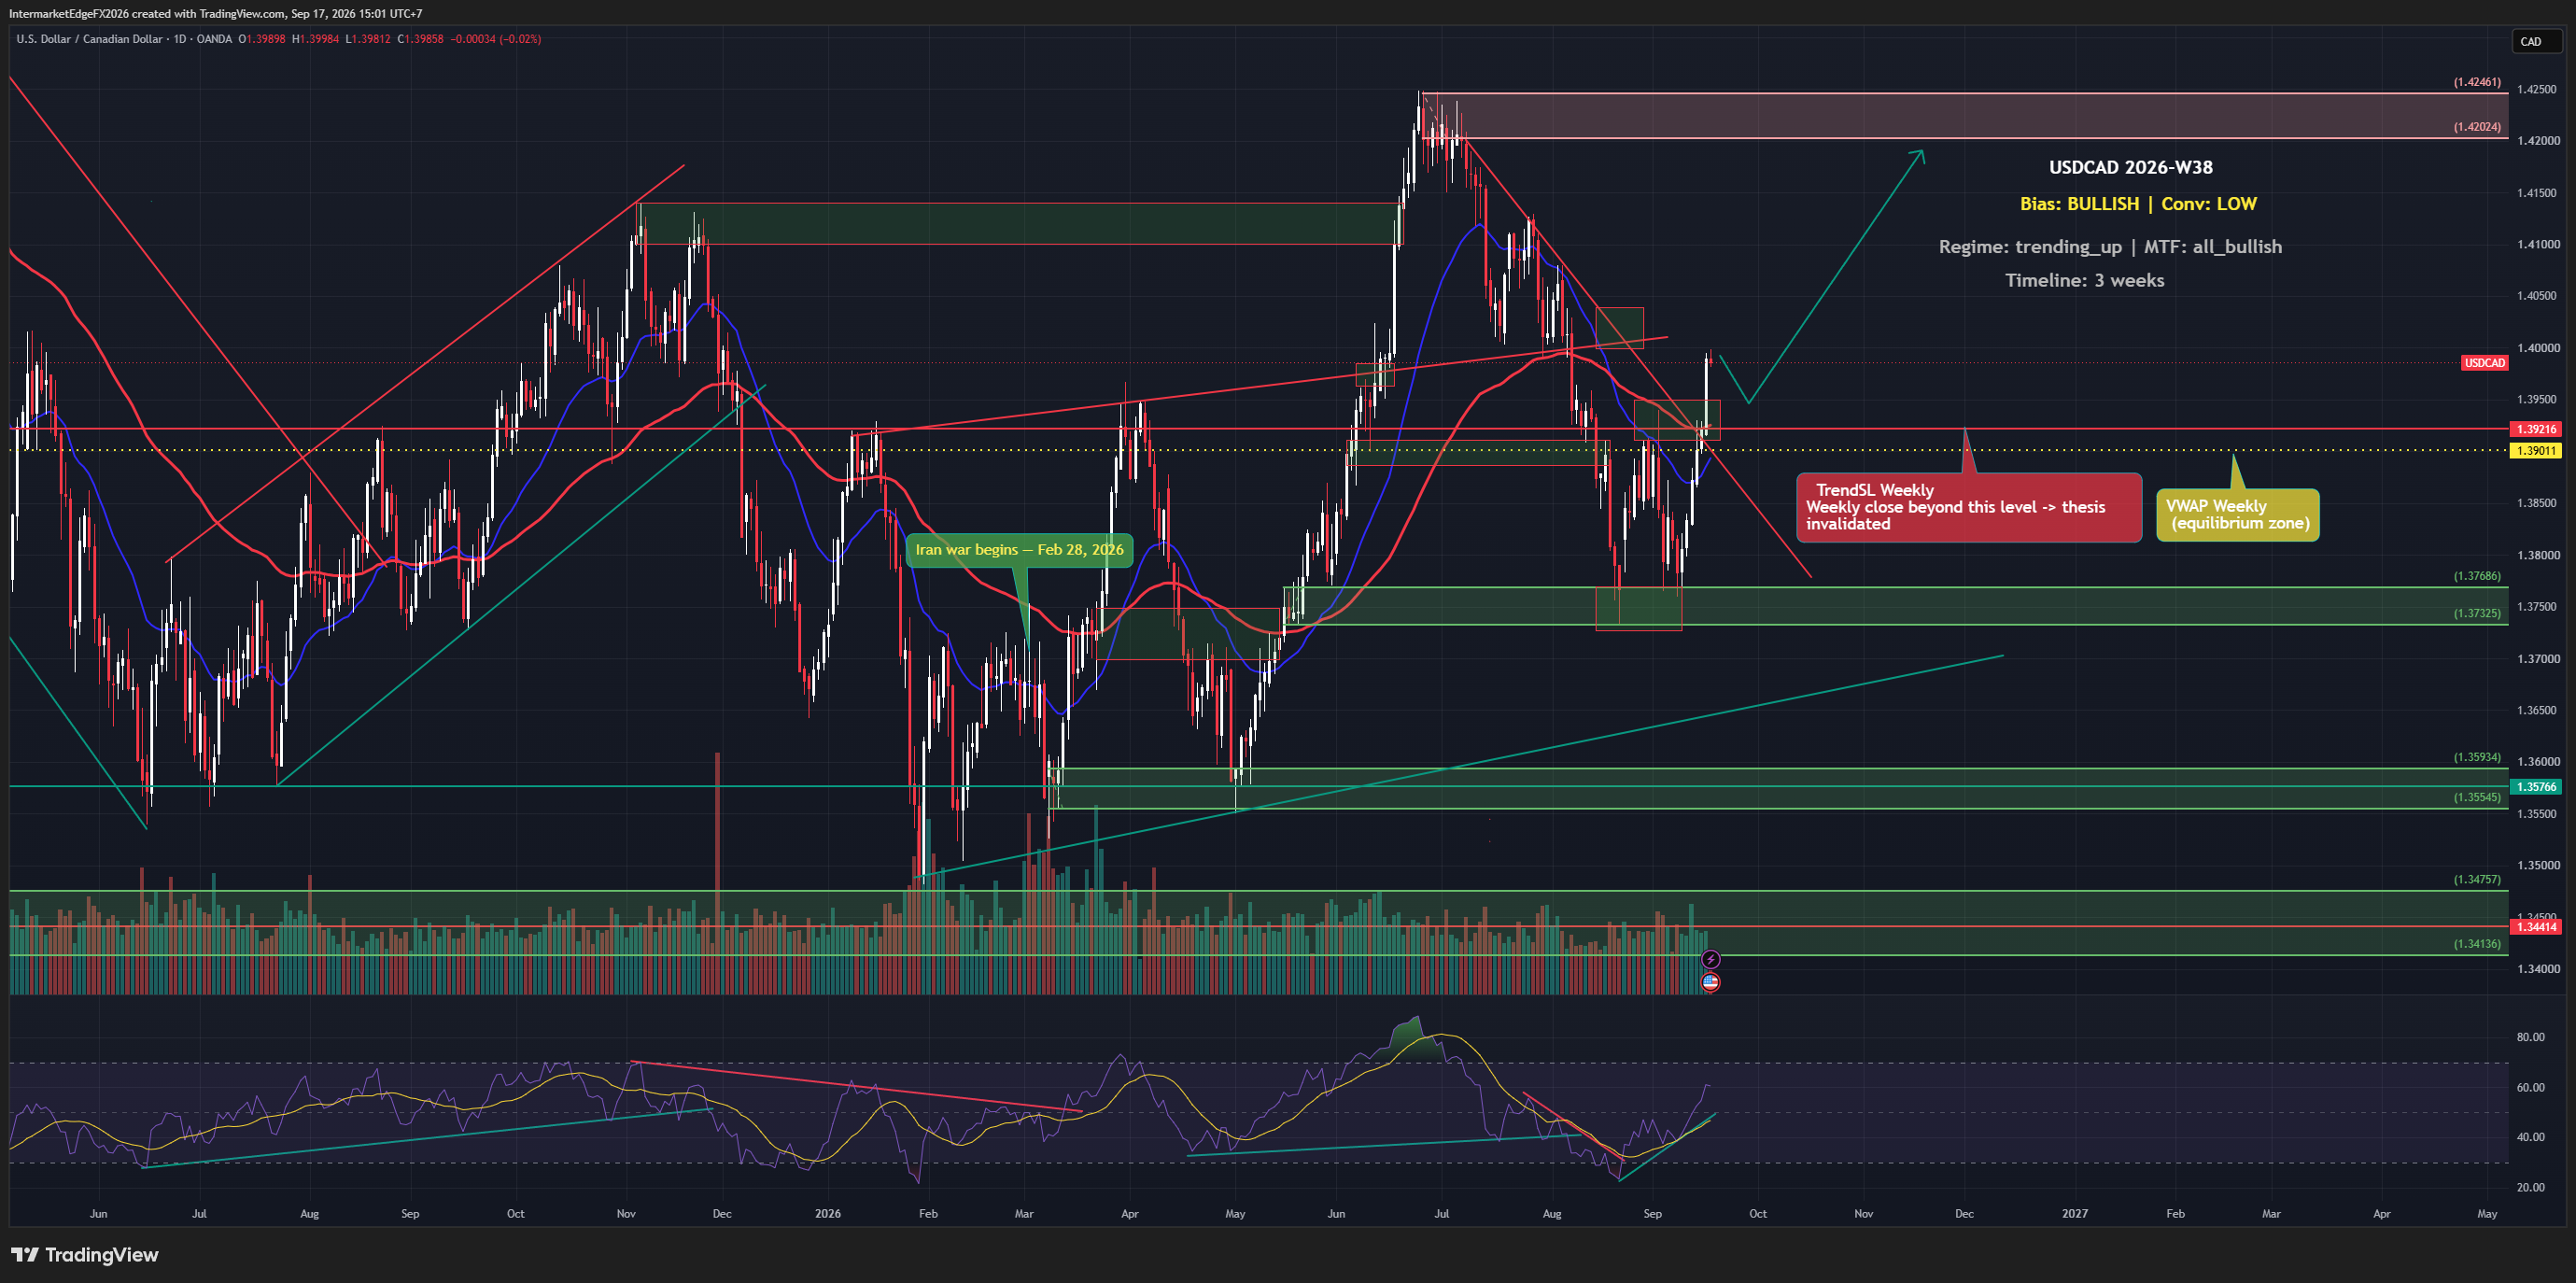
USDCAD Week W38-2026: Fed Raises to 3.75%-4.00% and the Canadian Dollar Hits Its Weakest Level Since August 7

USDCAD Week W38-2026: Fed Raises to 3.75%-4.00% and the Canadian Dollar Hits Its Weakest Level Since August 7

The Federal Reserve delivered a unanimous 25-basis-point hike to 3.75%-4.00% on September 16, and sixteen of eighteen policymakers are signaling at least one more increase before year-end. USDCAD responded immediately, reaching 1.3994 as the Canadian dollar fell to its weakest level since August 7. The bullish structure is intact, but the conviction behind it remains deliberately measured, and that gap matters for how you approach the next few weeks. The bullish case for USDCAD rests on a convergence of three forces, each reinforcing the next. The Fed-BOC rate differential is the foundation: the Fed has just hiked unanimously and telegraphed more, while the BOC is navigating domestic softness without a clear tightening mandate. That divergence means USD short-term funding rates stay elevated relative to CAD, which makes carry trades, strategies that borrow a low-rate currency to fund a position in a higher-rate one, mechanically favorable for USD over time. On top of that, all three major timeframes, daily, weekly, and monthly, are aligned in the same bullish direction, which is the highest-quality technical confirmation available in this framework. Multi-timeframe alignment of this kind reduces the risk of trading against the dominant structural trend. The retail positioning data adds a useful contrarian layer: as of September 17, 70% of retail USDCAD positions tracked by FXSSI are short, with only 30% long. When the crowd is heavily positioned against the trend, the risk of a short squeeze, a sharp upward move forced by stop-loss orders on those short positions, increases. This is context only, not a standalone trigger, and the FXSSI sample covers broker-reported retail flow, not the full institutional market. That caveat matters. What keeps this view at low rather than high conviction is an internal tension in the macro picture. -- Intermarket Edge

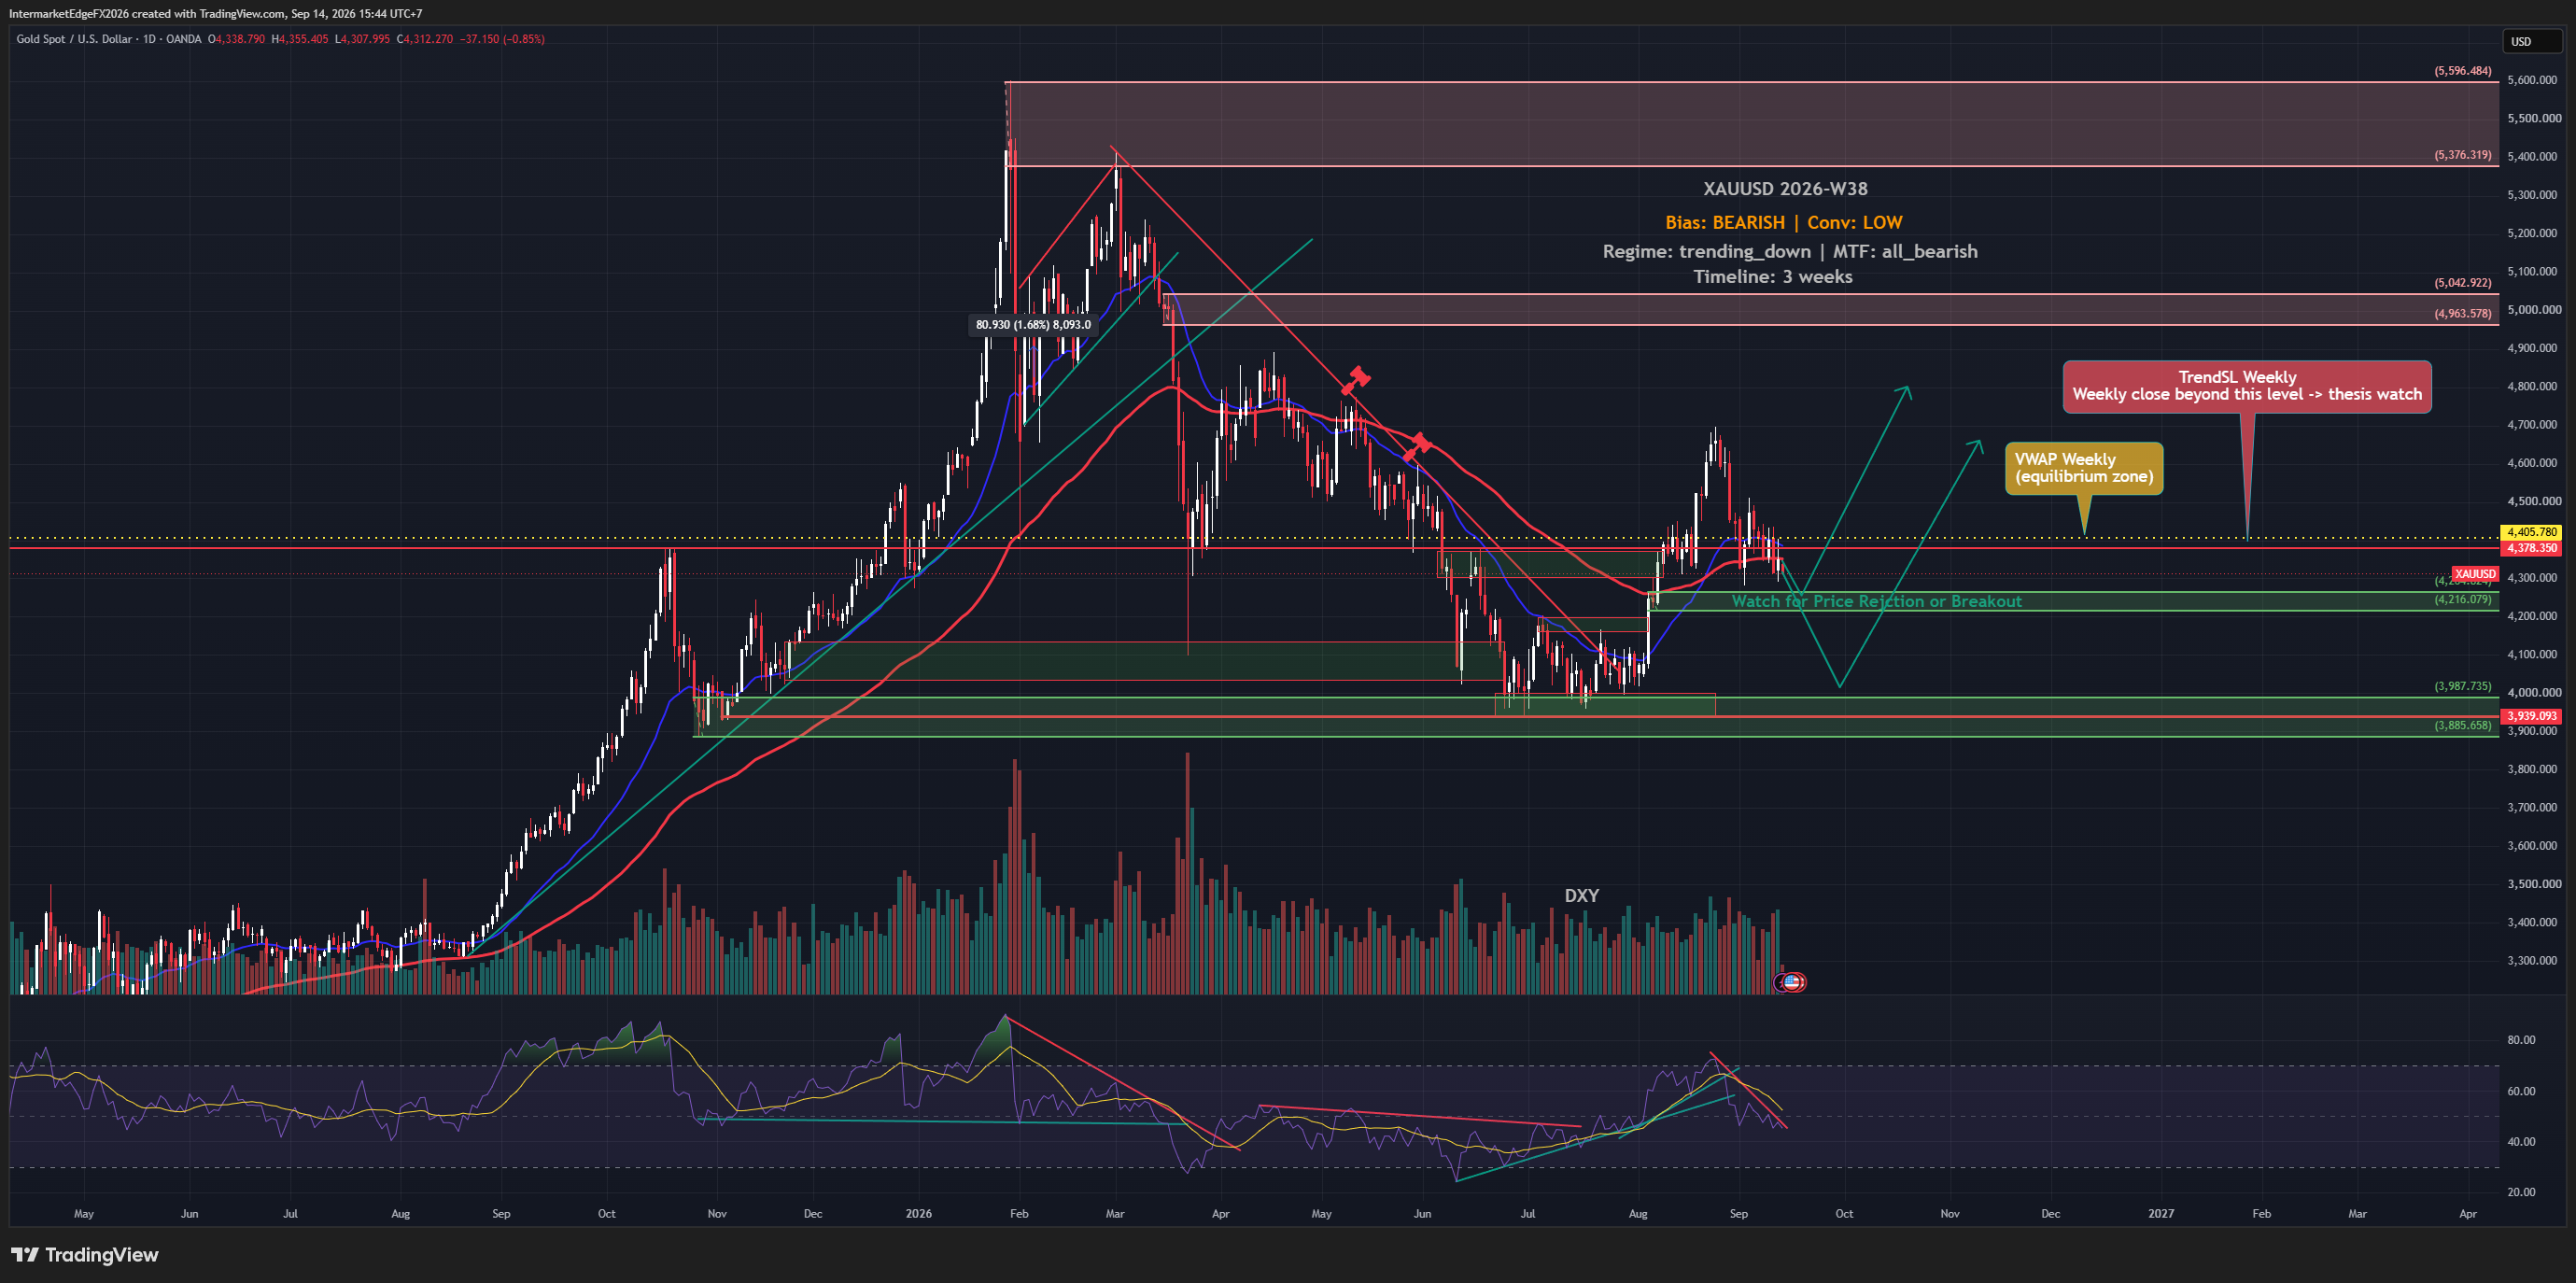
XAUUSD W38: Gold Rebounds, but FOMC Can Reset the Move

XAUUSD W38: Gold Rebounds, but FOMC Can Reset the Move

Gold is trading at 4329.19 as of Monday, 14 September 2026, and the bearish structure across all timeframes remains intact, yet price simply will not fall with conviction. Strong US inflation data and rising oil prices pushed Fed rate-hike expectations higher, which historically pressures gold, but the metal rebounded more than 1% on dip buying even as those hike bets increased. That divergence between macro pressure and price behavior is the central tension this week. The overall framework flags a bearish bias on XAUUSD for W38-2026, with the trend regime pointing consistently lower across every timeframe. However, this is precisely the week where reading the label without reading the evidence underneath it will get a trader into trouble, because the conviction behind that bearish call is low, and the reason matters. The individual signal doing the most work inside the analysis is price action, which is actually scoring bullish. The macro channel, the classic Fed-hawkish-leads-to-gold-bearish transmission, has been explicitly set aside after backtesting showed it produced a correct directional read only about 35.9% of the time on this instrument; the sample size, test period, and exact definition of 'correct' are not specified in the available data, so that figure should be treated as directional context rather than a standalone citable statistic. What that means practically: the most commonly cited reason to be bearish gold this week, rising rate-hike expectations, is the one the analysis has deliberately discounted. The bearish label therefore rests primarily on trend structure and timeframe alignment, not on a reinforcing macro catalyst. Retail positioning adds a contrarian lean: 67% of retail accounts tracked by FXSSI on 14 September are long XAUUSD. -- Intermarket Edge

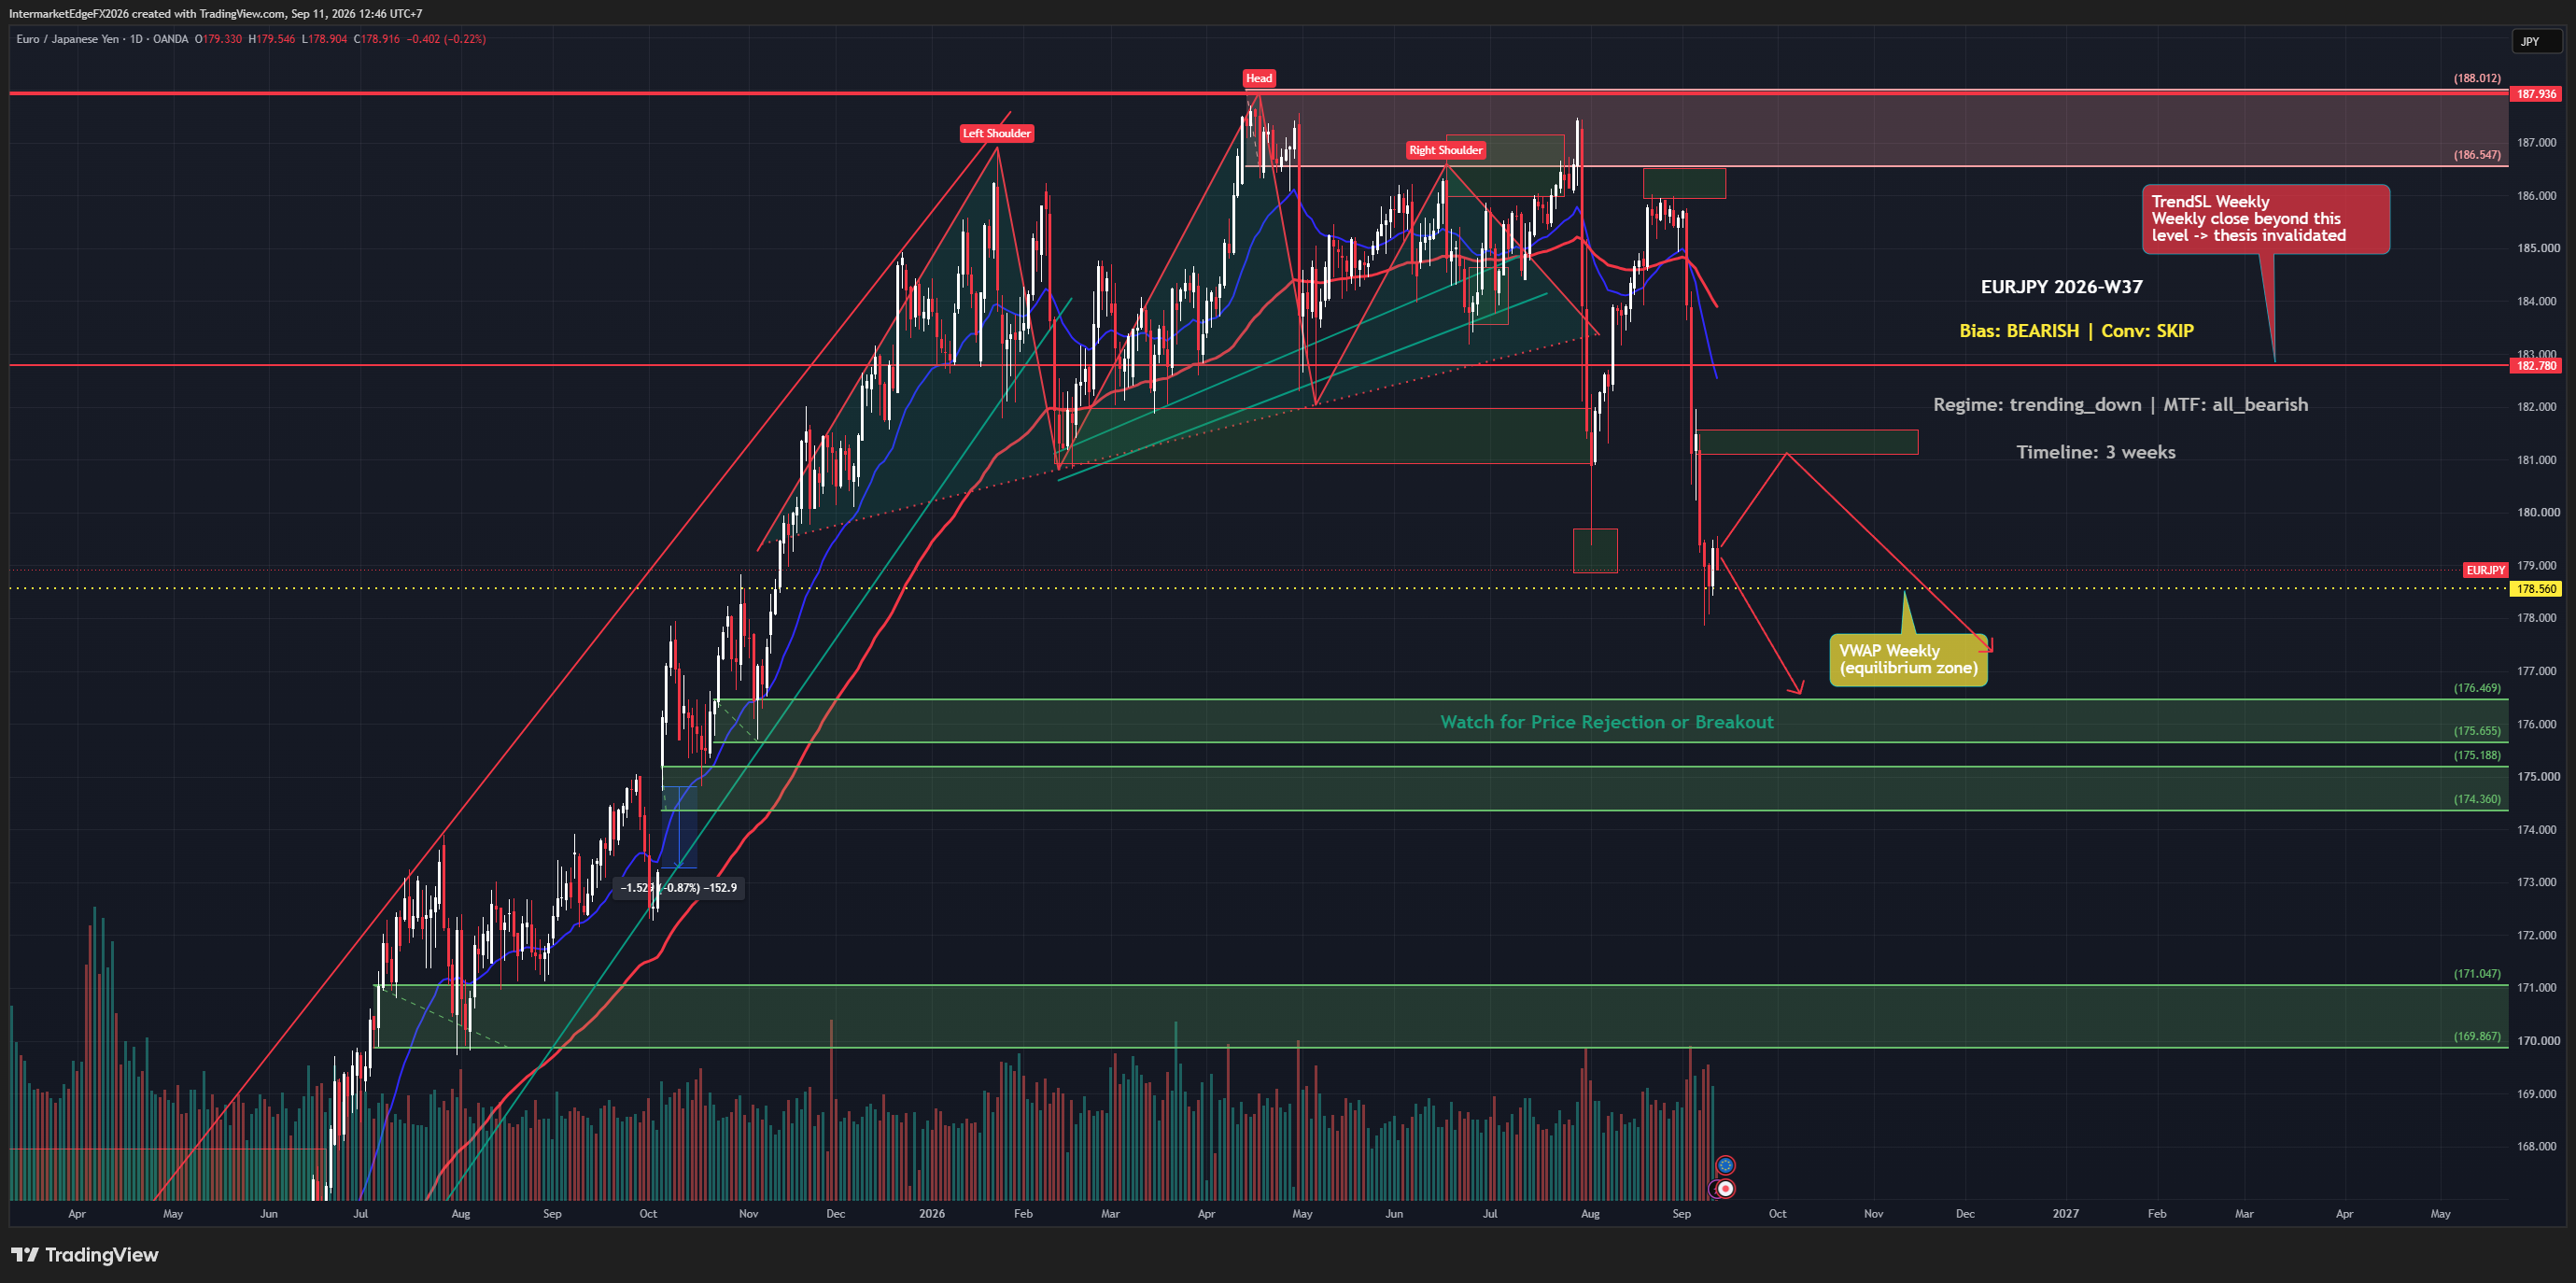
EURJPY W37: ECB Hikes, but the Euro Sells the News

EURJPY W37: ECB Hikes, but the Euro Sells the News

The ECB delivered its expected 25-basis-point rate hike on September 10, lifting the deposit facility to 2.50%, and the euro immediately weakened. That post-decision fade is a warning sign: when a currency falls after a rate hike, it suggests the market had already positioned for that outcome, not that bearish momentum has suddenly taken over. As of Friday, September 11 at 05:28 UTC, EURJPY is trading at 179.29, sitting above its weekly VWAP of 178.56, with the Bank of Japan's next policy meeting just days away. The structural bias on EURJPY this week is bearish, driven by the regime reading of a sustained downtrend across multiple timeframes, all of which are aligned to the downside. But here is where the analysis demands honesty: the evidence supporting that bearish thesis is not yet strong enough to act on with conviction. The framework flags this explicitly as a deliberate decision to stand aside rather than chase a setup that has not confirmed. The core bearish logic runs through the JPY leg. The active causal chain is straightforward: BOJ hawkishness tightens the rate differential, the gap between Japanese and European borrowing costs, and when that differential narrows, the carry trade that has historically supported EURJPY begins to unwind. A carry unwind means investors who borrowed cheap yen to hold higher-yielding euro assets start reversing those positions, selling EURJPY mechanically. Japan's CGPI data keeps that scenario alive: with producer inflation running 7.6% year-over-year, the BOJ has credible inflation data to support further normalization at or after the September 17-18 meeting. That meeting is the single largest near-term risk to any long exposure in this pair. -- Intermarket Edge

USDJPY Week W37-2026: Yen Hits Seven-Month High as Price Slides Below 154.67, But the Bullish Thesis Hasn't Been Abandoned Yet

USDJPY Week W37-2026: Yen Hits Seven-Month High as Price Slides Below 154.67, But the Bullish Thesis Hasn't Been Abandoned Yet

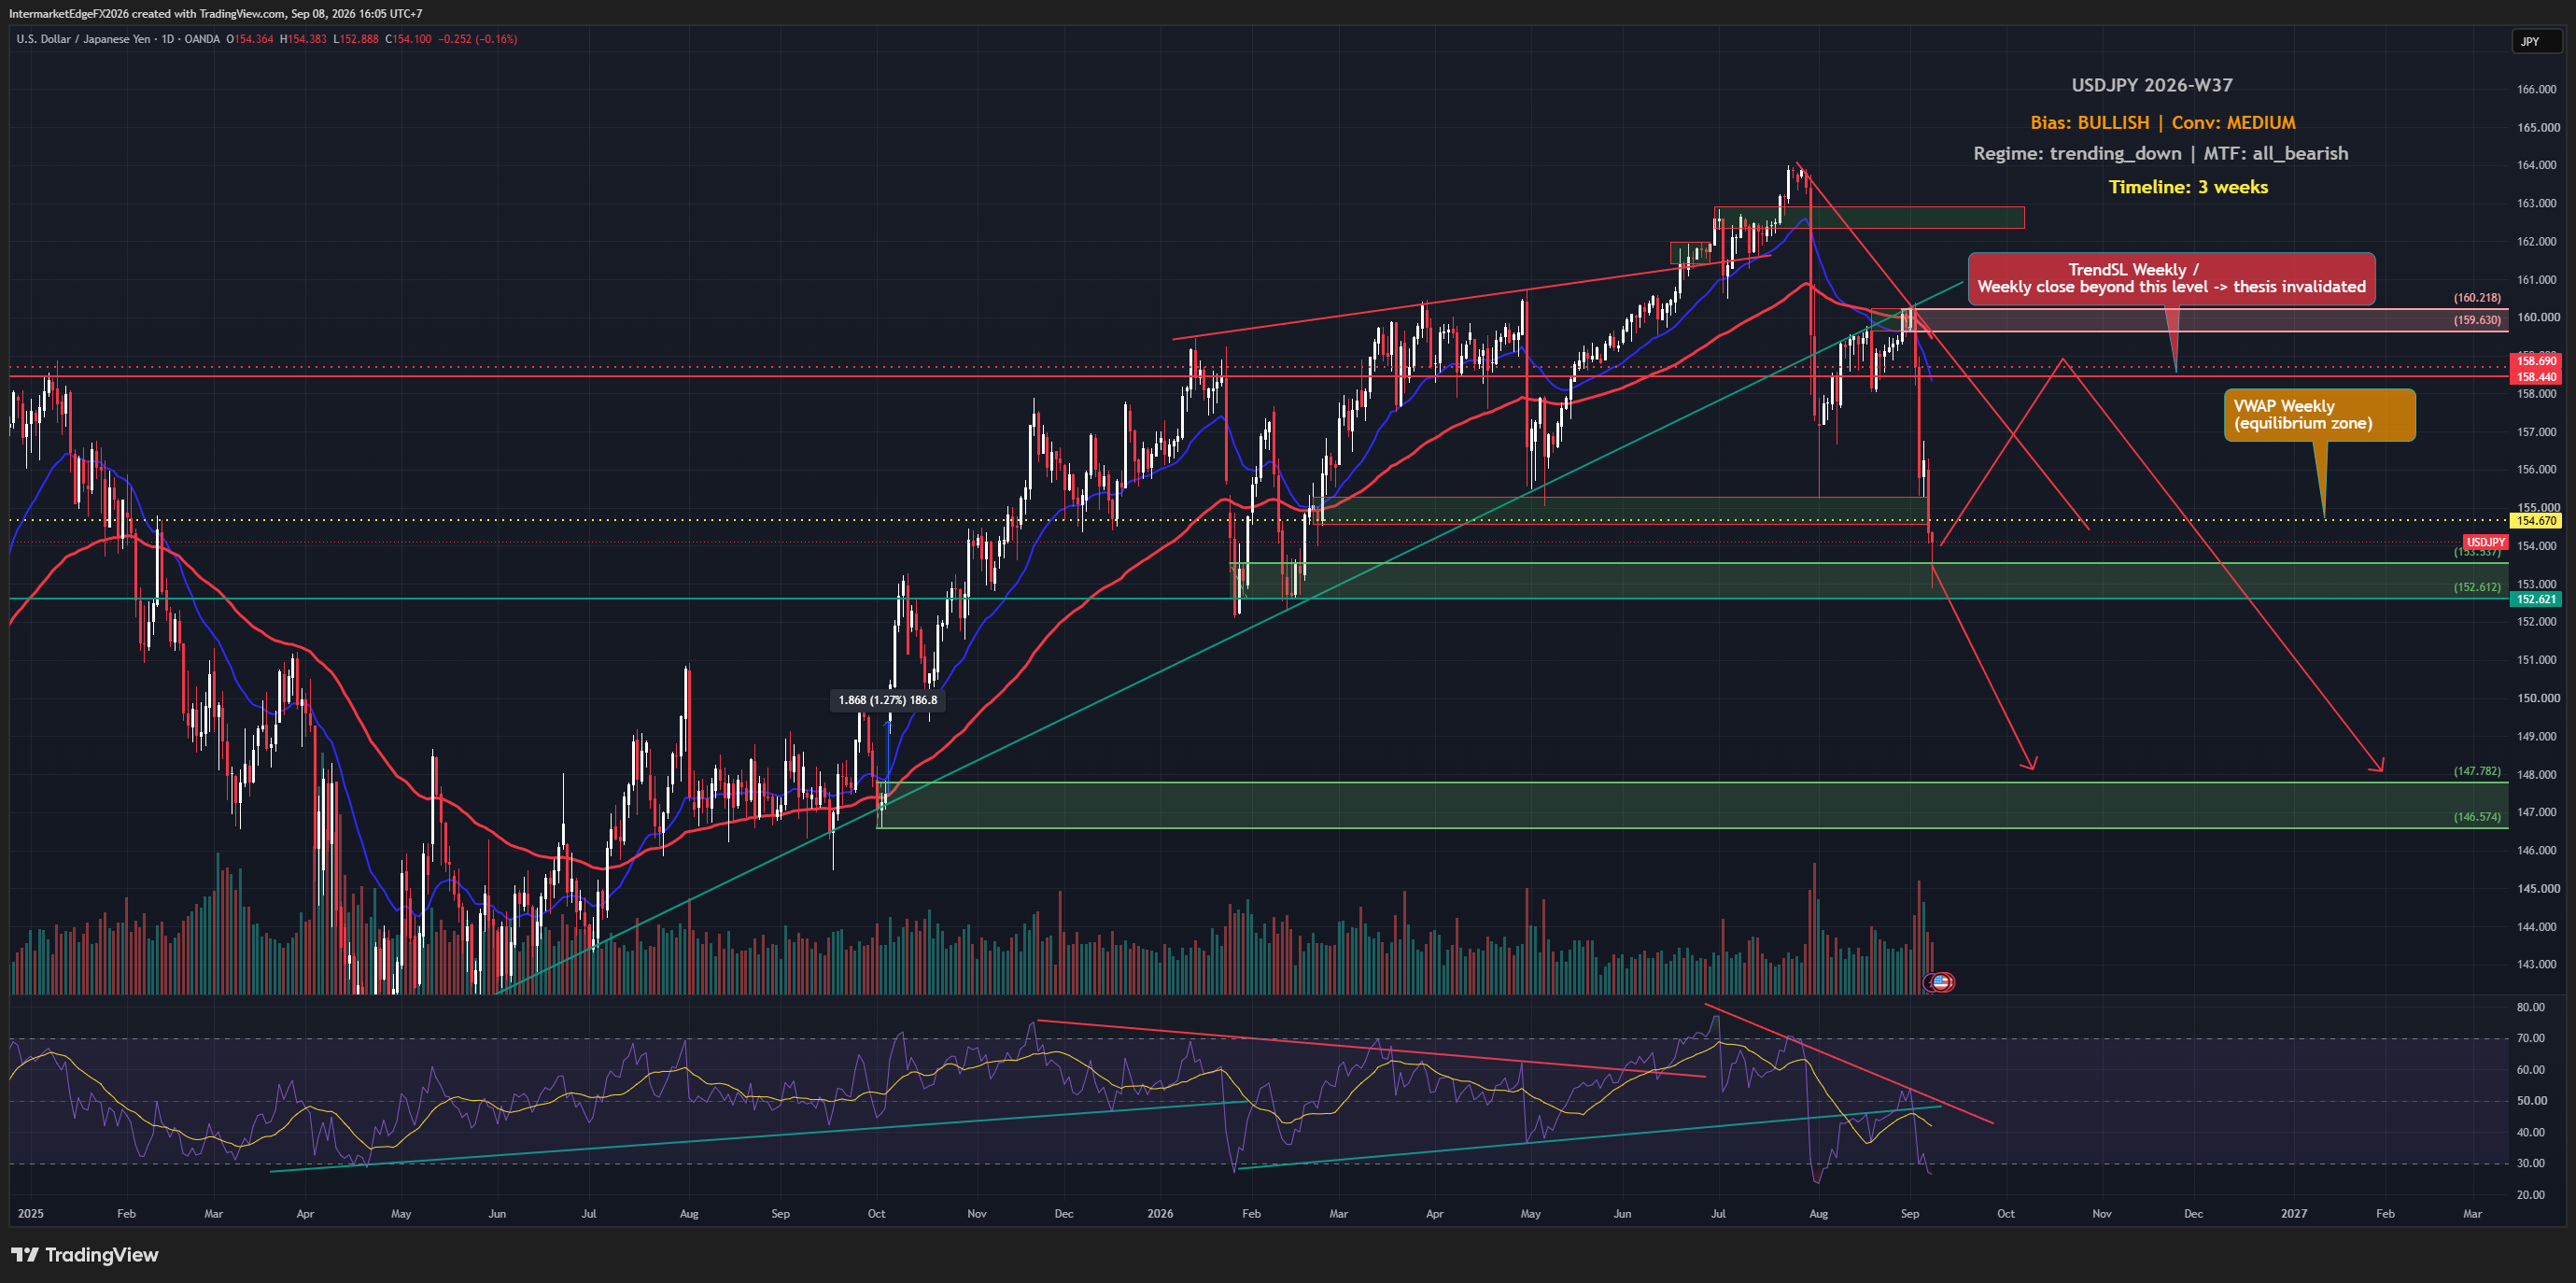
USDJPY is sitting at 153.55 as of Tuesday, 08 September 2026, with the yen at a seven-month high and every timeframe aligned bearish. The bullish thesis rests on the most extreme Fed-vs-BOJ rate differential in the G7, but price is already below the weekly VWAP at 154.67, meaning the pair hasn't even recovered to average territory yet. Before positioning around a macro argument, the technical structure deserves a hard look. The framework carries a bullish bias on USDJPY this week, but the conviction sits at medium, not high, and understanding why that ceiling exists matters more than the label itself. The core argument is straightforward: the Fed-vs-BOJ rate differential is the most divergent in the G7. A rate differential measures the gap between what investors earn holding one currency versus another; when it is wide and widening, it creates a structural incentive to hold the higher-yielding currency, in this case the dollar. Real yields reinforce this, a 2.42% US 10-year real yield means dollar holders are being compensated above inflation, which is a durable form of carry, not just a nominal illusion. Price action, COT positioning, and macro fundamentals all point the same direction. However, the COT data introduces a specific caution: speculative positioning is already extremely short yen, meaning most of the bearish-yen trade is already on. Crowding risk, the danger that a crowded trade reverses sharply when participants exit simultaneously, actively reduces conviction here. The exact net-position figures and report date for the COT data are not specified in this brief, so the reading should be treated as directional evidence rather than a precisely dated data point. -- Intermarket Edge

Stay in the loop

Get notified about new research, macro insights, and market analysis.

InterMarketEdge

© 2026 InterMarketEdge. Financial intelligence for inter-market traders.