Macro Regime — InterMarketEdge

Macro Regime

Regime-level analysis — stagflation, Fed policy shifts, and structural macro drivers moving markets

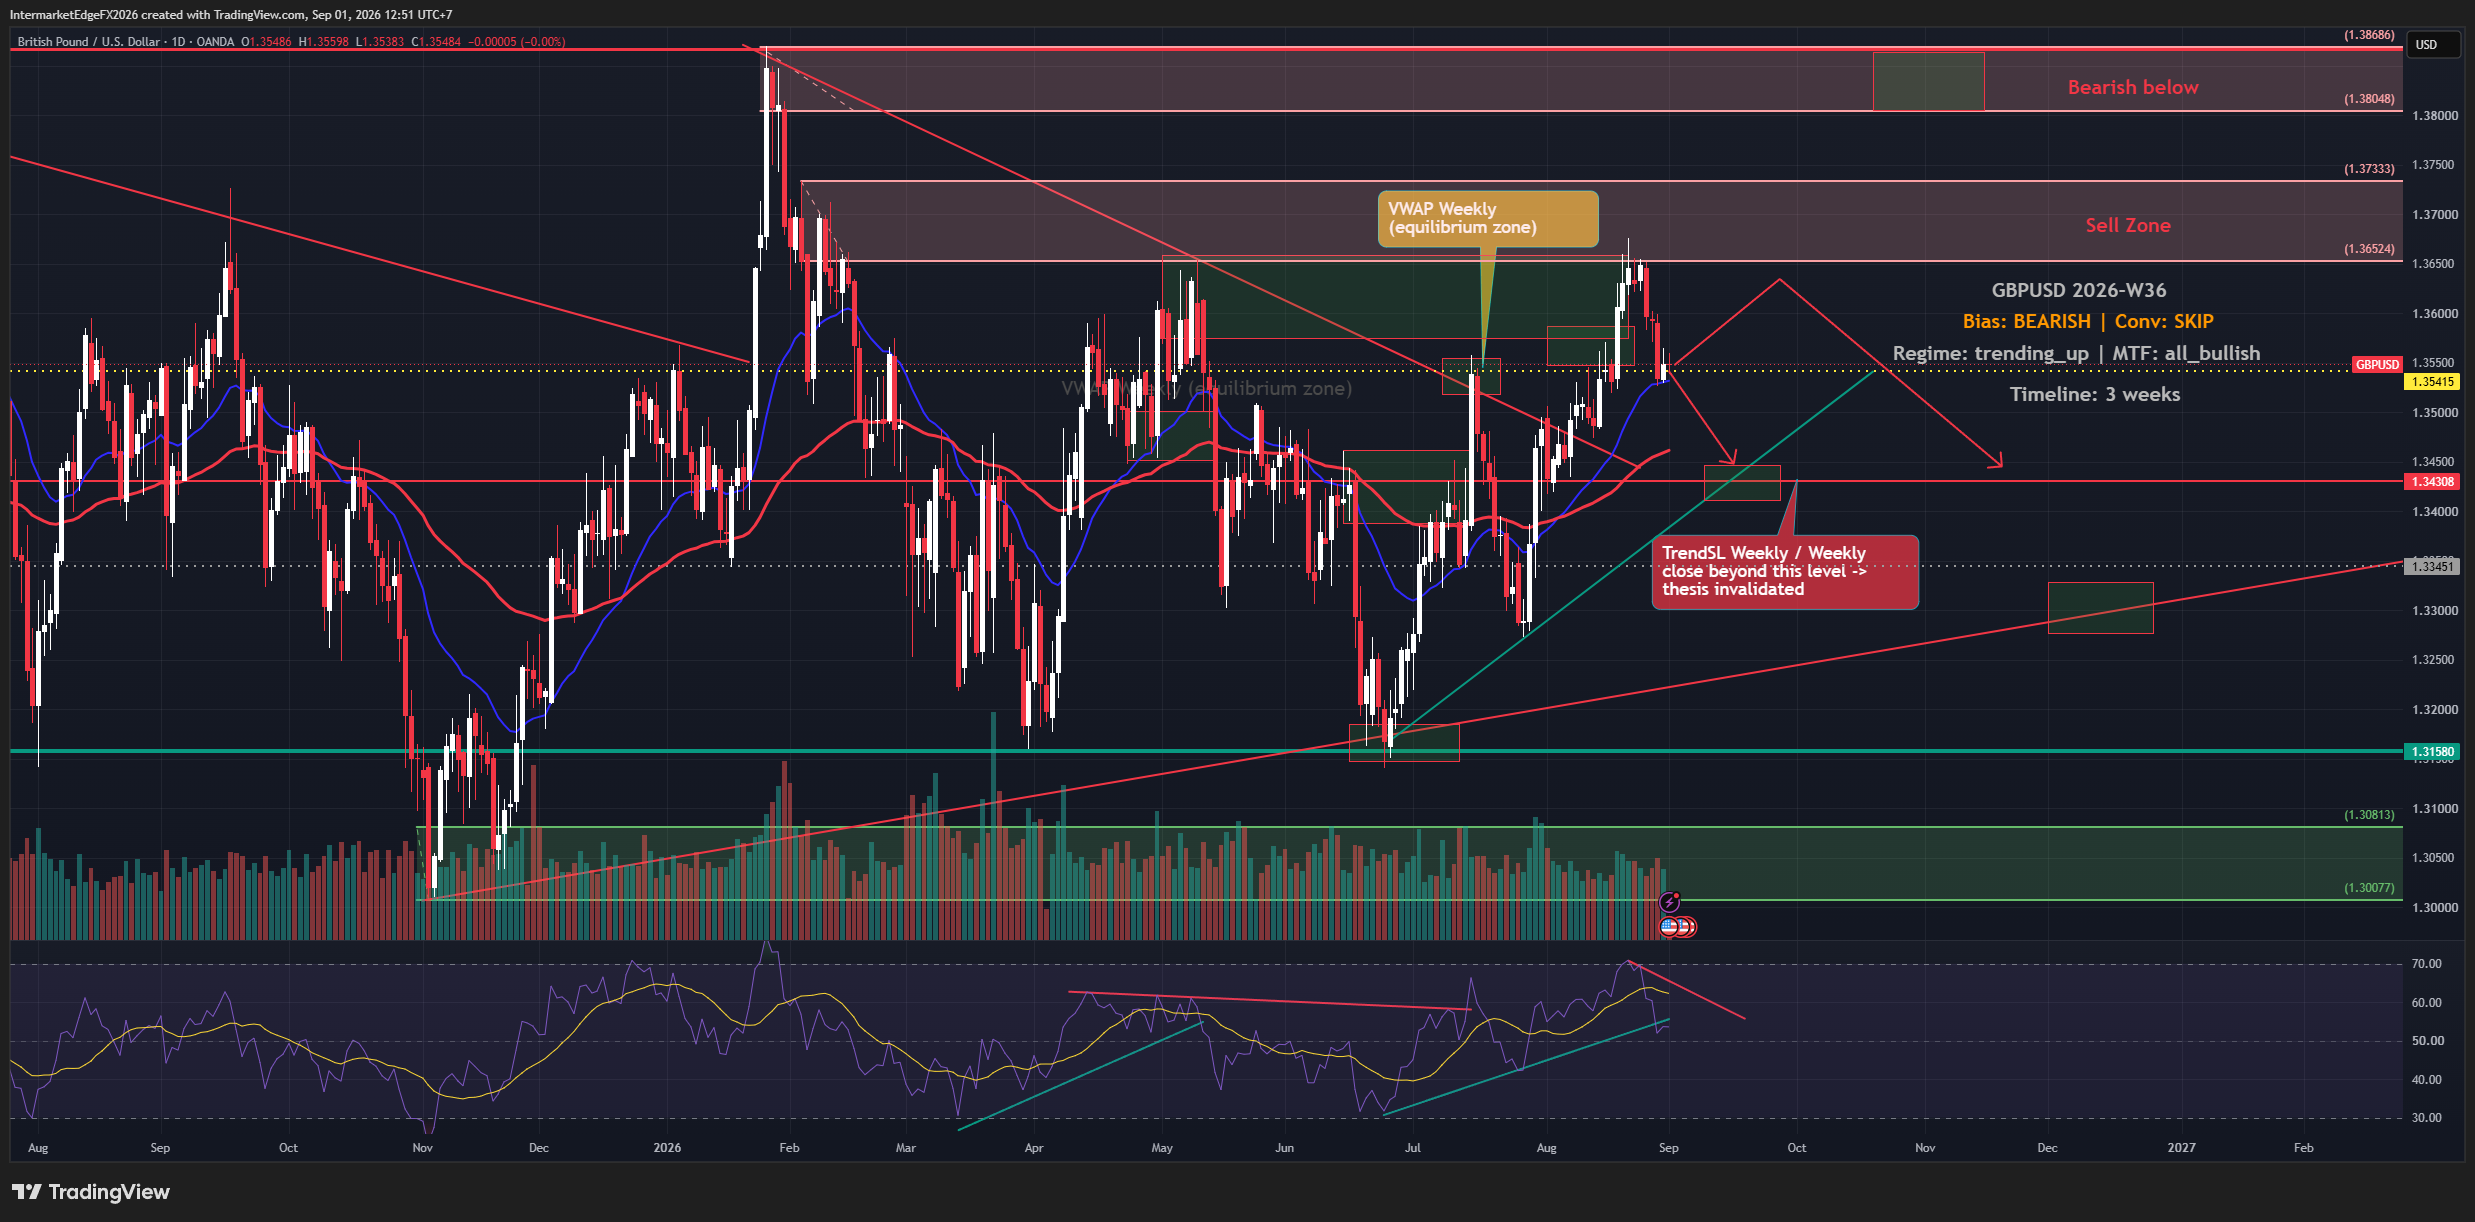
GBPUSD Weekly Outlook W36: Bullish Structure, Bearish Macro Pressure

GBPUSD Weekly Outlook W36: Bullish Structure, Bearish Macro Pressure

GBPUSD is printing a weekly loss as markets reassess the BoE-Fed policy divergence, but the technical structure refuses to cooperate with the bearish story. As of Tuesday, 01 September 2026, price sits at 1.35433, holding above the weekly VWAP at 1.35415 and well above the weekly trend support at 1.34308. The macro case for sterling weakness is building, yet the chart is not confirming it. That disconnect is the entire trade problem this week. The framework lands on a bearish bias for GBPUSD over a three-week horizon, but that label carries a deliberate caveat: this is a case where the evidence is not yet convincing enough to size a position, and staying out is itself a reasoned decision rather than the absence of a view. The bearish case rests on two causal chains that are both active right now. First, Fed hawkishness combined with rising real yields creates a structural USD bid, when real yields rise, the opportunity cost of holding non-dollar assets increases, pulling capital toward the dollar and mechanically weighing on GBPUSD. Second, DXY strength, itself driven by the same real yield dynamic, amplifies that pressure through a separate channel, since broad dollar appreciation tends to compress GBPUSD regardless of sterling-specific factors. COT data adds a warning layer: speculative positioning in GBP is already tilted heavily long, which matters because crowding risk, the danger that most participants who want to be long are already long, leaving fewer buyers to sustain the move, raises the probability of a disorderly unwind if sentiment shifts. The positioning evidence here should be read as directional in character, not as a citable statistic, since the specific report date, net position figure, and sample context are not available in this brief. -- Intermarket Edge

USOIL Week W35-2026: Three Straight Sessions of Losses as Hormuz Reopening Hopes Pull the Rug on Supply-Risk Bulls

USOIL Week W35-2026: Three Straight Sessions of Losses as Hormuz Reopening Hopes Pull the Rug on Supply-Risk Bulls

Crude oil has extended losses into a third consecutive session, with price trading at 82.49 as of Thursday 27 August, sitting below the weekly VWAP of 83.24. The headline driver this week is improved odds of the Strait of Hormuz reopening, a geopolitical shift that removes a key supply-risk premium that had been quietly supporting prices. When a fear-driven premium exits, the underlying supply picture takes over, and right now that picture shows four straight weeks of inventory builds averaging above 1.5 million barrels. The directional lean this week is bearish, though with low conviction, and that qualification matters more than the direction itself. What makes this setup structurally unusual is that the individual signals are not aligned behind the bearish view. Price action shows a technical reading that leans bullish, and COT positioning, the commitments of traders report, which tracks the aggregate stance of large speculators and commercial hedgers, also sits on the bullish side (note: the brief does not specify the exact report week, release date, or net-position figures, so this should be read as directional evidence rather than a precise citable statistic). Yet despite both of those inputs pointing higher, the macro causal chain overrides them in the aggregated framework. Fed hawkishness is driving real yields upward, which supports the dollar and creates quote-side pressure on oil. Four consecutive inventory builds confirm that physical supply is not tightening. The TGA refill adds a liquidity-drain headwind that touches all risk assets. The Hormuz reopening story is the newest entrant: improved odds of the strait remaining open mean the geopolitical risk premium, the extra dollars priced in because of potential supply disruption, is being unwound. That unwind is not a collapse, but it removes a support that was never about fundamentals to begin with. -- Intermarket Edge

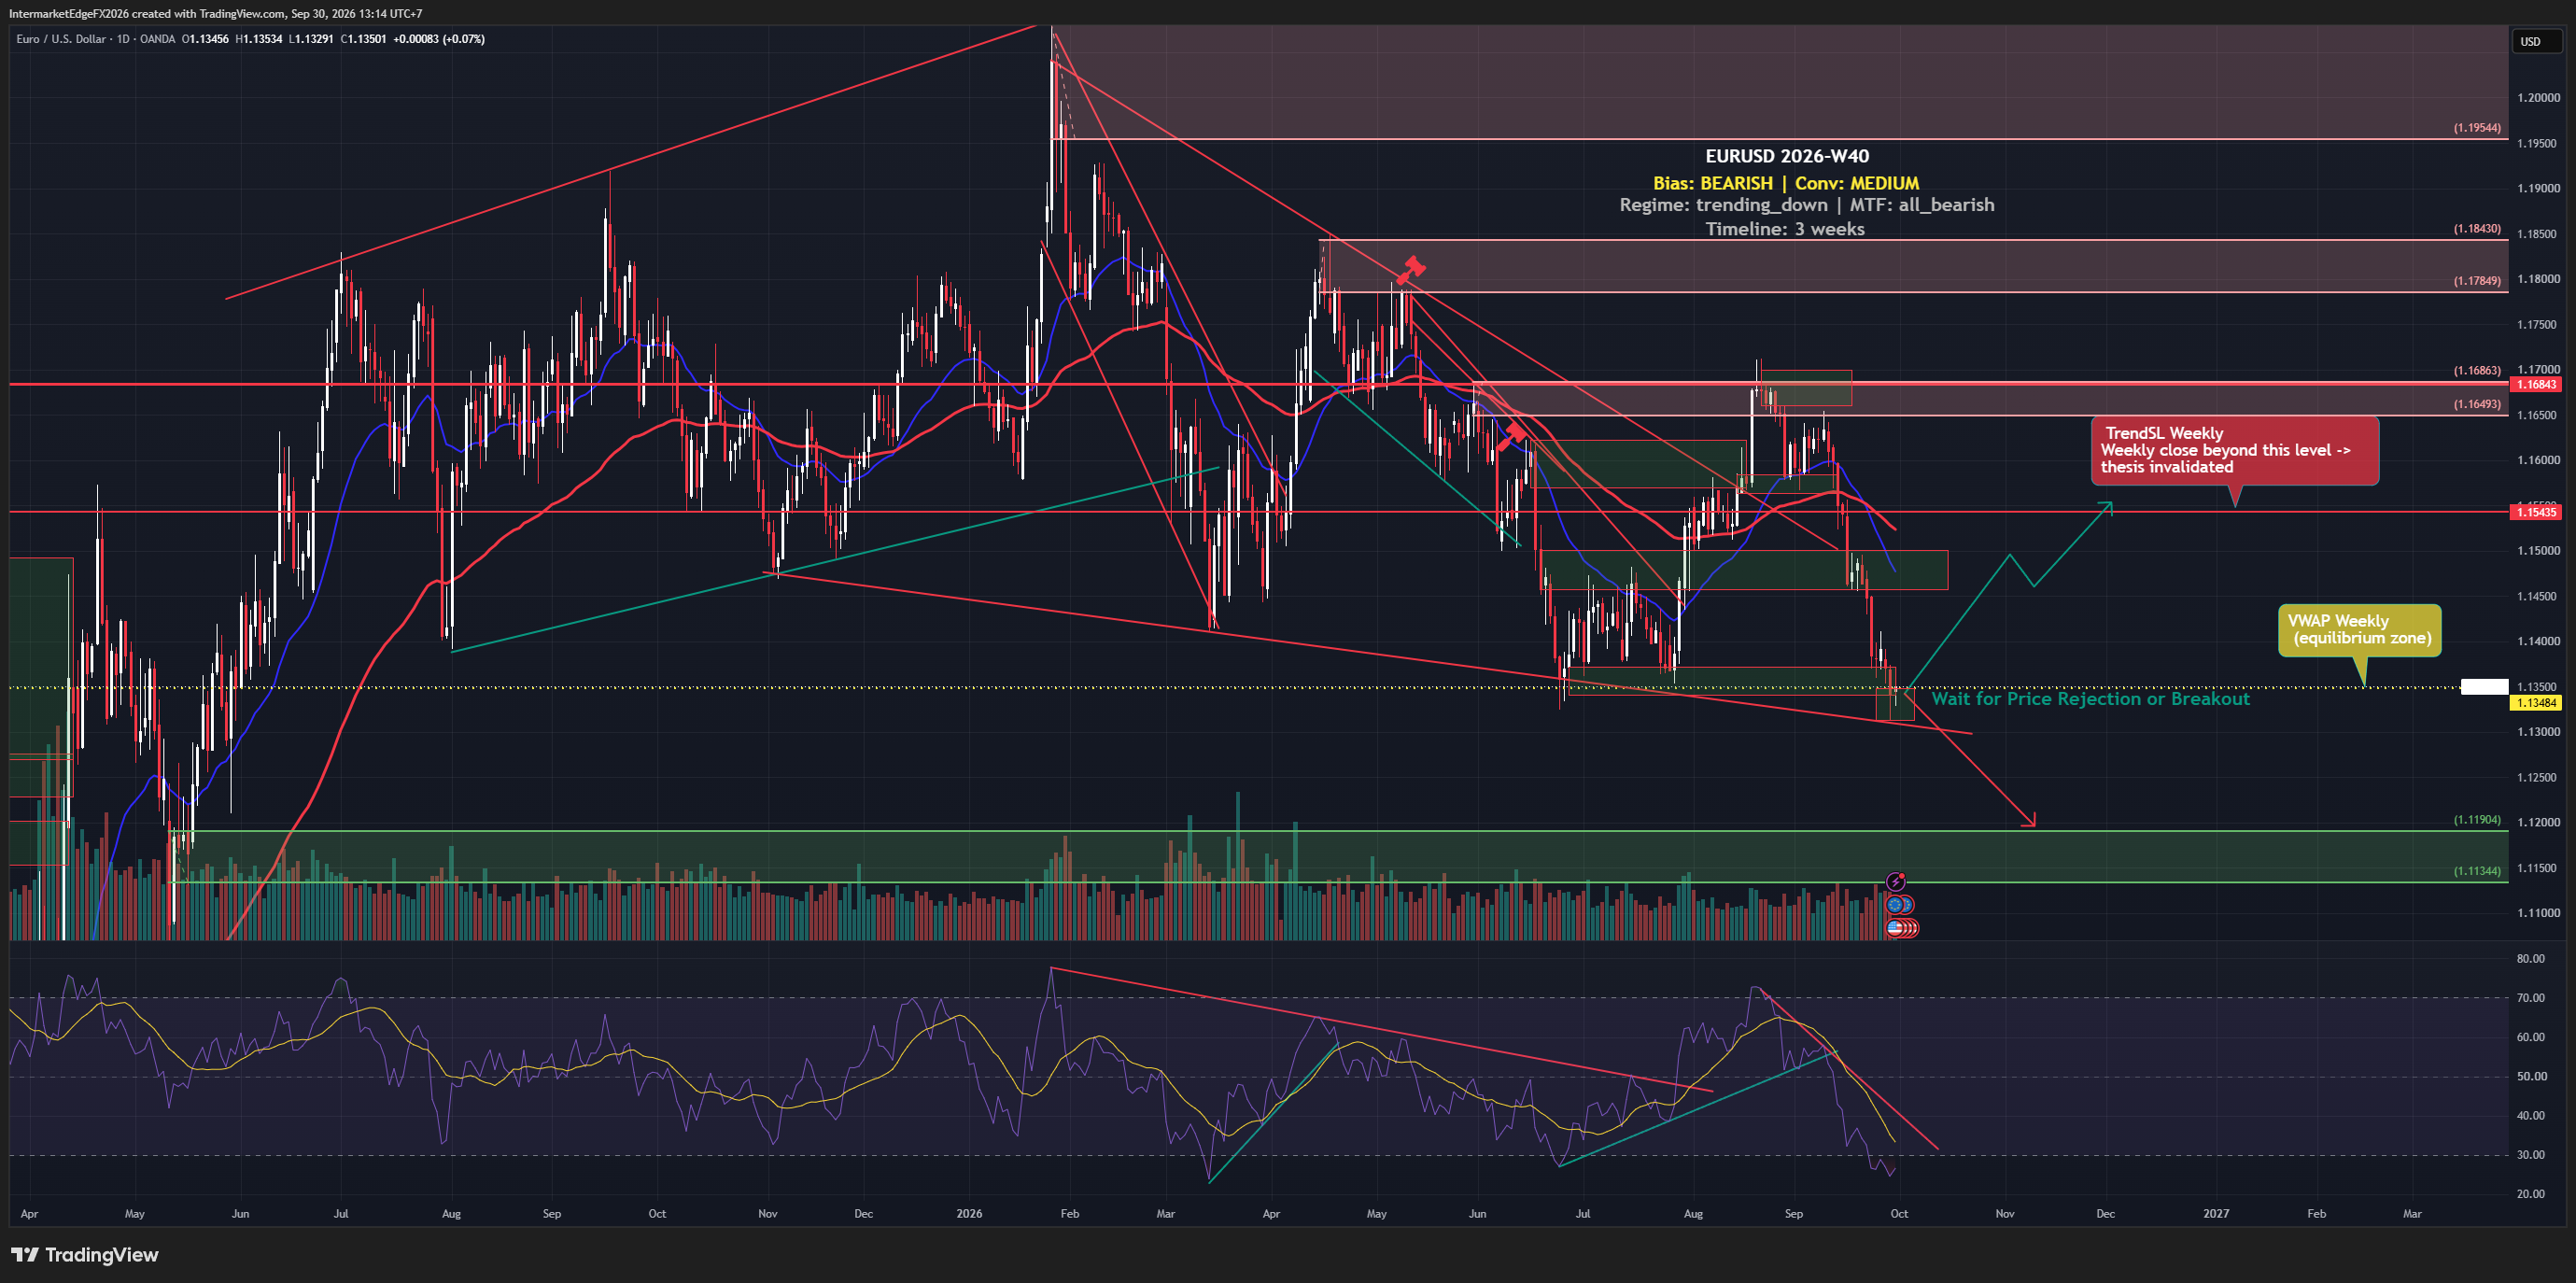
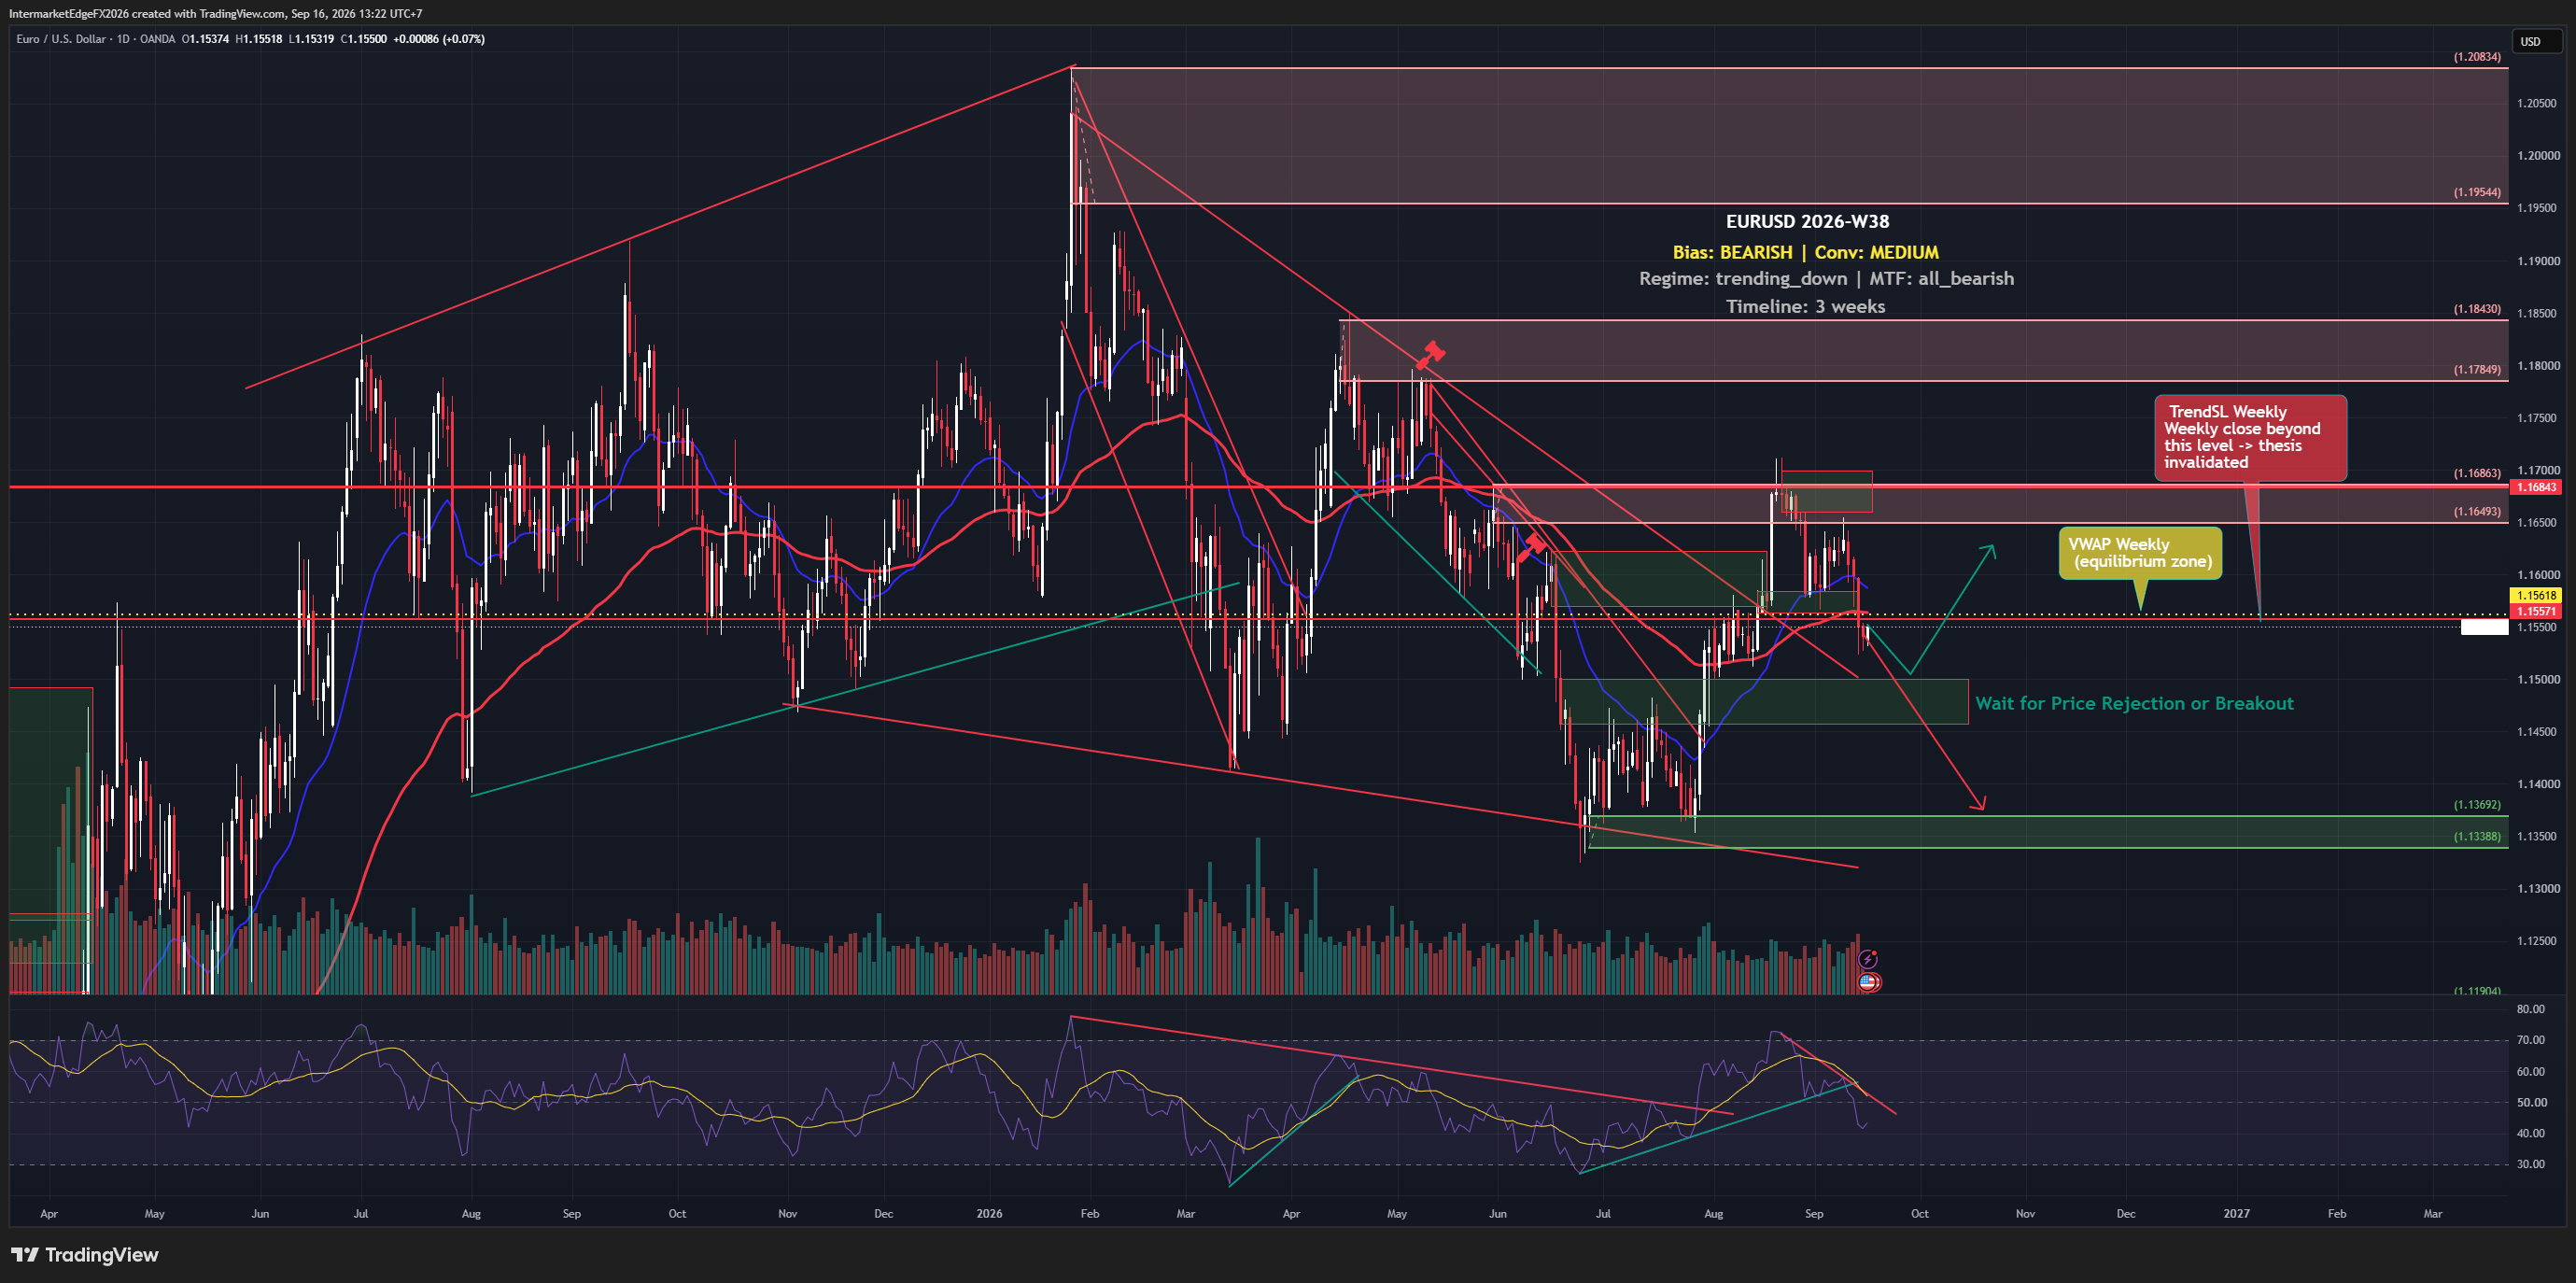
EURUSD Week W35-2026: Inflation Expectations Hit 5.8% While Price Tests VWAP From Underneath, Macro and Charts Tell Opposite Stories

EURUSD Week W35-2026: Inflation Expectations Hit 5.8% While Price Tests VWAP From Underneath, Macro and Charts Tell Opposite Stories

EURUSD is trading at 1.16676 as of Wednesday, 26 August 2026, pressing from underneath the weekly VWAP at 1.16682, a gap so thin it is nearly invisible on a chart, yet technically meaningful. US consumer inflation expectations jumped to 5.8% in August, and Fed's Collins has signaled tightening may be appropriate soon. The macro case for USD strength is building. The problem: every technical timeframe from daily to monthly is still pointed higher on the euro, putting macro and price structure in direct conflict. The framework carries a bearish bias on EURUSD over a roughly three-week horizon, driven primarily by the ECB-versus-Fed rate differential and the structural direction of the US dollar. Rate differential, the gap between what you earn holding dollars versus euros, is the single heaviest causal weight here, and with real yields in the US sitting at 2.38% while the Fed signals further tightening, that differential is pointed in the dollar's favor. The DXY, which measures the dollar against a basket of major currencies including a heavy euro weighting, carries its own bearish bias this week but without a conviction strong enough to act on, that internal tension between a macro-bullish dollar thesis and a DXY that has not yet confirmed it is one reason the overall conviction on this EURUSD view remains at medium rather than high. What keeps this from being a straightforward bearish call is the scale of the signal conflict. -- Intermarket Edge

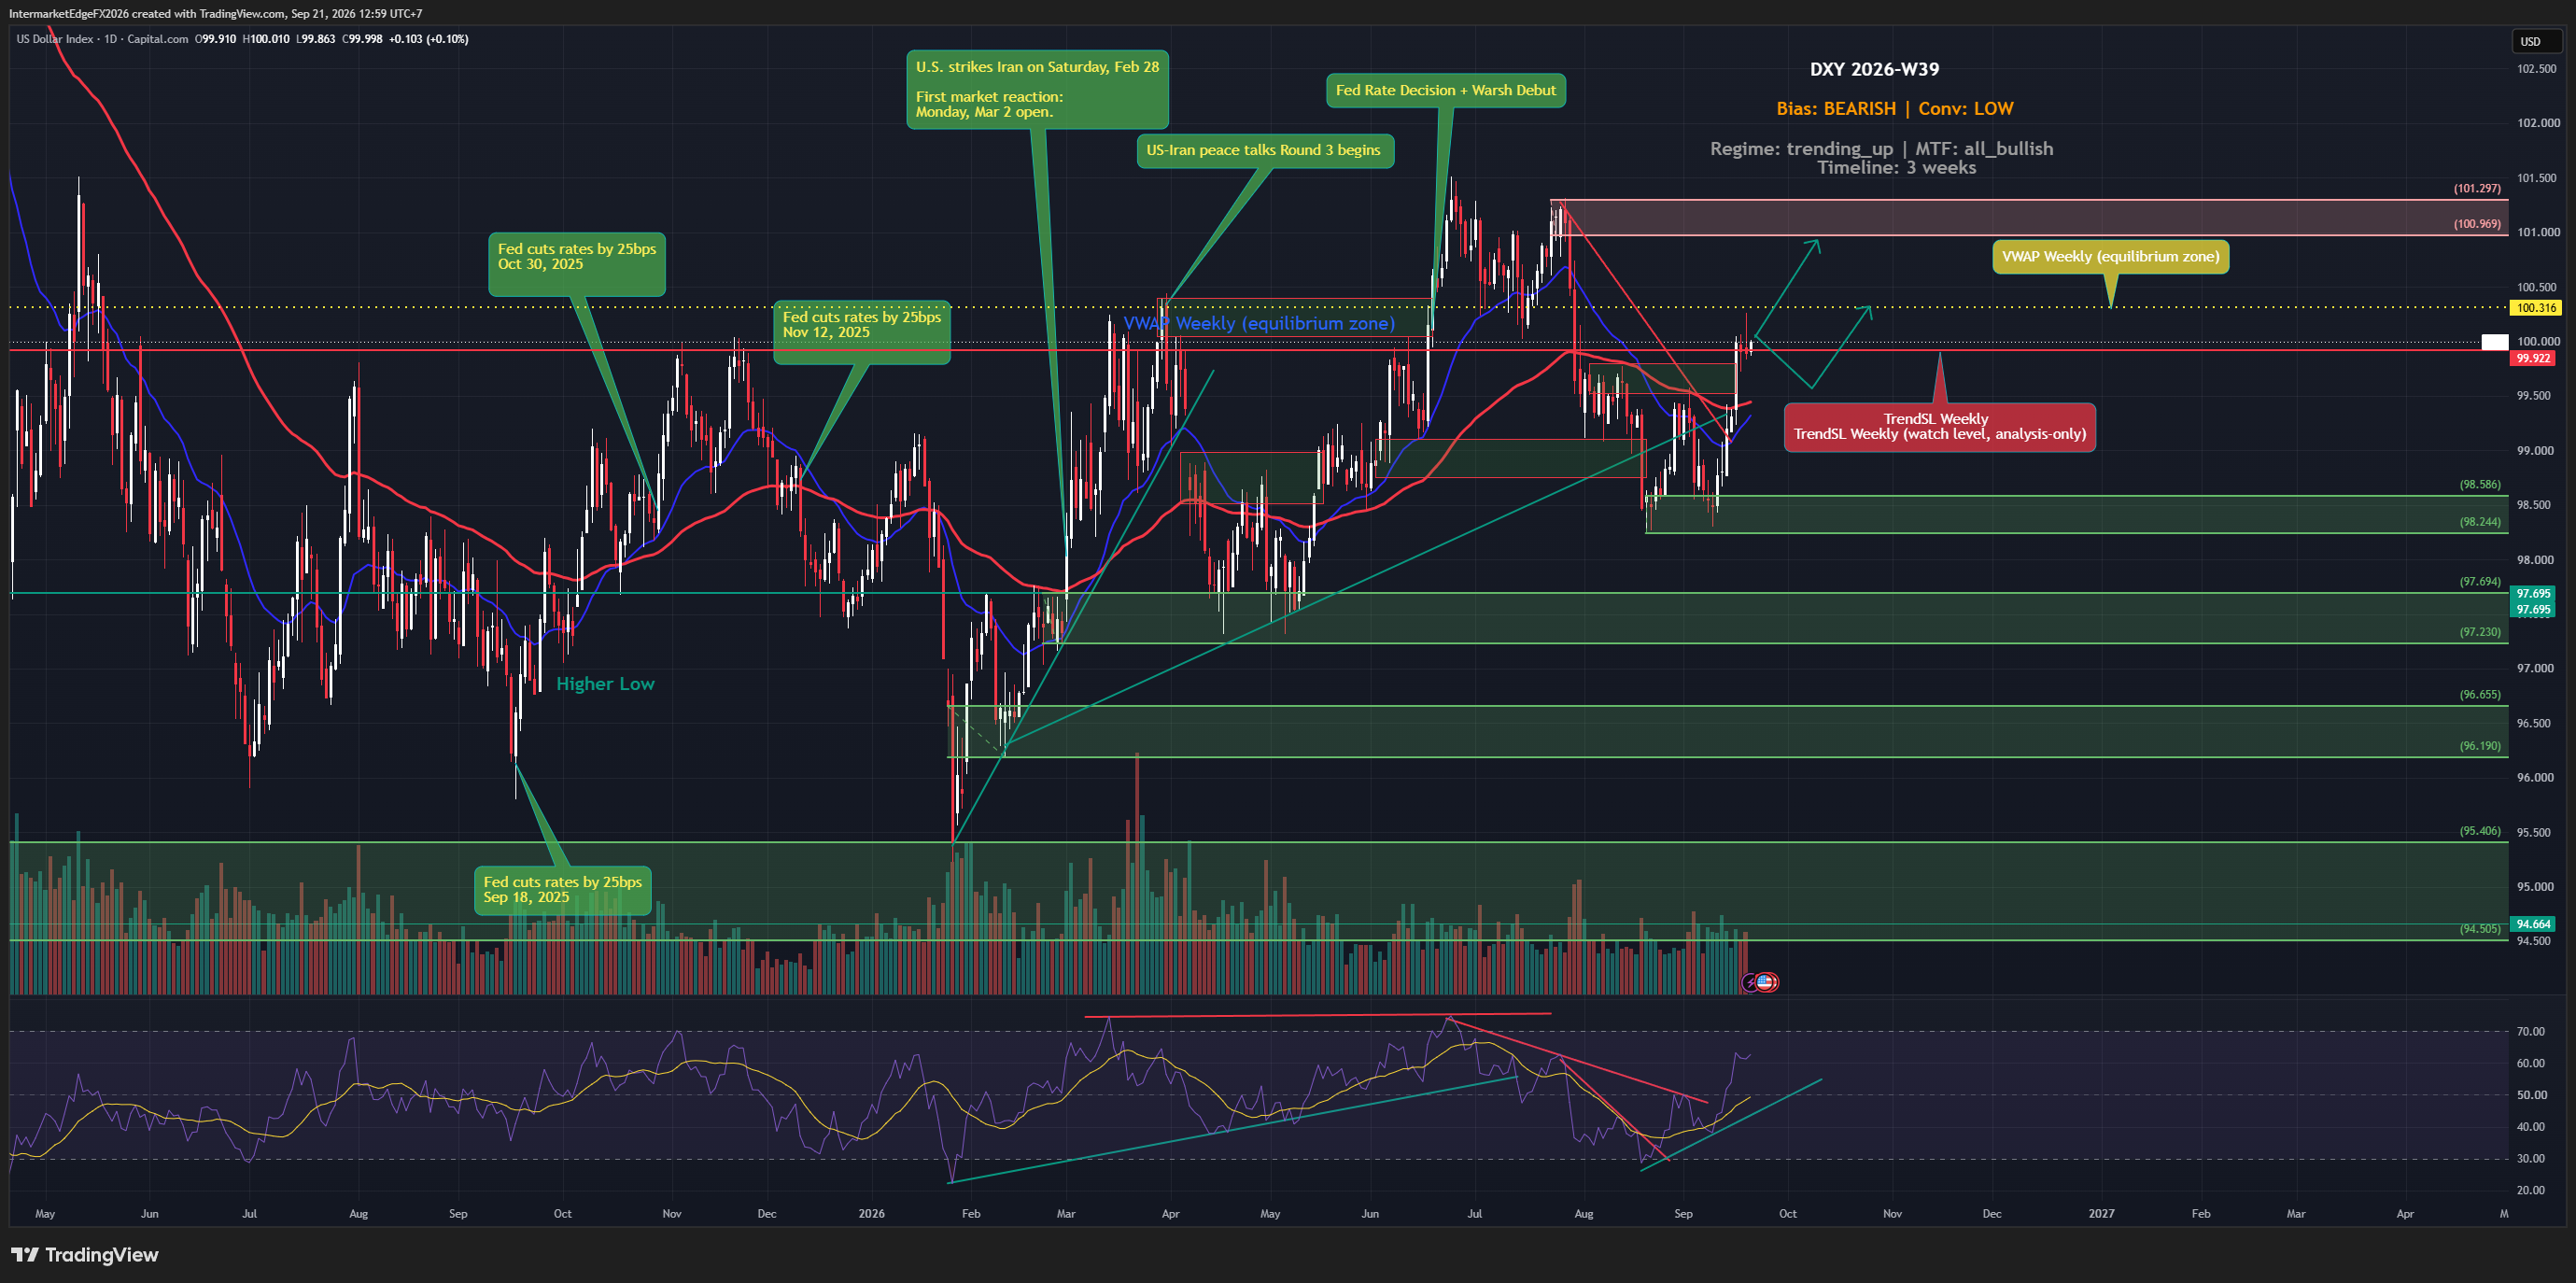
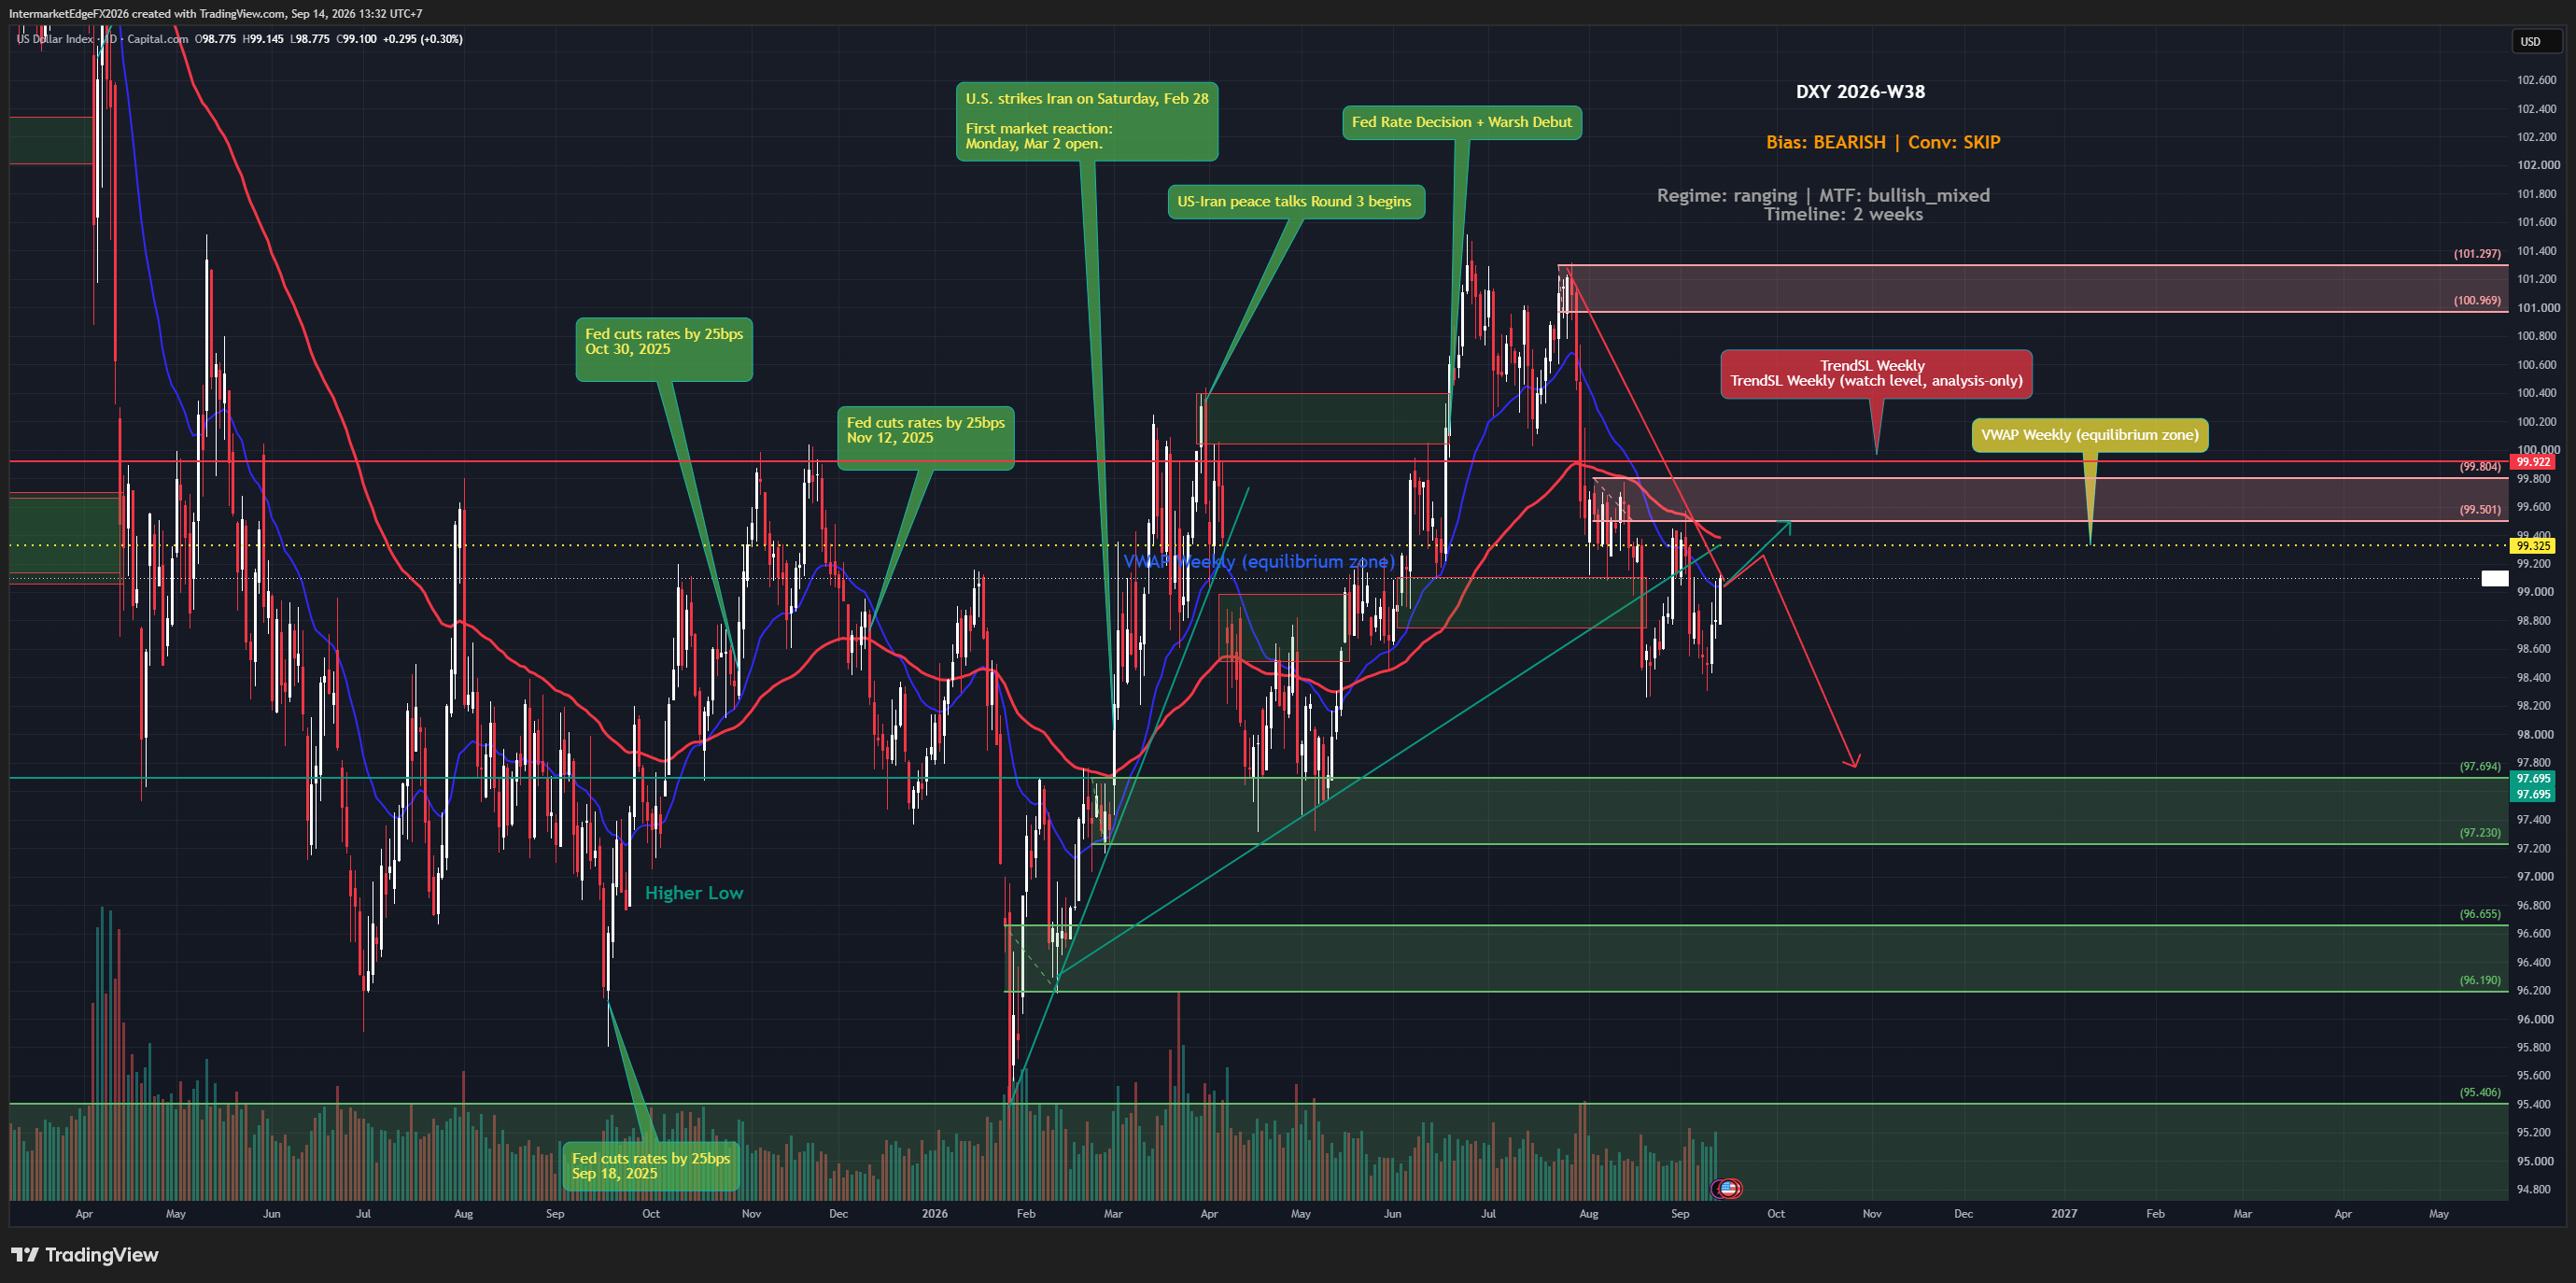
DXY Weekly Outlook: A Bearish Trend Meets a Crowded Short

DXY Weekly Outlook: A Bearish Trend Meets a Crowded Short

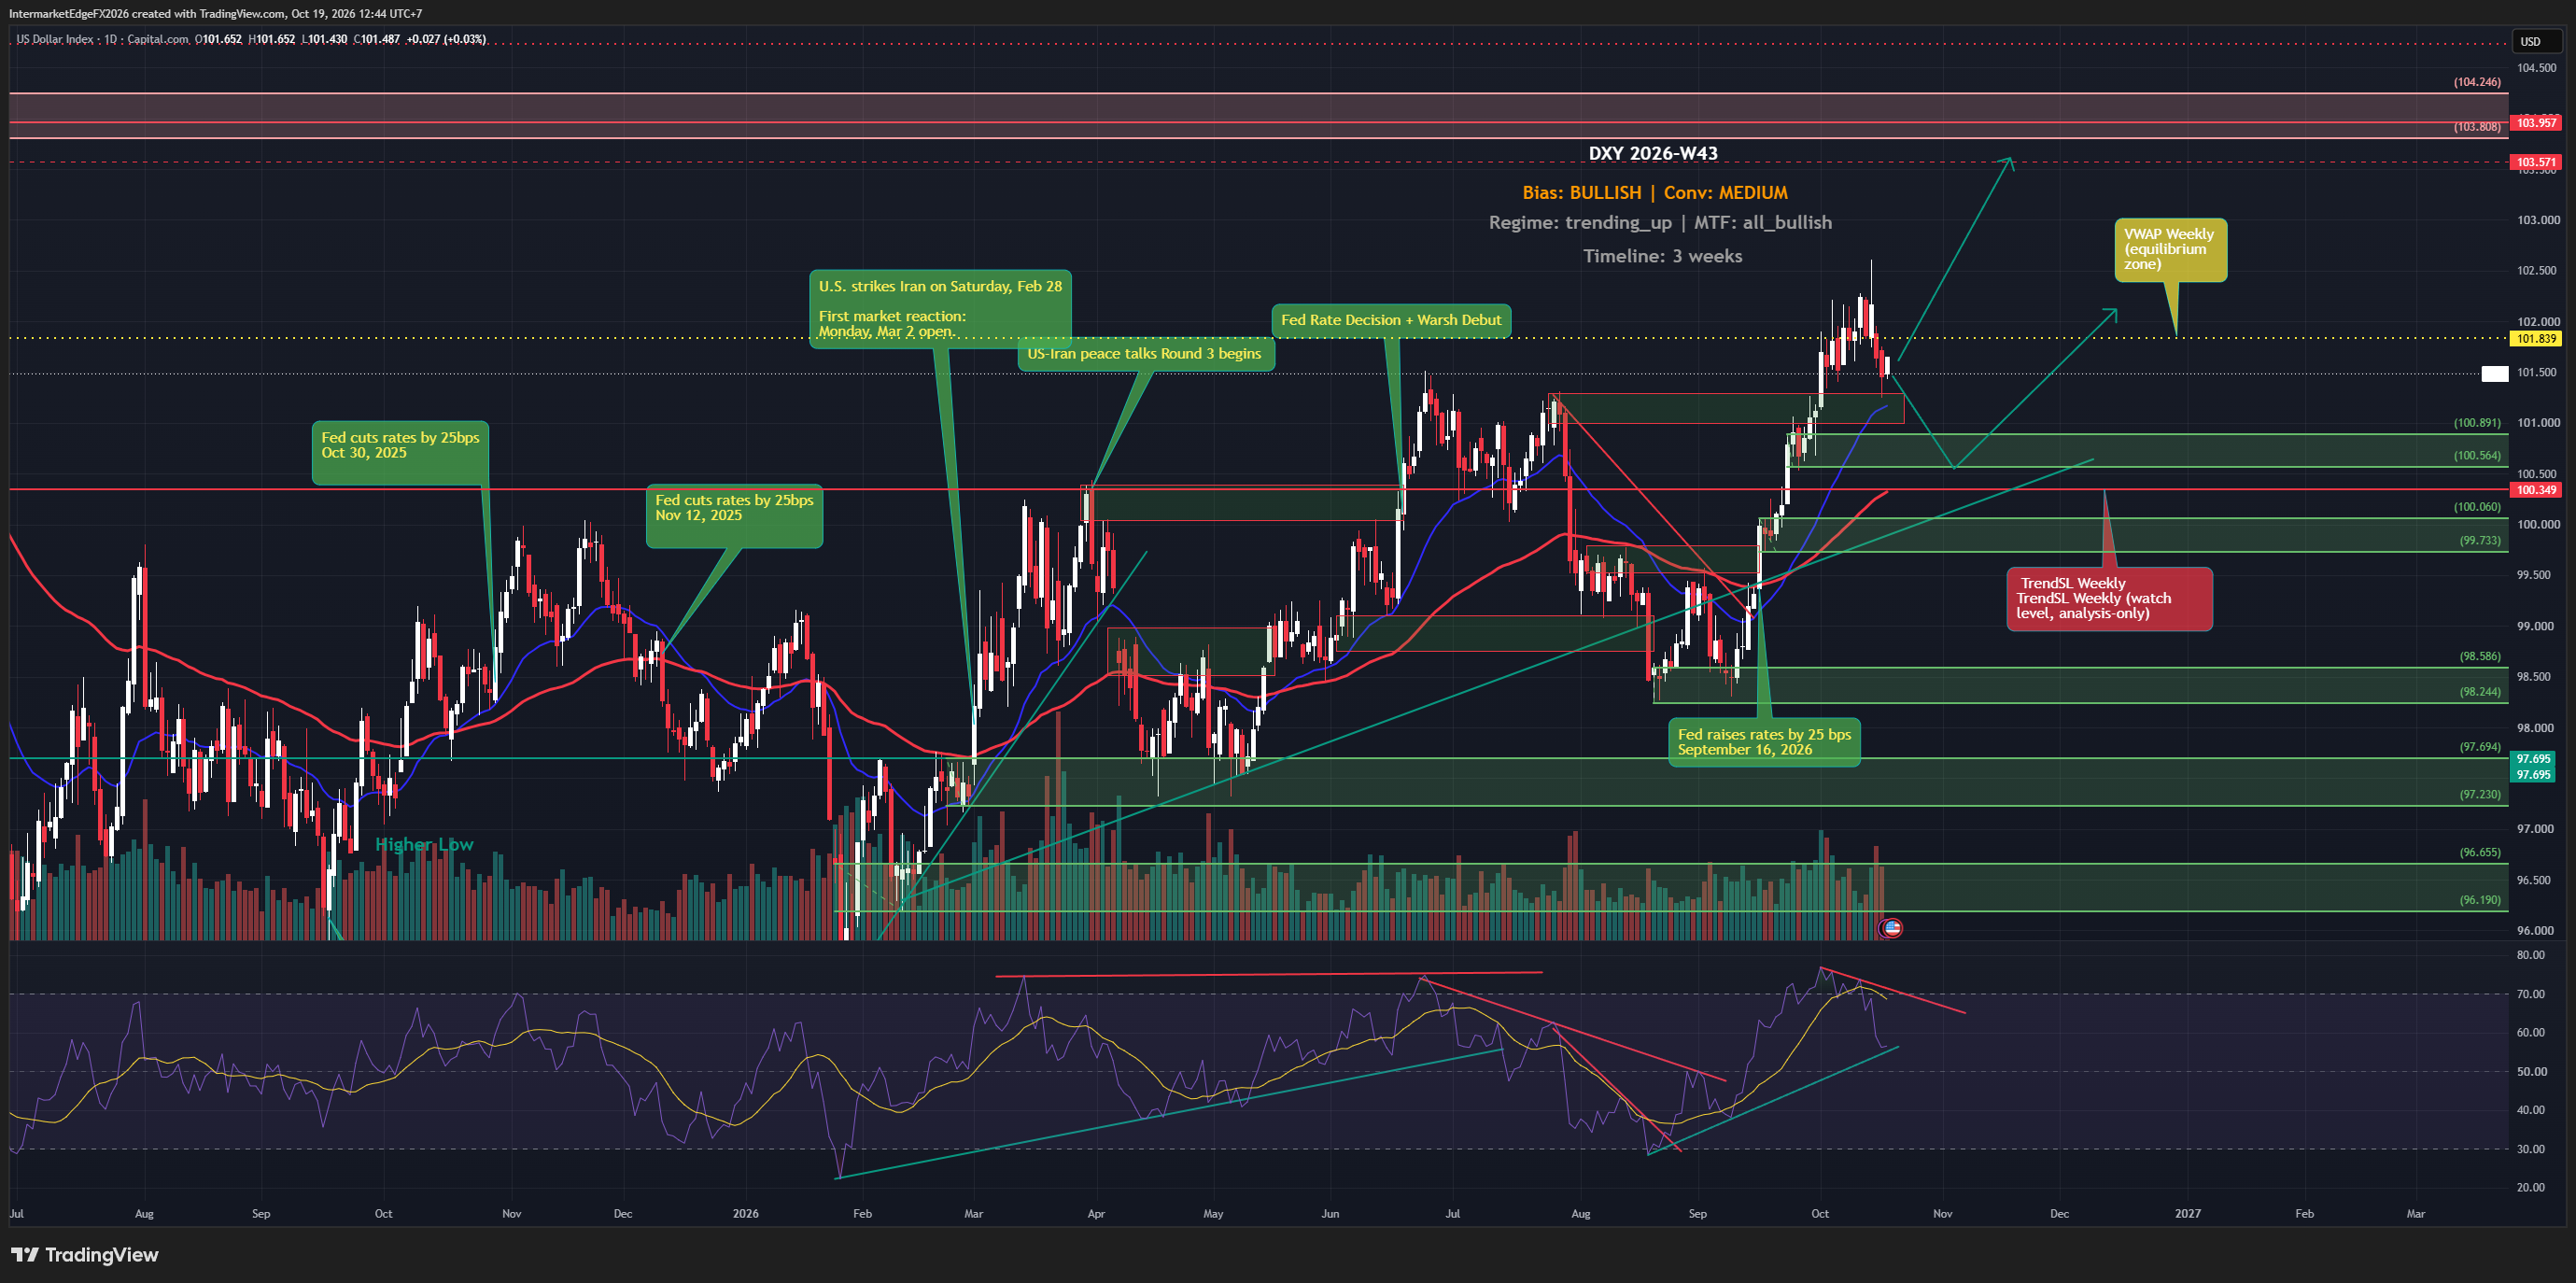
The US Dollar Index is trading near multi-month lows heading into Week W35-2026, and the bearish macro case looks clean on the surface, debt concerns, a weakening fiscal backdrop, and cross-timeframe alignment all pointing down. But underneath that surface, leveraged funds have already crowded into the short side, and price is actually testing from above the weekly VWAP at 98.841. When positioning is extreme and price refuses to break, the cleanest-looking trades tend to produce the messiest exits. The analytical framework carries a bearish bias on DXY for the three-week horizon, with the regime classified as trending down, meaning price structure, momentum, and multi-timeframe alignment are all oriented lower. In principle, the correct tactical posture in a trending-down regime is to follow the trend, not fade it. But the conviction here is deliberately set aside, and that deserves a clear explanation rather than a vague confidence label. Three signal sources are active this week: technical price action is actually leaning bullish, COT positioning is bearish, and macro defaults to a mild bullish tilt contingent on COT confirmation. The direct conflict between rising price action and extreme short positioning by leveraged funds, a COT divergence, is the central problem. COT divergence of this type, where price moves in one direction while professional speculators pile into the opposite side, carries two plausible readings: either the crowd is right and price is about to follow their positioning, or the crowd is too crowded and a short squeeze, a rapid, forced unwind of those short positions, is about to punish late entries. A short squeeze in this context means anyone short the dollar gets forced to cover simultaneously, driving the price sharply higher against the prevailing trend. -- Intermarket Edge (Note: COT (Commitment of Traders) data is released weekly by the CFTC with a reporting-period lag -- it is not a real-time position feed. See cftc.gov for the exac

USDJPY Week W34-2026: Price Stalls Below 159.2 as Fed Minutes Flag a September Hike, But the Technical Structure Disagrees

USDJPY Week W34-2026: Price Stalls Below 159.2 as Fed Minutes Flag a September Hike, But the Technical Structure Disagrees

USDJPY carries a bullish bias into Week W34-2026, but the pair is already trading below both the weekly VWAP at 159.2 and the weekly TrendSL at 159.3, testing from underneath, as of Friday, 21 August 2026 at 05:48 UTC. Fed minutes confirming a September hike is still on the table gave the dollar a fundamental argument, yet price has not followed through. The tension between a macro case for dollar strength and a technical structure that disagrees is exactly where traders get hurt. The bullish case for USDJPY rests on one dominant structural argument: the Fed-versus-BOJ rate differential is the most extreme in the G7. Rate differential, in practical terms, means that holding dollars earns you materially more than holding yen, and as long as that gap stays wide, there is a persistent mechanical incentive for traders and institutions to be long USDJPY. COT positioning, which tracks the net futures commitments of large speculators, though the specific report week and net-position figure are not confirmed here, so treat this as directional context rather than a precise citable number, leans clearly bullish, reinforcing the demand-side argument. Fed hawkishness and a real yield above 2% give that rate differential a durable foundation, not just a near-term nominal quirk. That combination is what generates a bullish label. But the conviction attached to that label is explicitly low, and the reason is structural: the thesis was generated with price already below both key weekly levels. The technical read and the macro read are pointing in opposite directions, which means the bullish label is best understood as a macro override of a bearish technical setup, not a technically confirmed trend entry. Adding to the complexity, BOJ hawkishness carries a real bearish weight on USDJPY. If the BOJ accelerates its tightening path, the carry trade that has funded so much yen weakness could begin to unwind rapidly. -- Intermarket Edge

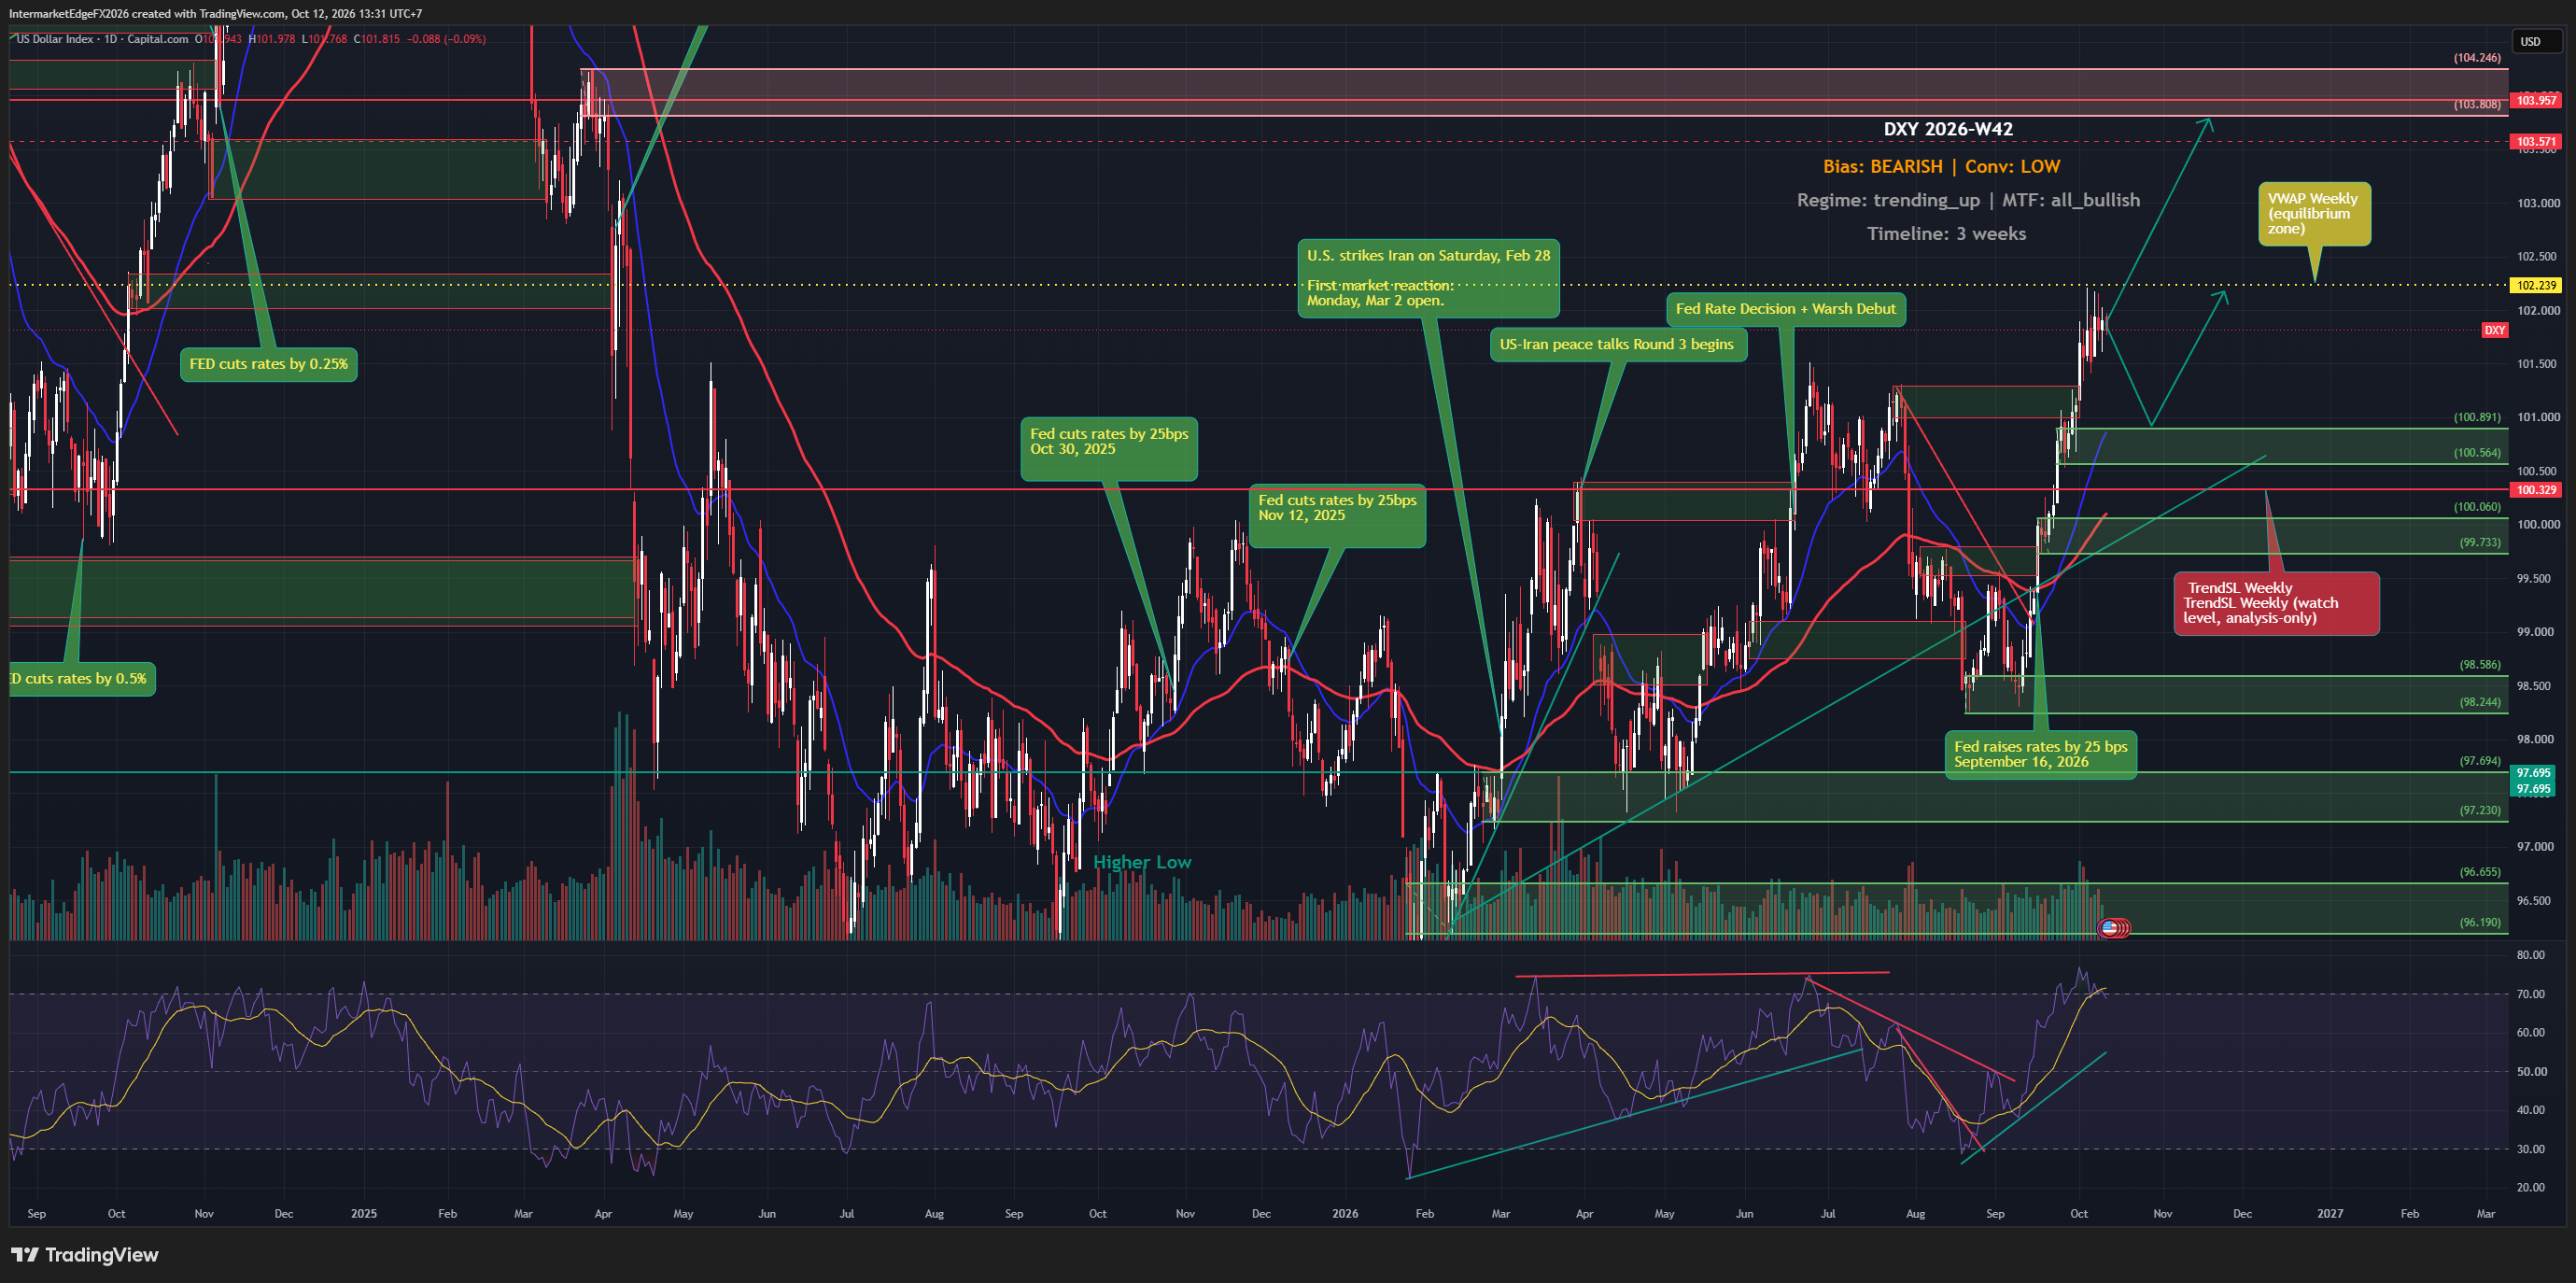
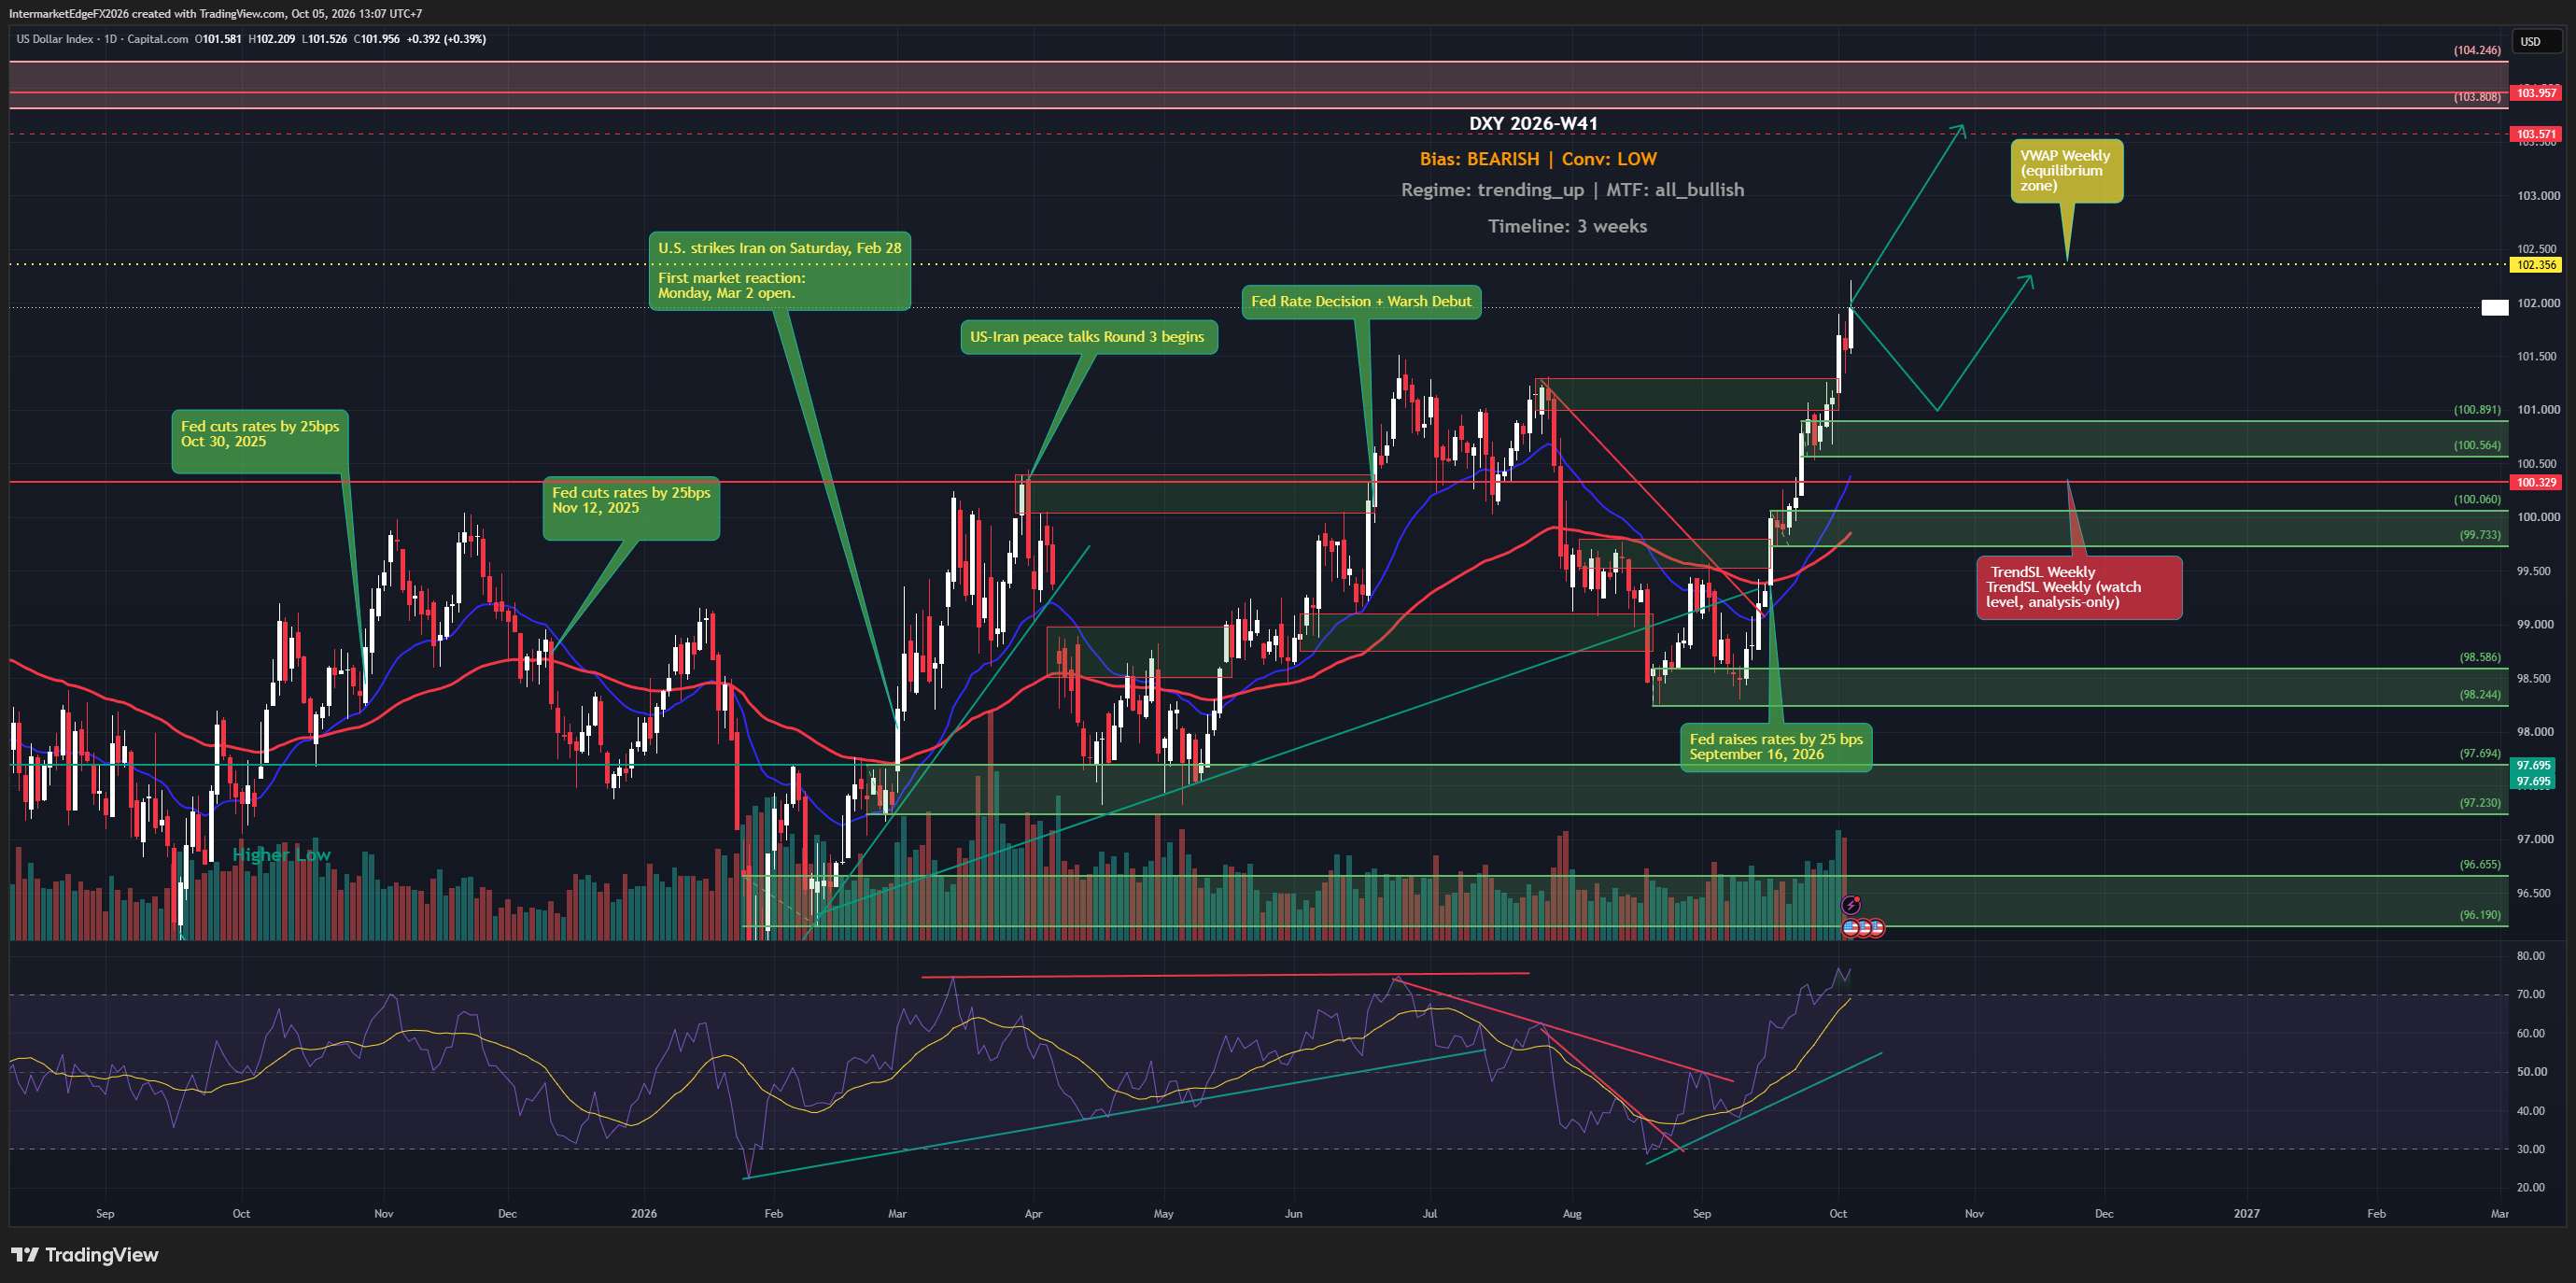
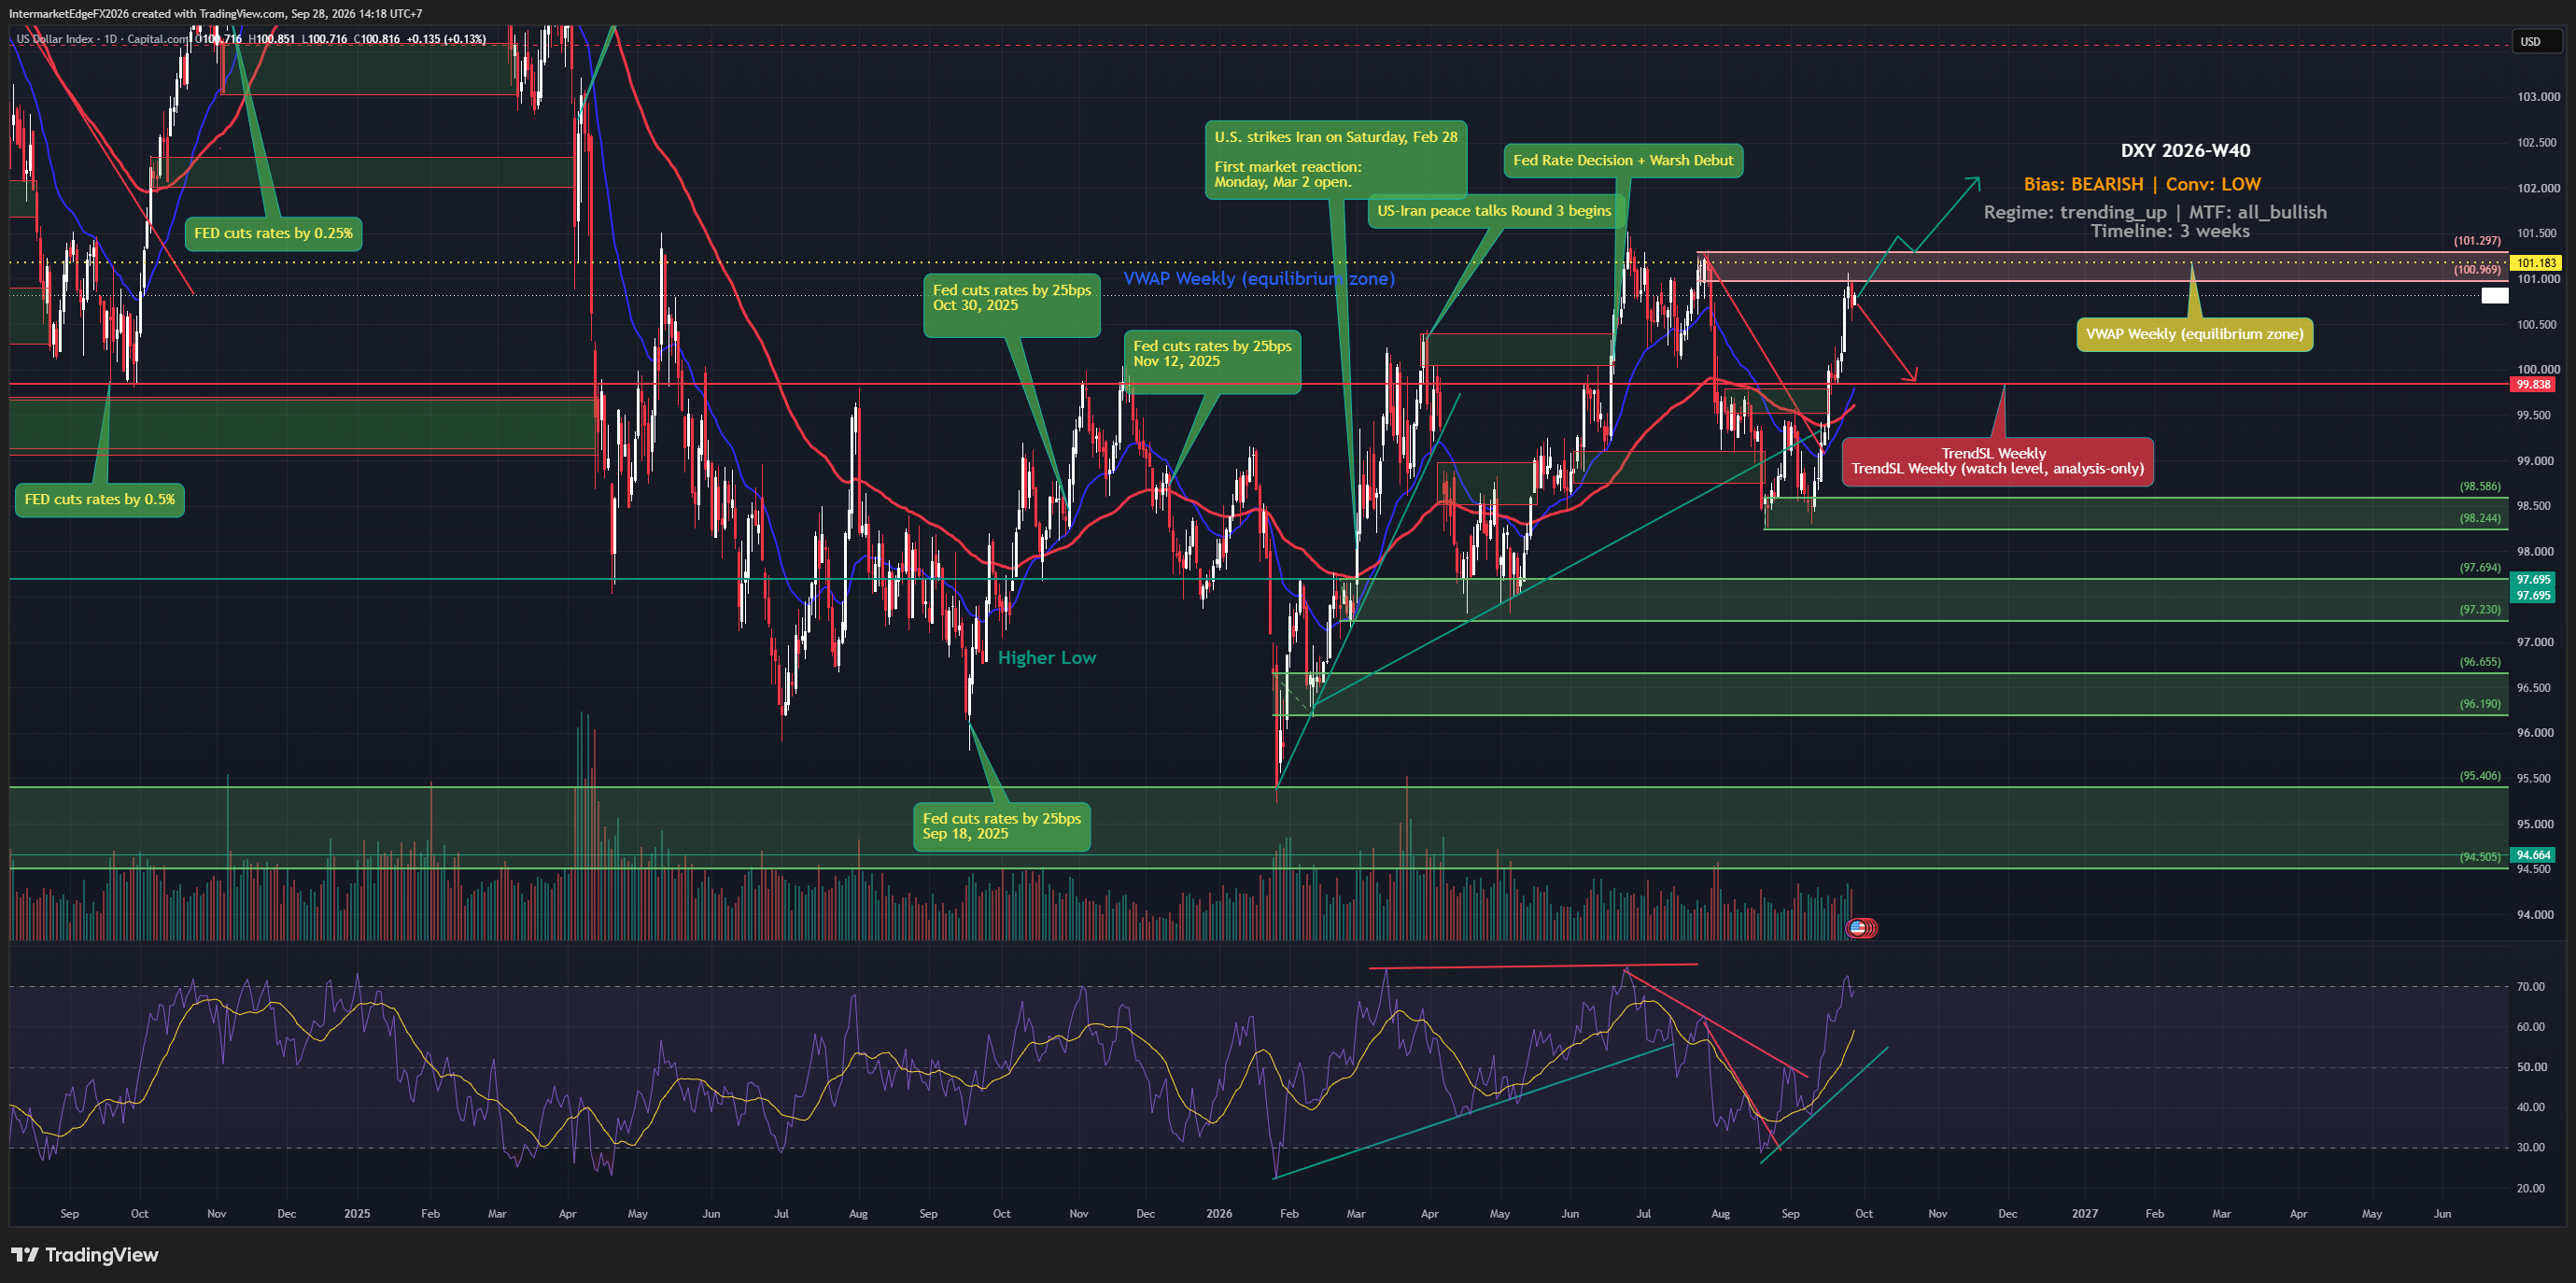
DXY Week W34-2026: Retail Sales Shock Sends Dollar Testing 99.485 VWAP, But a Crowded Short Could Flip the Move

DXY Week W34-2026: Retail Sales Shock Sends Dollar Testing 99.485 VWAP, But a Crowded Short Could Flip the Move

The dollar is under quiet but persistent pressure this week, with DXY trading at 99.479 as of Monday 17 August 2026, just a fraction below its weekly VWAP at 99.485, testing from underneath. A surprise drop in US retail sales, a consumer sentiment index that collapsed to 51.0 against a 54.2 expectation, and a core CPI print of 0.0% against a 0.2% forecast have combined to erode the fundamental case for a stronger dollar, even as yields stay elevated. The direction leans bearish, but the evidence is not yet convincing enough to size a position. The overall lean for DXY this week is bearish, and the trend regime is clearly downward, but the conviction supporting that bias is deliberately low, and the analysis here reflects a decision to stand aside rather than treat the bearish lean as an actionable entry signal. Here is why that matters: the framework shows a direct conflict between what price has been doing and what institutional positioning implies. Price action has been constructive, technically, the trend has shown some bullish characteristics. But commitments of traders data shows leveraged funds sitting at extreme short positioning. That divergence creates what traders call crowding risk on the short side: if the majority of active participants are already short (note, the COT figures cited here reflect directional scoring from the brief and do not specify the exact report week or net-position count, so treat this as directional evidence rather than a standalone citable statistic), there are fewer fresh sellers left to push the dollar lower, and any positive catalyst can trigger a sharp short-covering rally that has nothing to do with fundamentals changing. -- Intermarket Edge

USDJPY W33: The Uptrend Meets a Yen Intervention Test

USDJPY W33: The Uptrend Meets a Yen Intervention Test

The yen is heading for a weekly loss and Reuters is already reporting bets for another intervention, yet USDJPY is trading below its weekly VWAP at 159.35 as of Friday, 14 August 2026, meaning short-term momentum is running against the very bullish structure that underpins the trend. The Fed-BOJ rate differential remains the most extreme in the G7, but a flat CPI print has cooled rate-hike expectations. The setup is directionally bullish but tactically uncomfortable right now. The directional case for USDJPY remains bullish, but the conviction sitting behind that call is deliberately low, not because the trend is broken, but because the evidence is not yet strong enough to justify sizing a position with confidence. The Fed-BOJ rate differential is the structural anchor: the US 10-year yield at 4.7% against a BOJ that is only beginning to normalize policy creates the widest carry spread in the G7, and COT positioning data, which tracks how large speculative and commercial participants are positioned in futures markets, has been leaning bullish, suggesting the broader market has not abandoned the yen-weakness trade. The caveat is that the COT read here is directional evidence rather than a precise citable statistic, since the brief does not specify the exact report week or net-position figure. What makes the current picture complicated is a direct and acknowledged signal conflict: the Fed's hawkish stance is bullish for USDJPY, while the BOJ's own hawkish pivot is bearish, because a BOJ rate hike erodes the yield advantage that makes holding yen-funded carry trades profitable. Both signals carry equal analytical weight. Add to that a CPI miss that has already begun to cool hike expectations, and the macro pillar of the bullish case is noticeably thinner than it was a week ago. -- Intermarket Edge

DXY Week W33-2026: Dollar Tests VWAP From Underneath as Fed Hawk Dissent and Iran Uncertainty Pull in Opposite Directions

DXY Week W33-2026: Dollar Tests VWAP From Underneath as Fed Hawk Dissent and Iran Uncertainty Pull in Opposite Directions

The US Dollar Index slipped to 99.846 as of Tuesday, 11 August 2026 at 08:40 UTC, sitting below its weekly VWAP of 99.895 and testing that level from underneath. A shocking Core CPI miss, actual 0.0% against a 0.2% forecast, has stripped one of the dollar's key near-term supports, even as Fed dissenter Hammack openly advocates for rate hikes and geopolitical noise from the Iran situation keeps traders cautious. The multi-timeframe picture is uniformly bearish, but conviction is too thin to size aggressively in either direction right now. The overall bias on DXY for W33-2026 is bearish, aligned with a confirmed trending-down regime, and every timeframe in the multi-timeframe stack is pointing in the same direction. In that sense, the directional read is not ambiguous, the regime says trend-follow short. The problem is conviction, which is assessed as skip-level, meaning this is explicitly not a week to be sizing into fresh positions aggressively, and the reasons for that are worth spelling out clearly so traders understand the risk they are taking if they choose to engage anyway. The central tension is a direct conflict between price action and Commitments of Traders (COT) positioning data. Price action over recent sessions has been constructive for the dollar, carrying a bullish short-term signal, while COT data, which tracks reported positioning across speculator categories and should be read as directional evidence rather than a precise, citable statistic given the brief does not specify the exact report week or net-position figures, shows leveraged funds at extreme short positioning. This is a classic COT divergence setup, and the rule here is contrarian: when speculative shorts are already crowded to an extreme, the pool of fresh sellers willing to push price lower is by definition shrinking. -- Intermarket Edge

DXY Week W32-2026: ISM Manufacturing Surges to 55.6 as Dollar Tests VWAP at 99.687 From Above, But Macro Signal Conflict Keeps Bears Cautious

DXY Week W32-2026: ISM Manufacturing Surges to 55.6 as Dollar Tests VWAP at 99.687 From Above, But Macro Signal Conflict Keeps Bears Cautious

The US Dollar Index is under a trending bearish regime heading into Week W32-2026, yet the setup is anything but clean. Manufacturing activity just printed its strongest reading since May 2022, core CPI missed forecasts badly, and price is currently pressing against a critical structural level, all while the overall bias remains bearish with low conviction. This is a week for watching and assessing, not for forcing a position. The overall bias on DXY for Week W32-2026 is bearish, but conviction is explicitly low, and traders must handle this carefully. The multi-timeframe technical regime is aligned bearish across all timeframes, and the broader trend regime is classified as trending down with moderate confidence. That said, the signal picture is heavily conflicted. Both price action and the macro backdrop are currently pointing toward Dollar strength, the ISM beat, the still-elevated real yield of 2.41%, and the active causal chains around Fed policy relative to the G6 central bank basket and the residual influence of the prior hot inflation environment all argue for USD resilience. The rule engine's bearish override is driven by Fed policy divergence assessed relative to the broader G6 central bank basket, not by any single domestic data point, and it represents a structural thesis rather than a tactical one. Critically, three of five signal input categories, positioning data, liquidity indicators, and sentiment surveys, fired zero confirming signals this week. That is not a minor gap; it means the bearish call is resting on a much narrower evidential base than would normally justify an active directional stance. A macro bullish signal is also present but flagged as a provisional placeholder, subject to override if positioning data aligns in future reports. -- Intermarket Edge

Stay in the loop

Get notified about new research, macro insights, and market analysis.

InterMarketEdge

© 2026 InterMarketEdge. Financial intelligence for inter-market traders.