Articles — InterMarketEdge

Articles

Financial intelligence, macro research, and inter-market analysis.

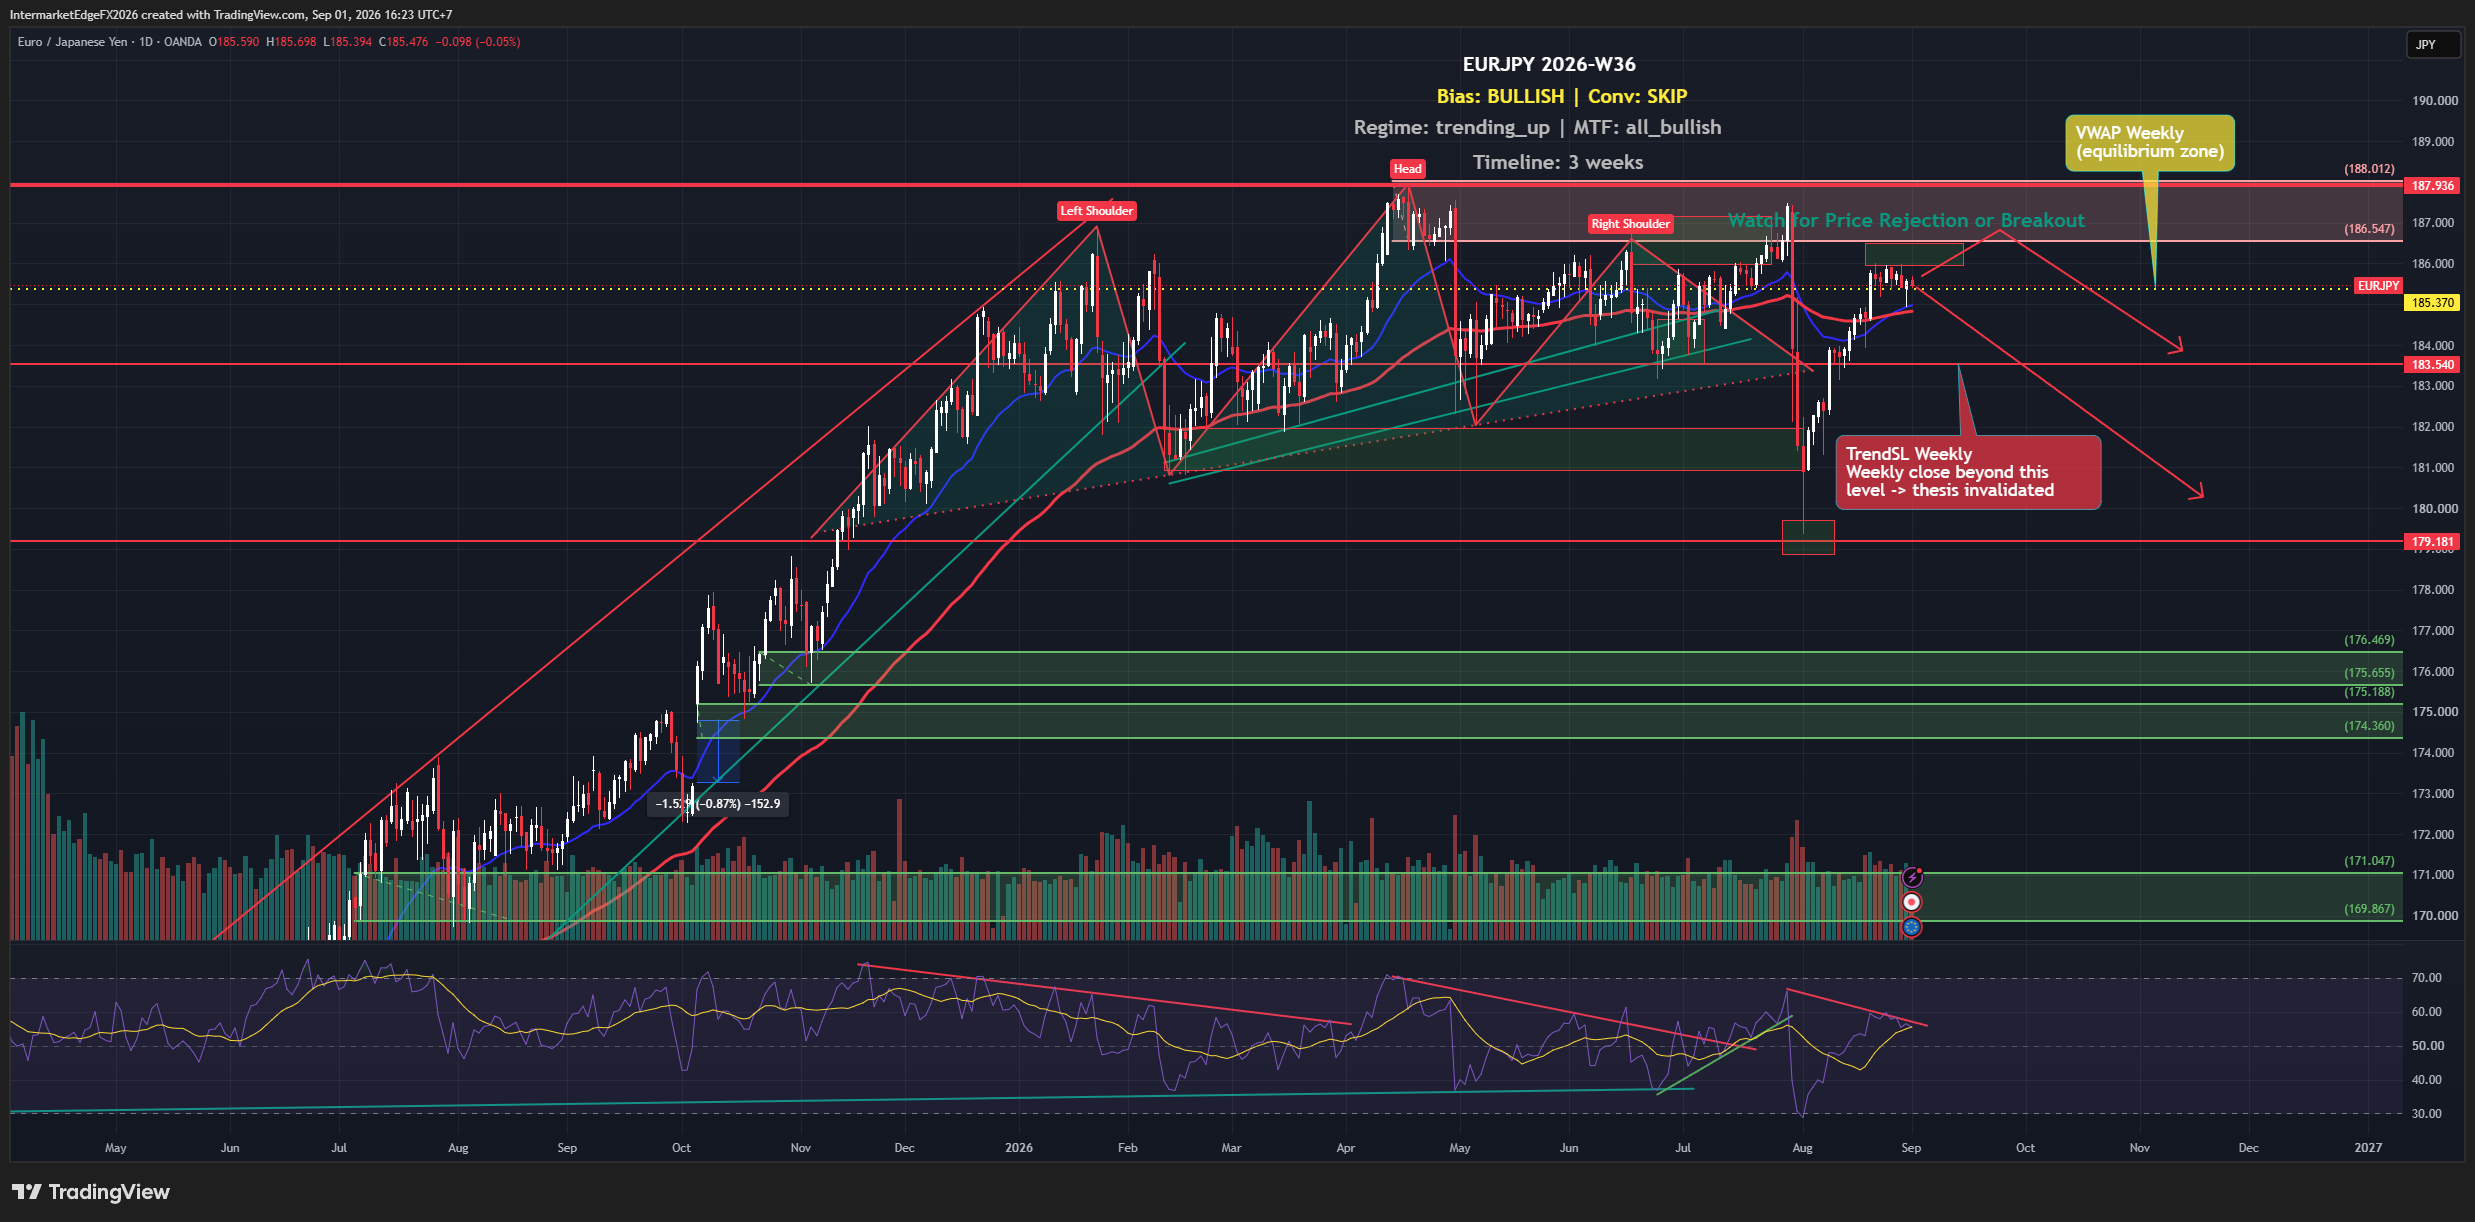
EURJPY Week W36-2026: Technicals Hold Above 185.37 as Japan's Retail Sales Surge Meets a Dollar Bidding for Rate Hikes

EURJPY Week W36-2026: Technicals Hold Above 185.37 as Japan's Retail Sales Surge Meets a Dollar Bidding for Rate Hikes

EURJPY is trading at 185.6 as of Tuesday, 01 September 2026, sitting just above its weekly VWAP at 185.37 with every timeframe technically aligned to the upside. Japan just delivered a retail sales print of 4.0% YoY, nearly double the forecast, and industrial output surprised to the upside as well. Yet the overall bullish conviction here is deliberately low, and that gap between clean technicals and absent macro support is exactly the tension worth understanding before sizing any exposure. The bullish bias on EURJPY for week W36-2026 rests on a single, structurally sound but narrowly sourced pillar: every technical timeframe, daily, weekly, and monthly, is aligned to the upside. That kind of multi-timeframe agreement is not common and is not trivial; it indicates the dominant trend is consistently reproduced at every analytical resolution, which reduces the probability that any one signal is noise. The practical effect is that the path of least resistance, absent a disrupting catalyst, points higher. What complicates this is that technical alignment is the only signal firing. COT positioning, which measures how leveraged and institutional accounts are positioned and would indicate whether professional capital is actually behind the move, has returned neutral with no directional read this week, so it is not possible to say the trend is being driven by the kind of committed positioning that sustains extended moves. Macro signals, sentiment gauges, and liquidity conditions have all returned similarly flat. This matters because a trend that rests solely on price-derived signals, without confirmation from who is positioned and why, carries crowding risk in a different form: the risk that the apparent trend is thin and vulnerable to a rapid unwind the moment a real macro trigger appears. The BOJ policy trajectory is the most direct potential disruptor on the JPY leg. -- Intermarket Edge (Note: COT (Commitment of Traders) data is released weekly by the CFTC with a report
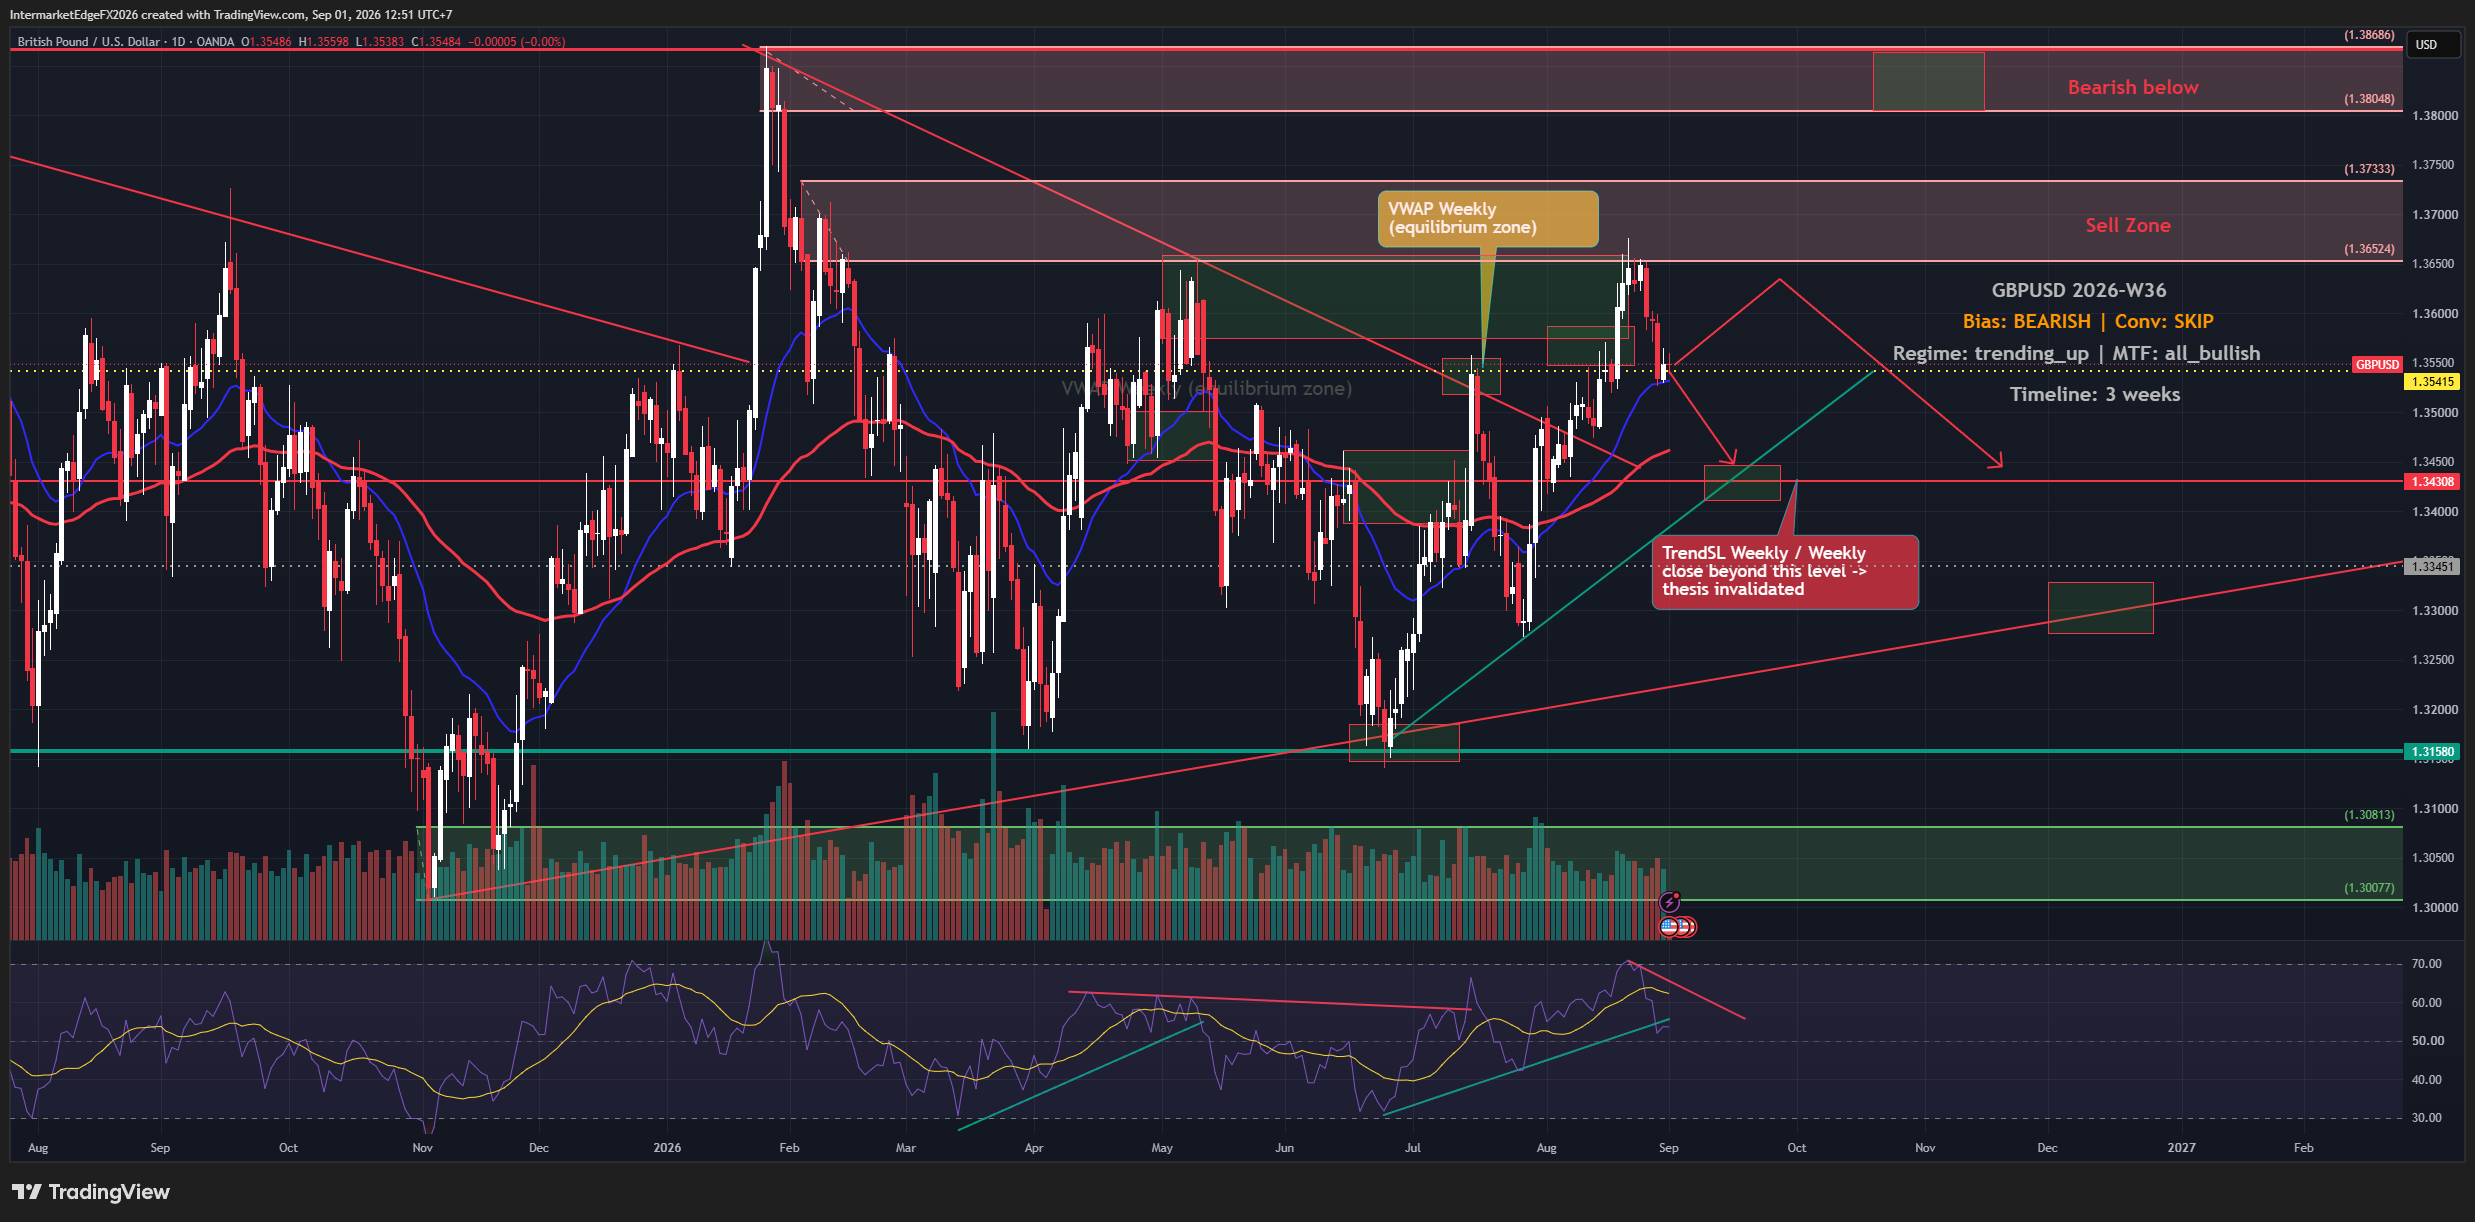
GBPUSD Weekly Outlook W36: Bullish Structure, Bearish Macro Pressure

GBPUSD Weekly Outlook W36: Bullish Structure, Bearish Macro Pressure

GBPUSD is printing a weekly loss as markets reassess the BoE-Fed policy divergence, but the technical structure refuses to cooperate with the bearish story. As of Tuesday, 01 September 2026, price sits at 1.35433, holding above the weekly VWAP at 1.35415 and well above the weekly trend support at 1.34308. The macro case for sterling weakness is building, yet the chart is not confirming it. That disconnect is the entire trade problem this week. The framework lands on a bearish bias for GBPUSD over a three-week horizon, but that label carries a deliberate caveat: this is a case where the evidence is not yet convincing enough to size a position, and staying out is itself a reasoned decision rather than the absence of a view. The bearish case rests on two causal chains that are both active right now. First, Fed hawkishness combined with rising real yields creates a structural USD bid, when real yields rise, the opportunity cost of holding non-dollar assets increases, pulling capital toward the dollar and mechanically weighing on GBPUSD. Second, DXY strength, itself driven by the same real yield dynamic, amplifies that pressure through a separate channel, since broad dollar appreciation tends to compress GBPUSD regardless of sterling-specific factors. COT data adds a warning layer: speculative positioning in GBP is already tilted heavily long, which matters because crowding risk, the danger that most participants who want to be long are already long, leaving fewer buyers to sustain the move, raises the probability of a disorderly unwind if sentiment shifts. The positioning evidence here should be read as directional in character, not as a citable statistic, since the specific report date, net position figure, and sample context are not available in this brief. -- Intermarket Edge

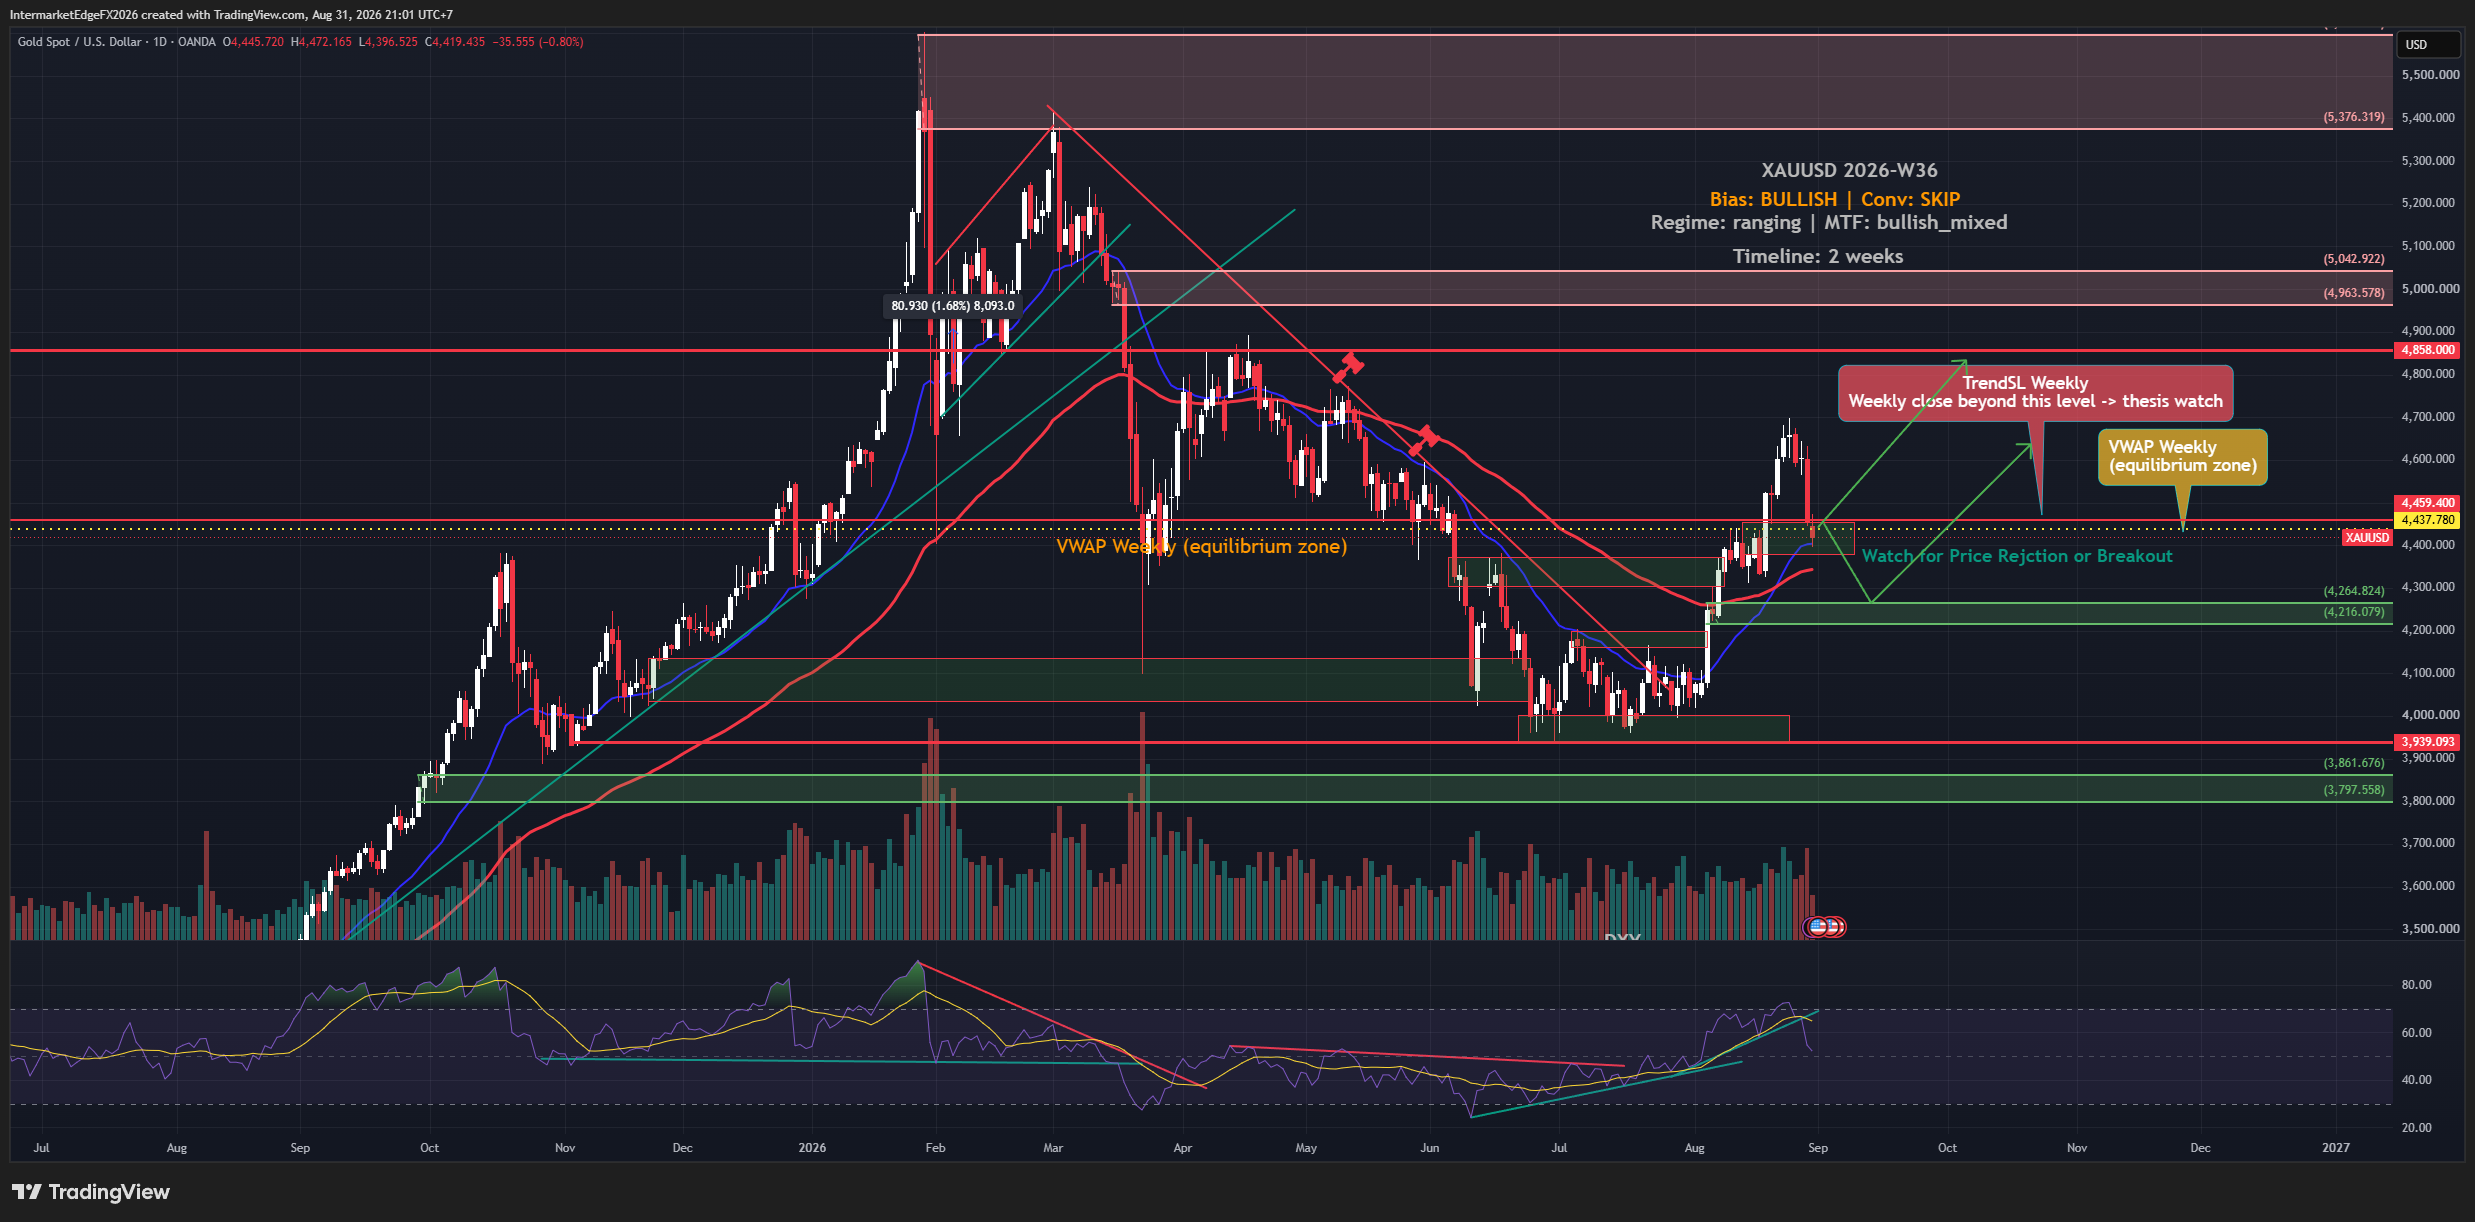
XAUUSD Weekly Outlook: Hawkish Shock, Unconfirmed Bull Case

XAUUSD Weekly Outlook: Hawkish Shock, Unconfirmed Bull Case

Gold fell more than 3% in a single session after Fed Chair Kevin Warsh signaled further rate hikes if inflation does not clearly return toward 2%, lifting September hike probability from roughly 36% to around 62%. Yet despite that sharp Friday selloff, spot gold near 4,448 dollars remained on course for its strongest monthly gain since January. That contradiction, brutal single-session damage inside a bullish monthly trend, is exactly the kind of setup where traders read the direction right and still get hurt. The framework labels XAUUSD bullish for the two-week window, but deliberately attaches a stand-aside posture to that label, meaning the evidence is not convincing enough to size a position, and that is a considered analytical conclusion rather than an absence of a view. Understanding why that gap exists between the directional label and the action status is the practical takeaway. Price signals, the inputs the analysis weighs most heavily for direction, lean bullish. But the COT data through August 25 showed managed money net long 144,747 COMEX gold contracts, up 3,099 from the prior week. It is worth noting that this COT reading predates Friday's sharp selloff, so the actual positioning picture after that session is unknown and must be treated as lagged. Even before accounting for that lag, the level itself is a crowding risk: when speculative longs are already concentrated at an extreme, the question becomes who is left to push price higher, and the answer often determines whether a bullish thesis accelerates or reverses violently on any negative catalyst. That COT reading conflicts directly with the bullish price signals, and the framework flags this openly rather than resolving the conflict artificially. -- Intermarket Edge (Note: COT (Commitment of Traders) data is released weekly by the CFTC with a reporting-period lag -- it is not a real-time position feed. See cftc.gov for the exact release schedule.)

DXY Weekly Outlook W36: Hawkish Fed, Bearish Structure

DXY Weekly Outlook W36: Hawkish Fed, Bearish Structure

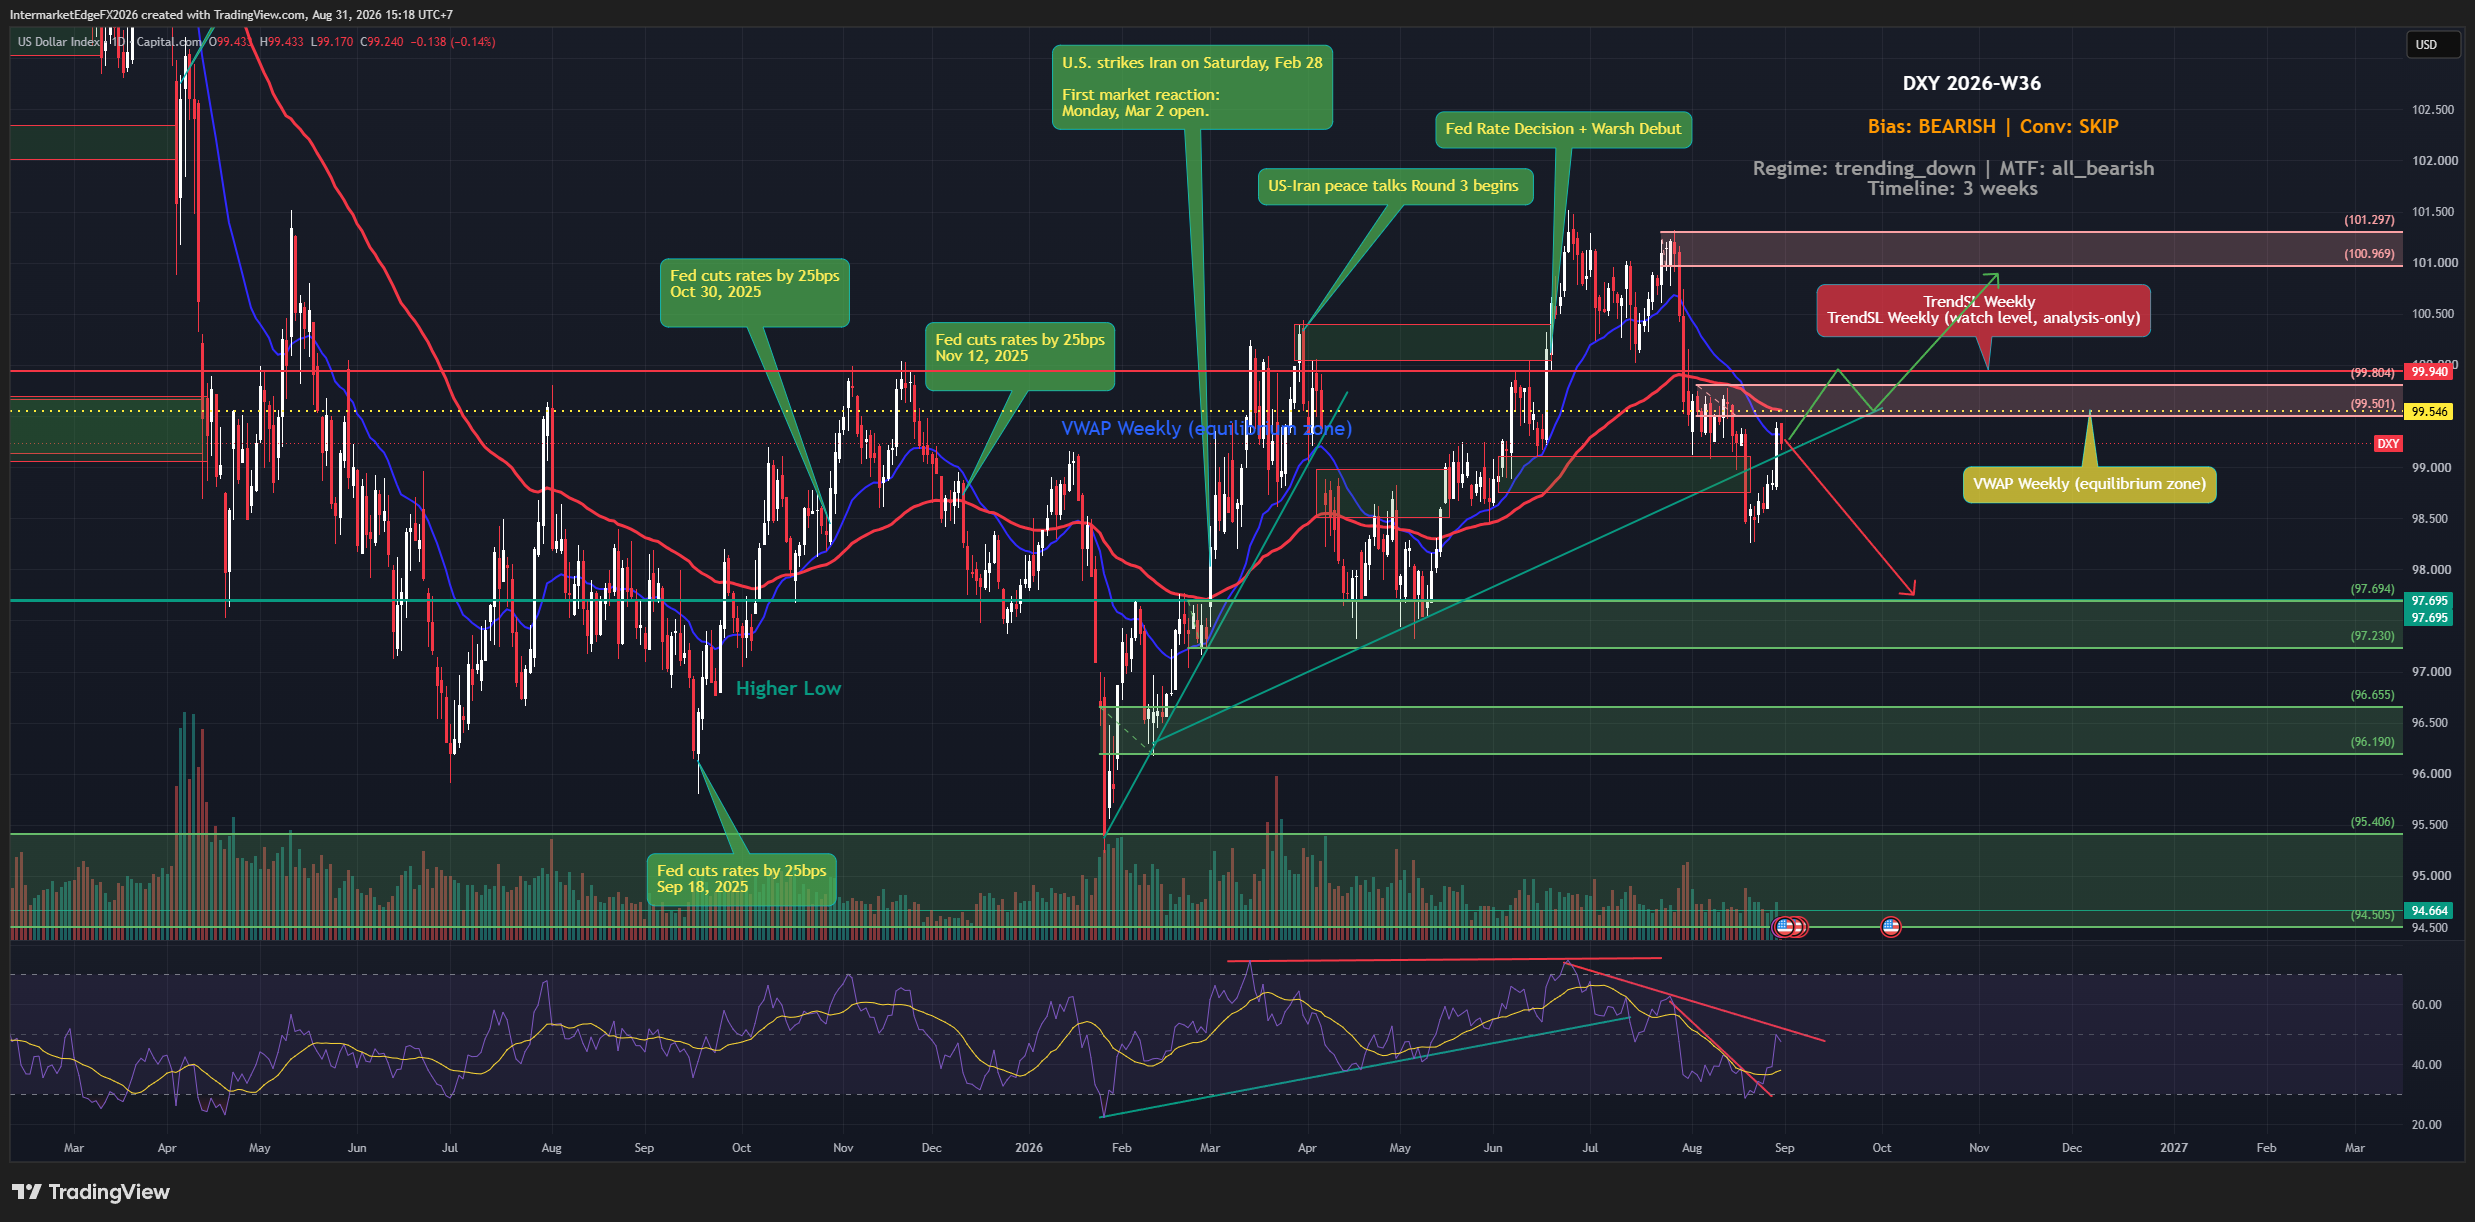
Fed Chair Kevin Warsh just opened the door to further rate hikes if inflation stays sticky, pushing the September hike probability from roughly 36% to around 58%, and the dollar responded, rising about 0.6% to the 99.6-99.7 range. That repricing sounds unambiguously bullish for the DXY. But leveraged funds are already sitting on extreme short positions in the dollar, which means the crowd most likely to fuel a sustained rally may already be largely offside. The payrolls report on September 4 is now the deciding test. The multi-timeframe structure on DXY remains bearish, with alignment across timeframes pointing in the same direction, the regime is trending down, and the framework's FX implication is to follow that trend rather than fade it. That said, the conviction behind this week's bearish read is deliberately low, and staying out of a full position is the rational response to the current evidence, not a failure of analysis. The reason conviction is suppressed comes down to a specific, unresolved conflict. Price action over the past week has been technically constructive, the dollar bounced, reclaimed short-term levels, and printed near a two-week high. Meanwhile, COT positioning data shows leveraged funds holding extreme short positions in the dollar. This is a meaningful divergence: if speculators are already heavily short, there is a contrarian question worth taking seriously, who is left to sell? A market where the bearish crowd is already crowded (crowding risk, meaning the position is so consensus that a reversal triggers forced covering rather than fresh selling) can squeeze sharply on any positive catalyst, and Warsh's hawkish signal plus the geopolitical oil spike are exactly the kind of catalysts that can trigger such covering. -- Intermarket Edge (Note: COT (Commitment of Traders) data is released weekly by the CFTC with a reporting-period lag -- it is not a real-time position feed. See cftc.gov for the exact release schedule.)

USDJPY: A Bullish Macro Lean Still Lacks Technical Confirmation

USDJPY: A Bullish Macro Lean Still Lacks Technical Confirmation

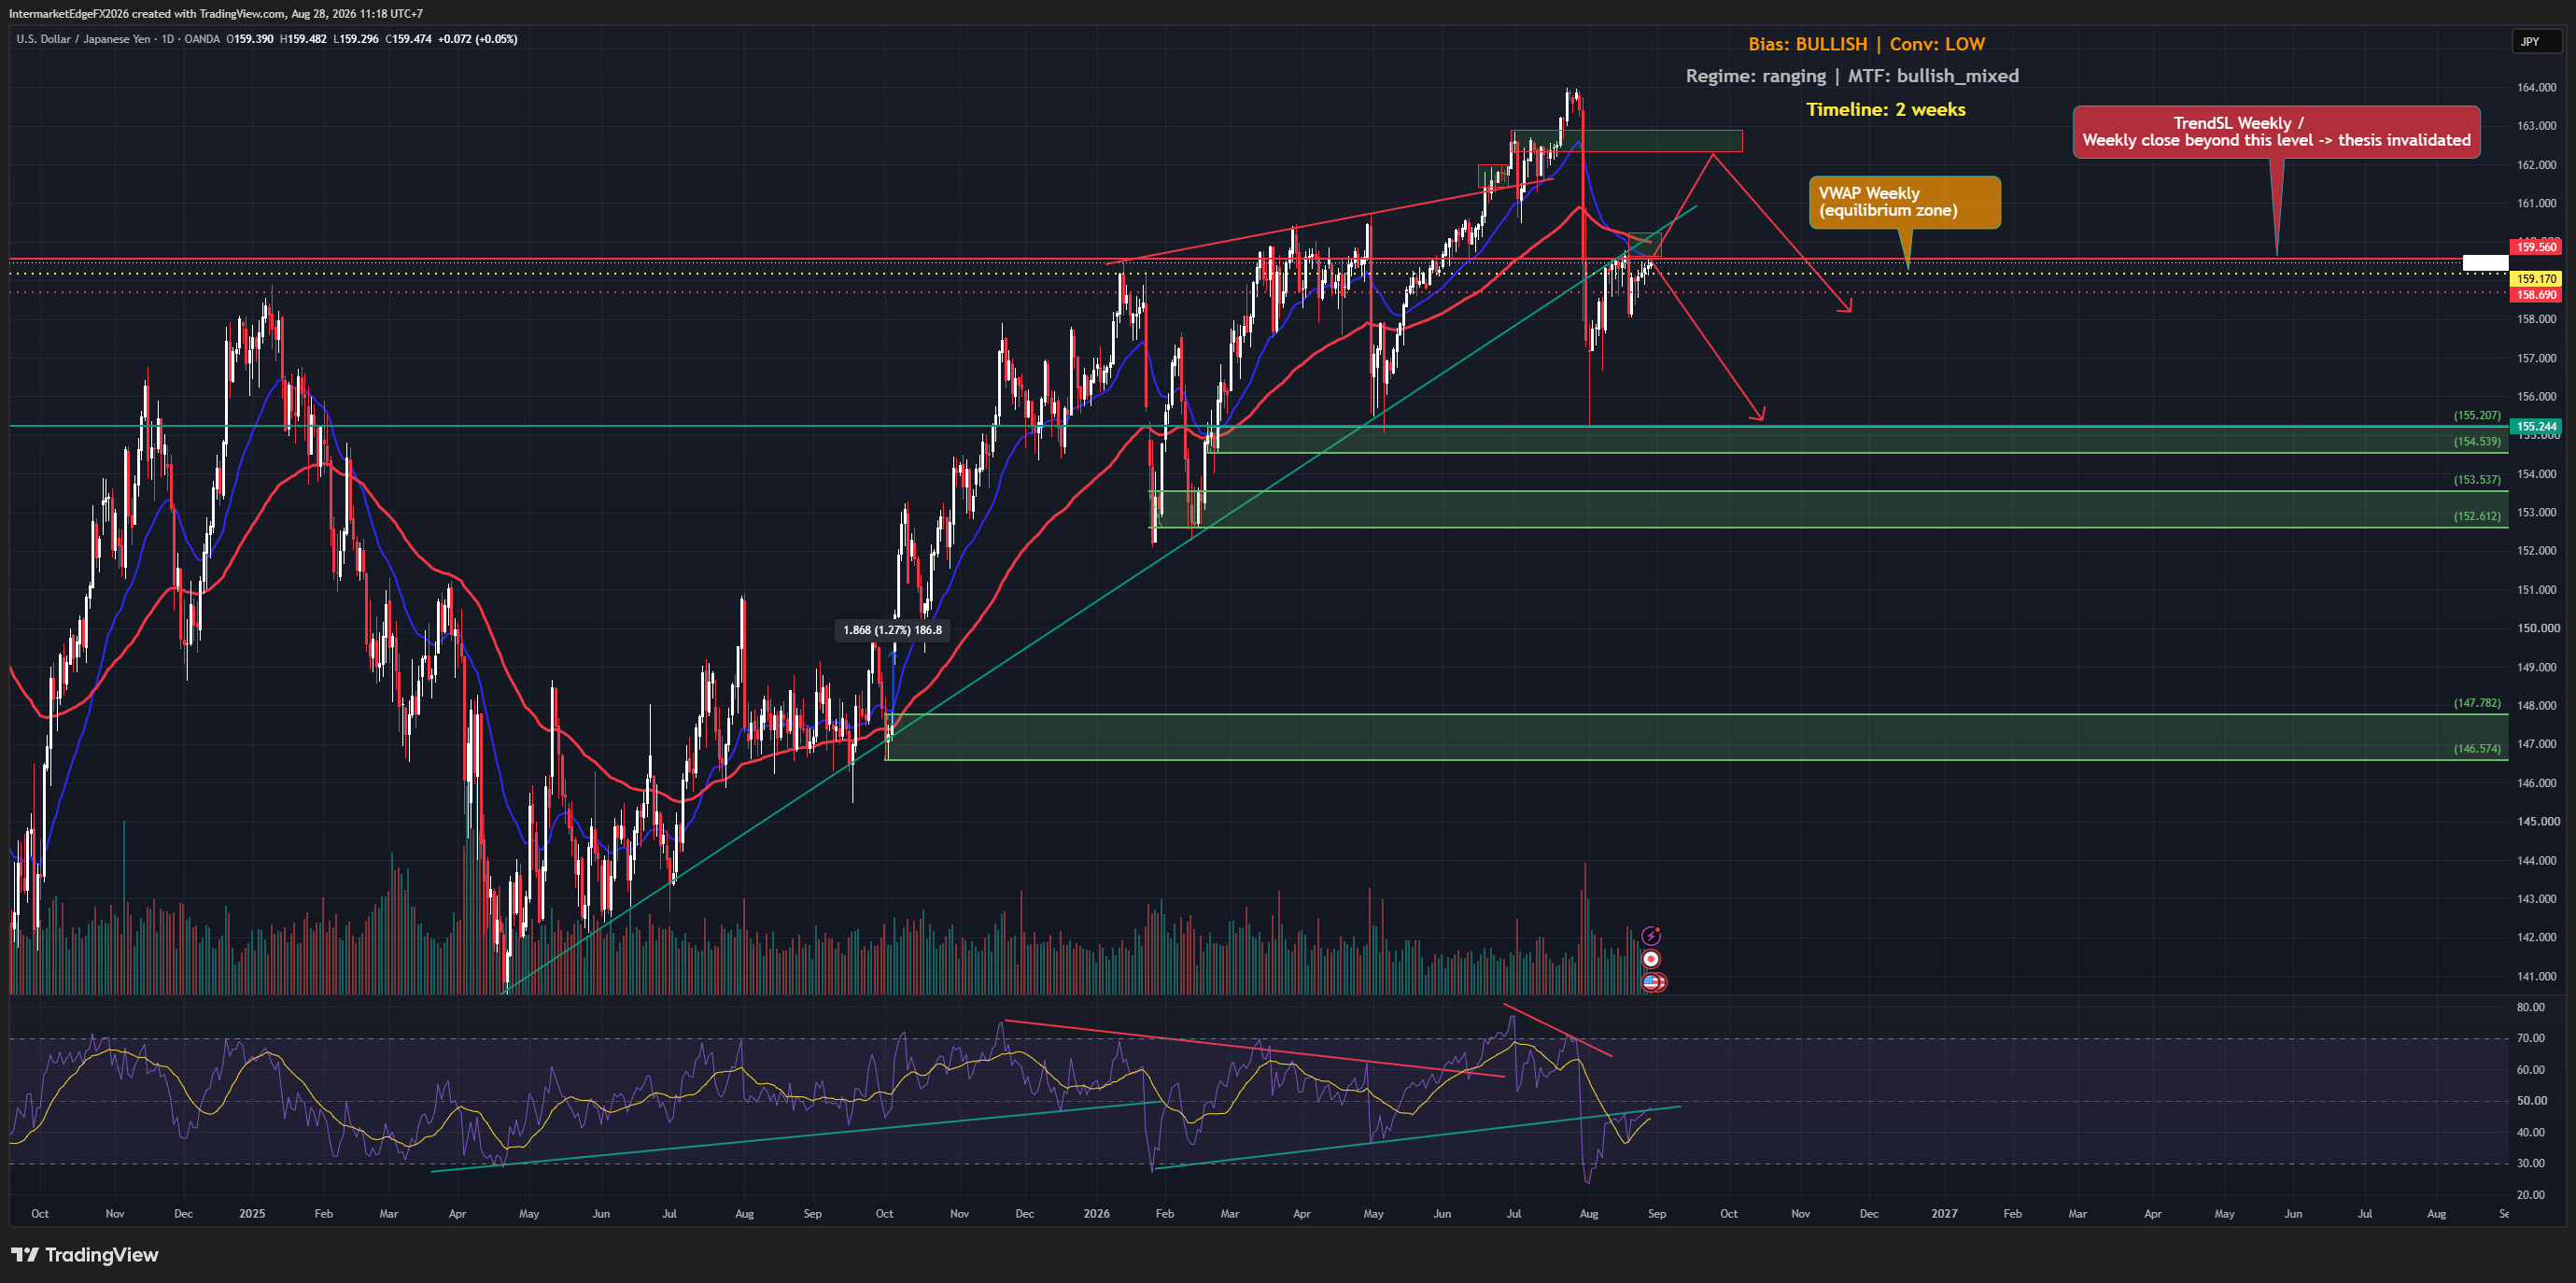
USDJPY is caught between two equally weighted forces right now: a Fed that keeps real yields at 2.34%, firmly supporting the dollar side of the trade, and a BOJ whose hawkish posture remains the single biggest tail risk capable of unraveling the entire carry position. As of Friday 28 August 2026 at 03:59 UTC, the pair sits at 159.37, holding above the weekly VWAP at 159.17 but unable to push through the TrendSL at 159.56. That gap tells the real story this week. The framework flags a bullish bias on USDJPY for the next two weeks, but the conviction attached to that label is deliberately low, meaning the evidence tilts directionally positive without being strong enough to justify aggressive sizing. The two pillars holding the bullish case together are COT positioning, which leans bullish (though the specific report week, net-position figure, and release date are not specified in the available data, so this should be read as directional evidence rather than a precise statistic), and price action itself, which is currently holding above the weekly VWAP at 159.17 as of Friday 28 August at 03:59 UTC. The critical tension sits in the causal chains pulling in opposite directions with roughly equal force. Fed hawkishness, anchored by real yields at 2.34%, pushes USDJPY higher by widening the rate differential and reinforcing dollar demand. BOJ hawkishness, simultaneously, pushes it lower by threatening to narrow that same differential and triggering carry unwinds. Both forces carry substantial weight, and the data this week does not resolve which dominates. Tokyo CPI missed slightly, which temporarily reduces immediate BOJ pressure, but the improving labor market and the BOJ's own gradual recovery narrative keep the hawkish scenario on the table. -- Intermarket Edge

USDCAD: Bullish Macro Label Meets a Bearish Price Structure

USDCAD: Bullish Macro Label Meets a Bearish Price Structure

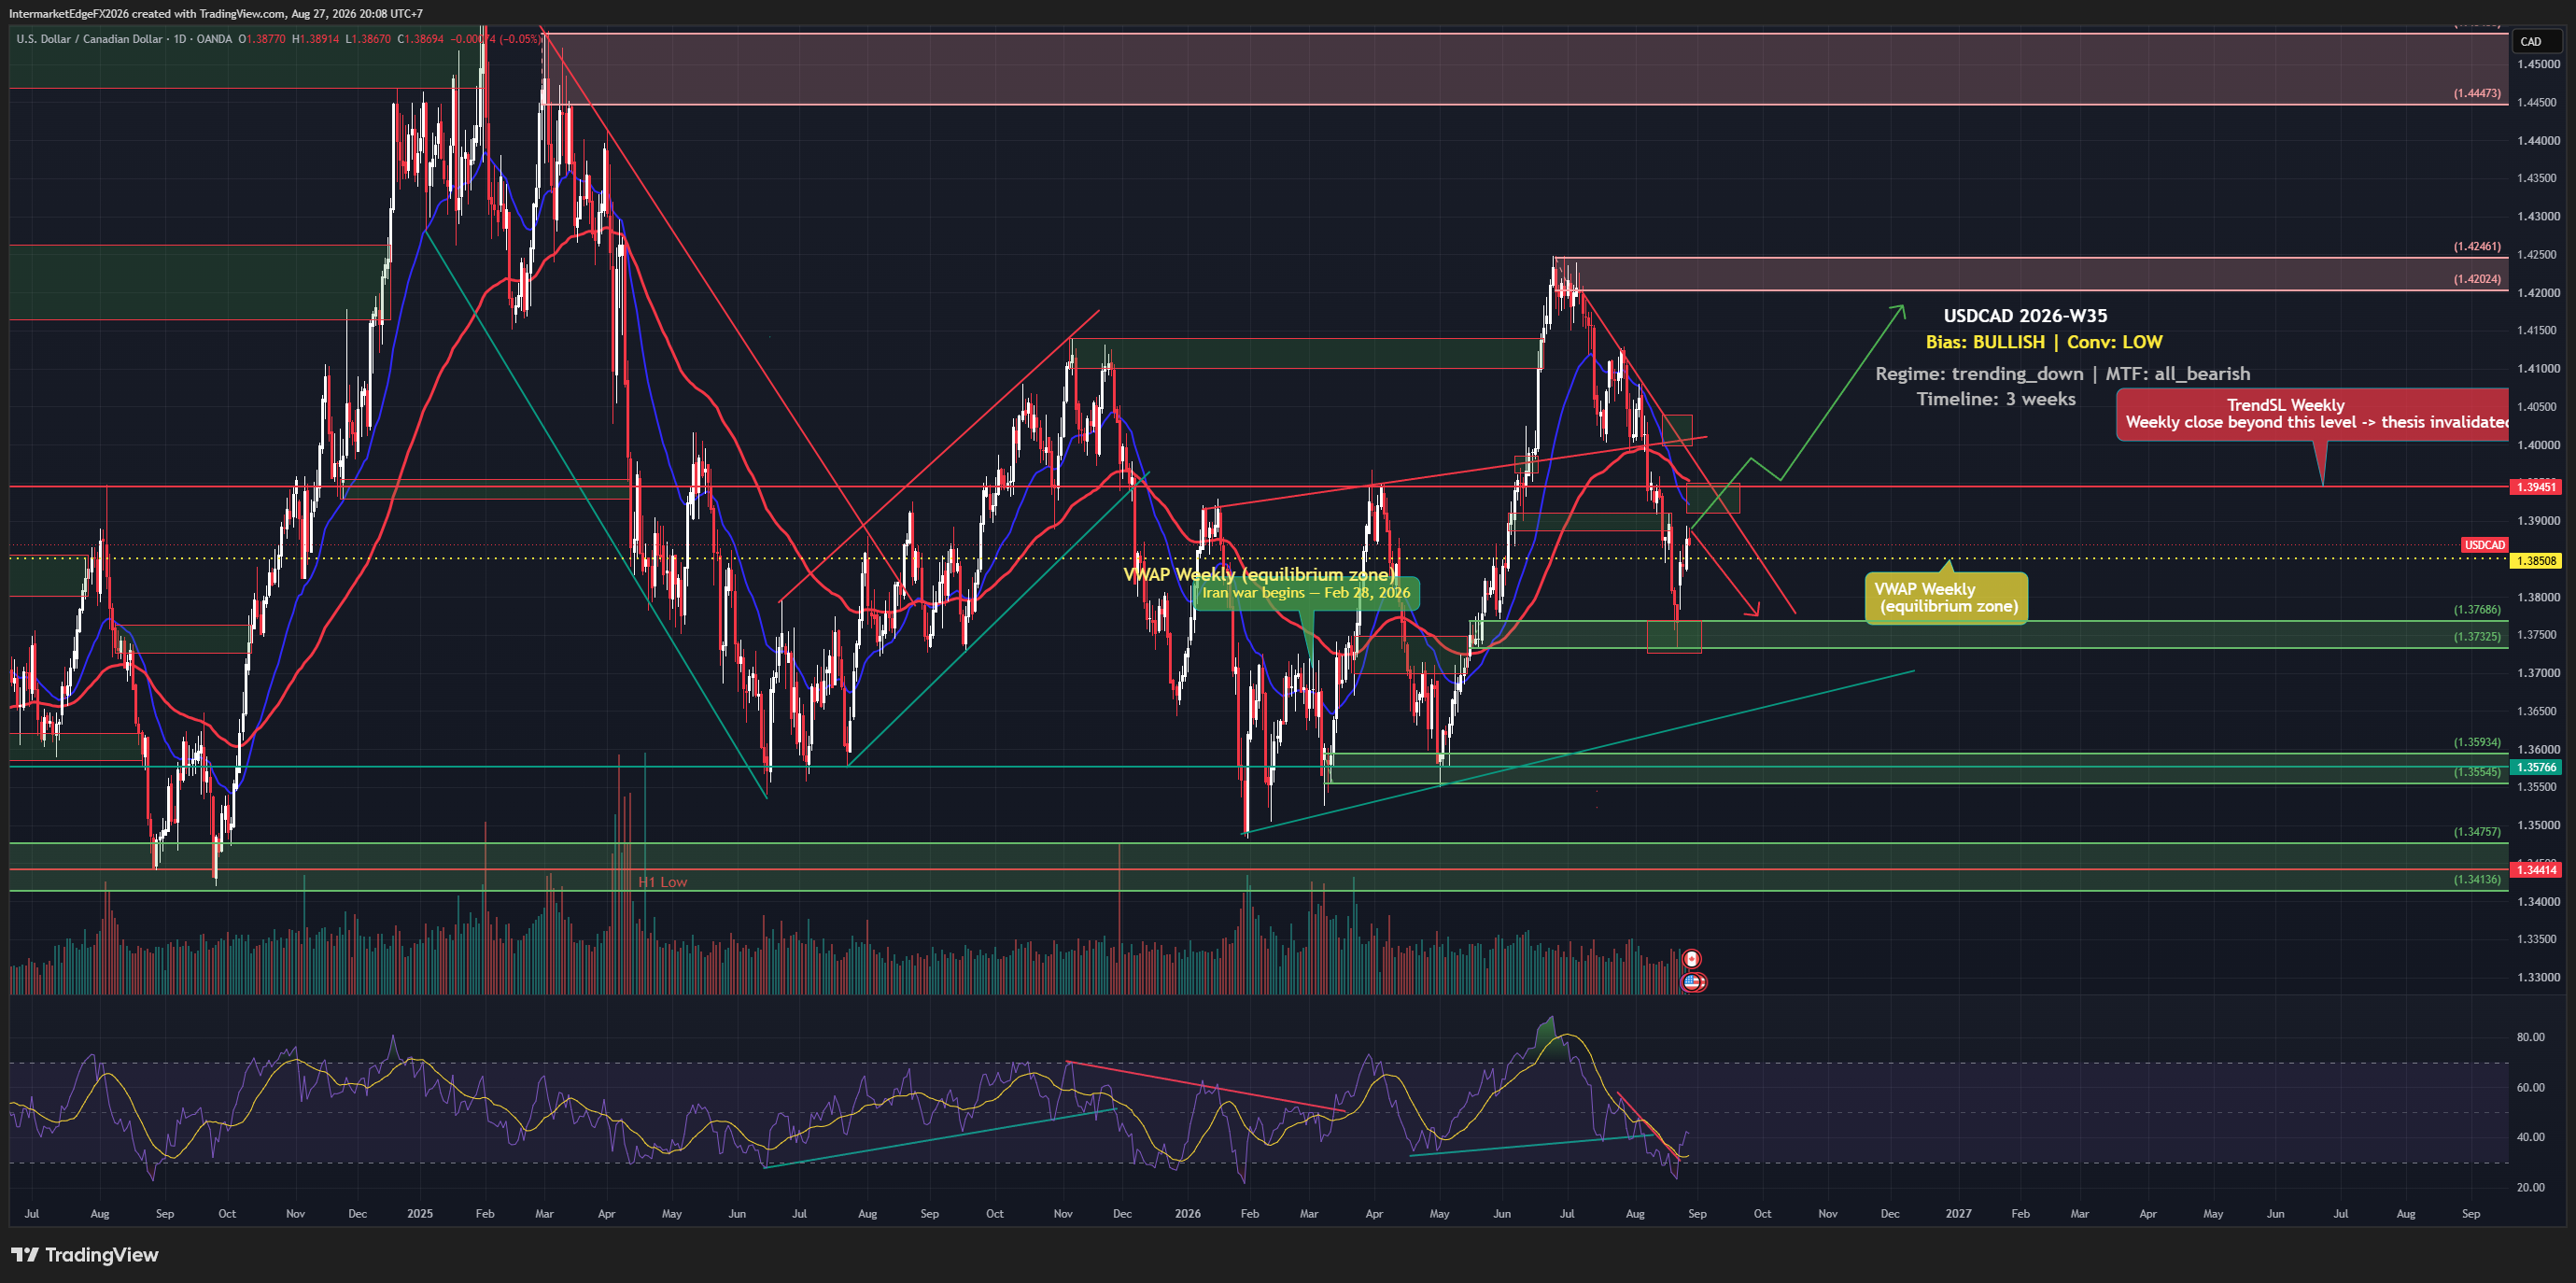
USDCAD is carrying a bullish bias into the final stretch of August 2026, but the pair is trading nearly 63 pips below the weekly TrendSL of 1.39451 as of Thursday, 27 August, meaning the technical structure does not yet support the label it has been given. The Canadian dollar hit a one-week low as a revived trade dispute rekindled economic worries, yet retaliatory tariffs from Canada quickly clawed some of that move back. That push-pull dynamic is precisely the kind of environment where calling a direction early is far easier than timing it correctly. The bullish thesis on USDCAD rests on a causal chain that begins at the Fed: sustained hawkishness has pushed US real yields to 2.32%, which supports dollar demand globally and feeds directly into USDCAD through the rate differential with the Bank of Canada. COT positioning data adds a secondary layer of confirmation, with commercial and speculative data skewing toward USD strength, though the brief does not specify the report week, net-position figure, or sample window, so this should be read as directional corroboration rather than a standalone signal. Macro and positioning therefore rhyme. What they do not resolve is the technical picture. This is where the thesis becomes genuinely complicated. At the time of writing, price at 1.38829 is already below the TrendSL weekly of 1.39451, and that condition was true from the moment the thesis was generated, not something that developed afterward. A bullish bias with price testing from underneath a declining trend stop-loss line is a structural contradiction: the same framework that produces the bullish label is simultaneously flagging that the technical evidence does not support it yet. The conviction level is accordingly low, and that is not a minor disclaimer, it is the honest read of a setup where macro and price structure are pointing in opposite directions. -- Intermarket Edge

USOIL Week W35-2026: Three Straight Sessions of Losses as Hormuz Reopening Hopes Pull the Rug on Supply-Risk Bulls

USOIL Week W35-2026: Three Straight Sessions of Losses as Hormuz Reopening Hopes Pull the Rug on Supply-Risk Bulls

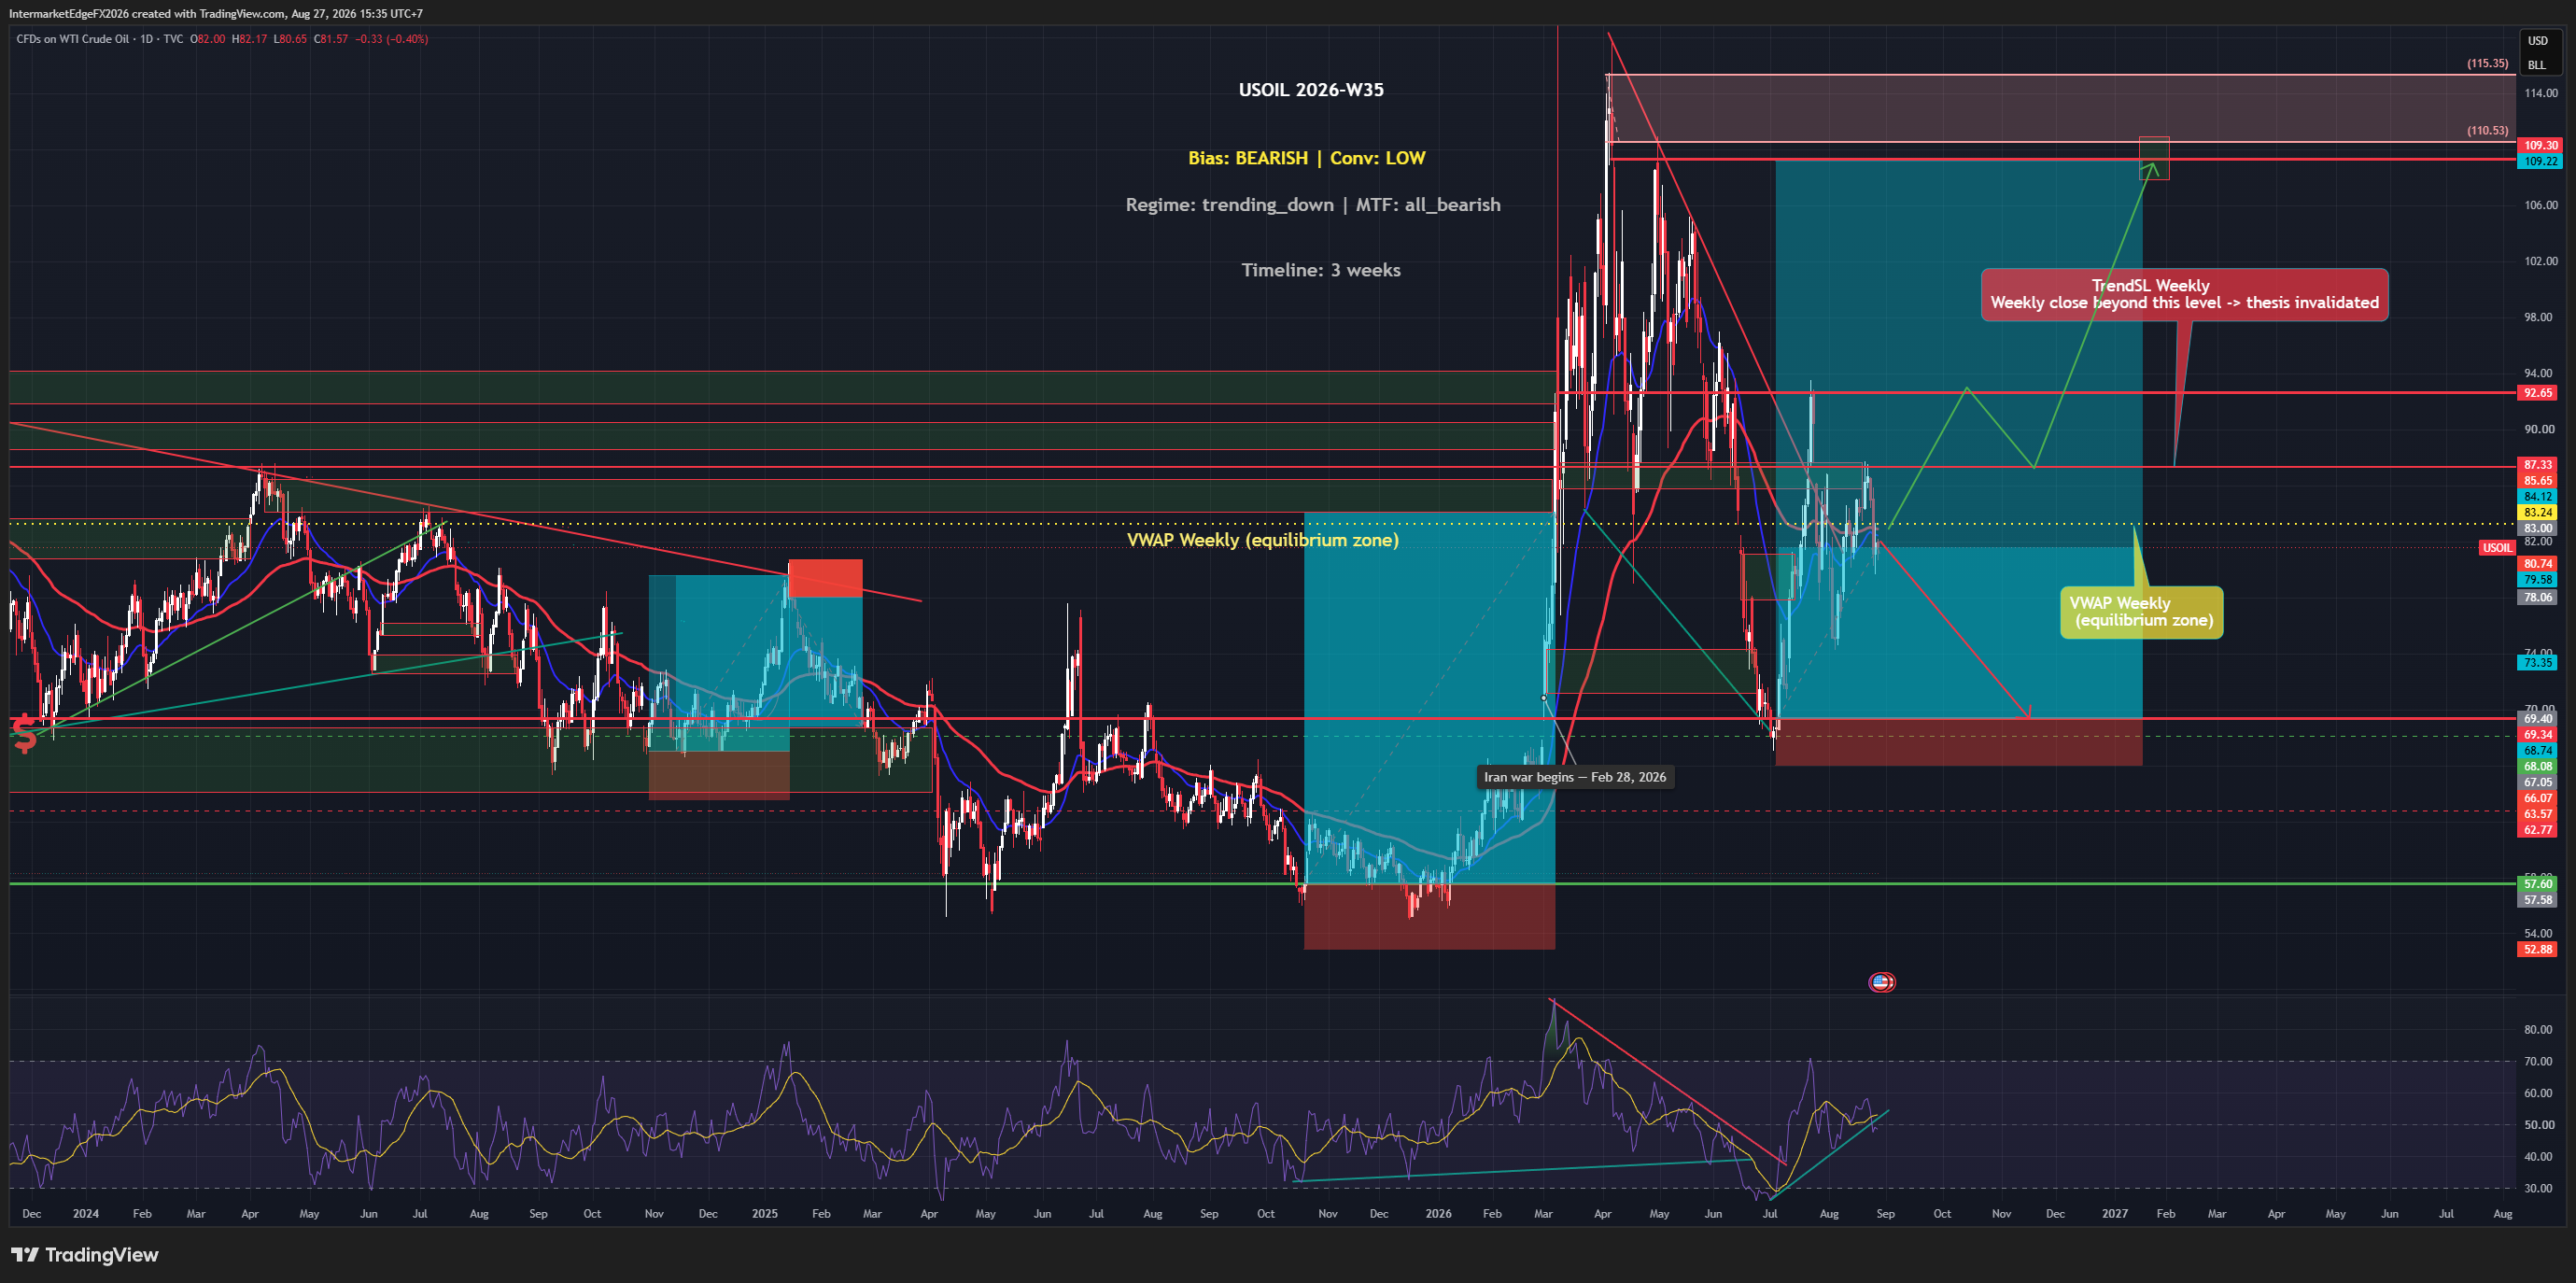
Crude oil has extended losses into a third consecutive session, with price trading at 82.49 as of Thursday 27 August, sitting below the weekly VWAP of 83.24. The headline driver this week is improved odds of the Strait of Hormuz reopening, a geopolitical shift that removes a key supply-risk premium that had been quietly supporting prices. When a fear-driven premium exits, the underlying supply picture takes over, and right now that picture shows four straight weeks of inventory builds averaging above 1.5 million barrels. The directional lean this week is bearish, though with low conviction, and that qualification matters more than the direction itself. What makes this setup structurally unusual is that the individual signals are not aligned behind the bearish view. Price action shows a technical reading that leans bullish, and COT positioning, the commitments of traders report, which tracks the aggregate stance of large speculators and commercial hedgers, also sits on the bullish side (note: the brief does not specify the exact report week, release date, or net-position figures, so this should be read as directional evidence rather than a precise citable statistic). Yet despite both of those inputs pointing higher, the macro causal chain overrides them in the aggregated framework. Fed hawkishness is driving real yields upward, which supports the dollar and creates quote-side pressure on oil. Four consecutive inventory builds confirm that physical supply is not tightening. The TGA refill adds a liquidity-drain headwind that touches all risk assets. The Hormuz reopening story is the newest entrant: improved odds of the strait remaining open mean the geopolitical risk premium, the extra dollars priced in because of potential supply disruption, is being unwound. That unwind is not a collapse, but it removes a support that was never about fundamentals to begin with. -- Intermarket Edge

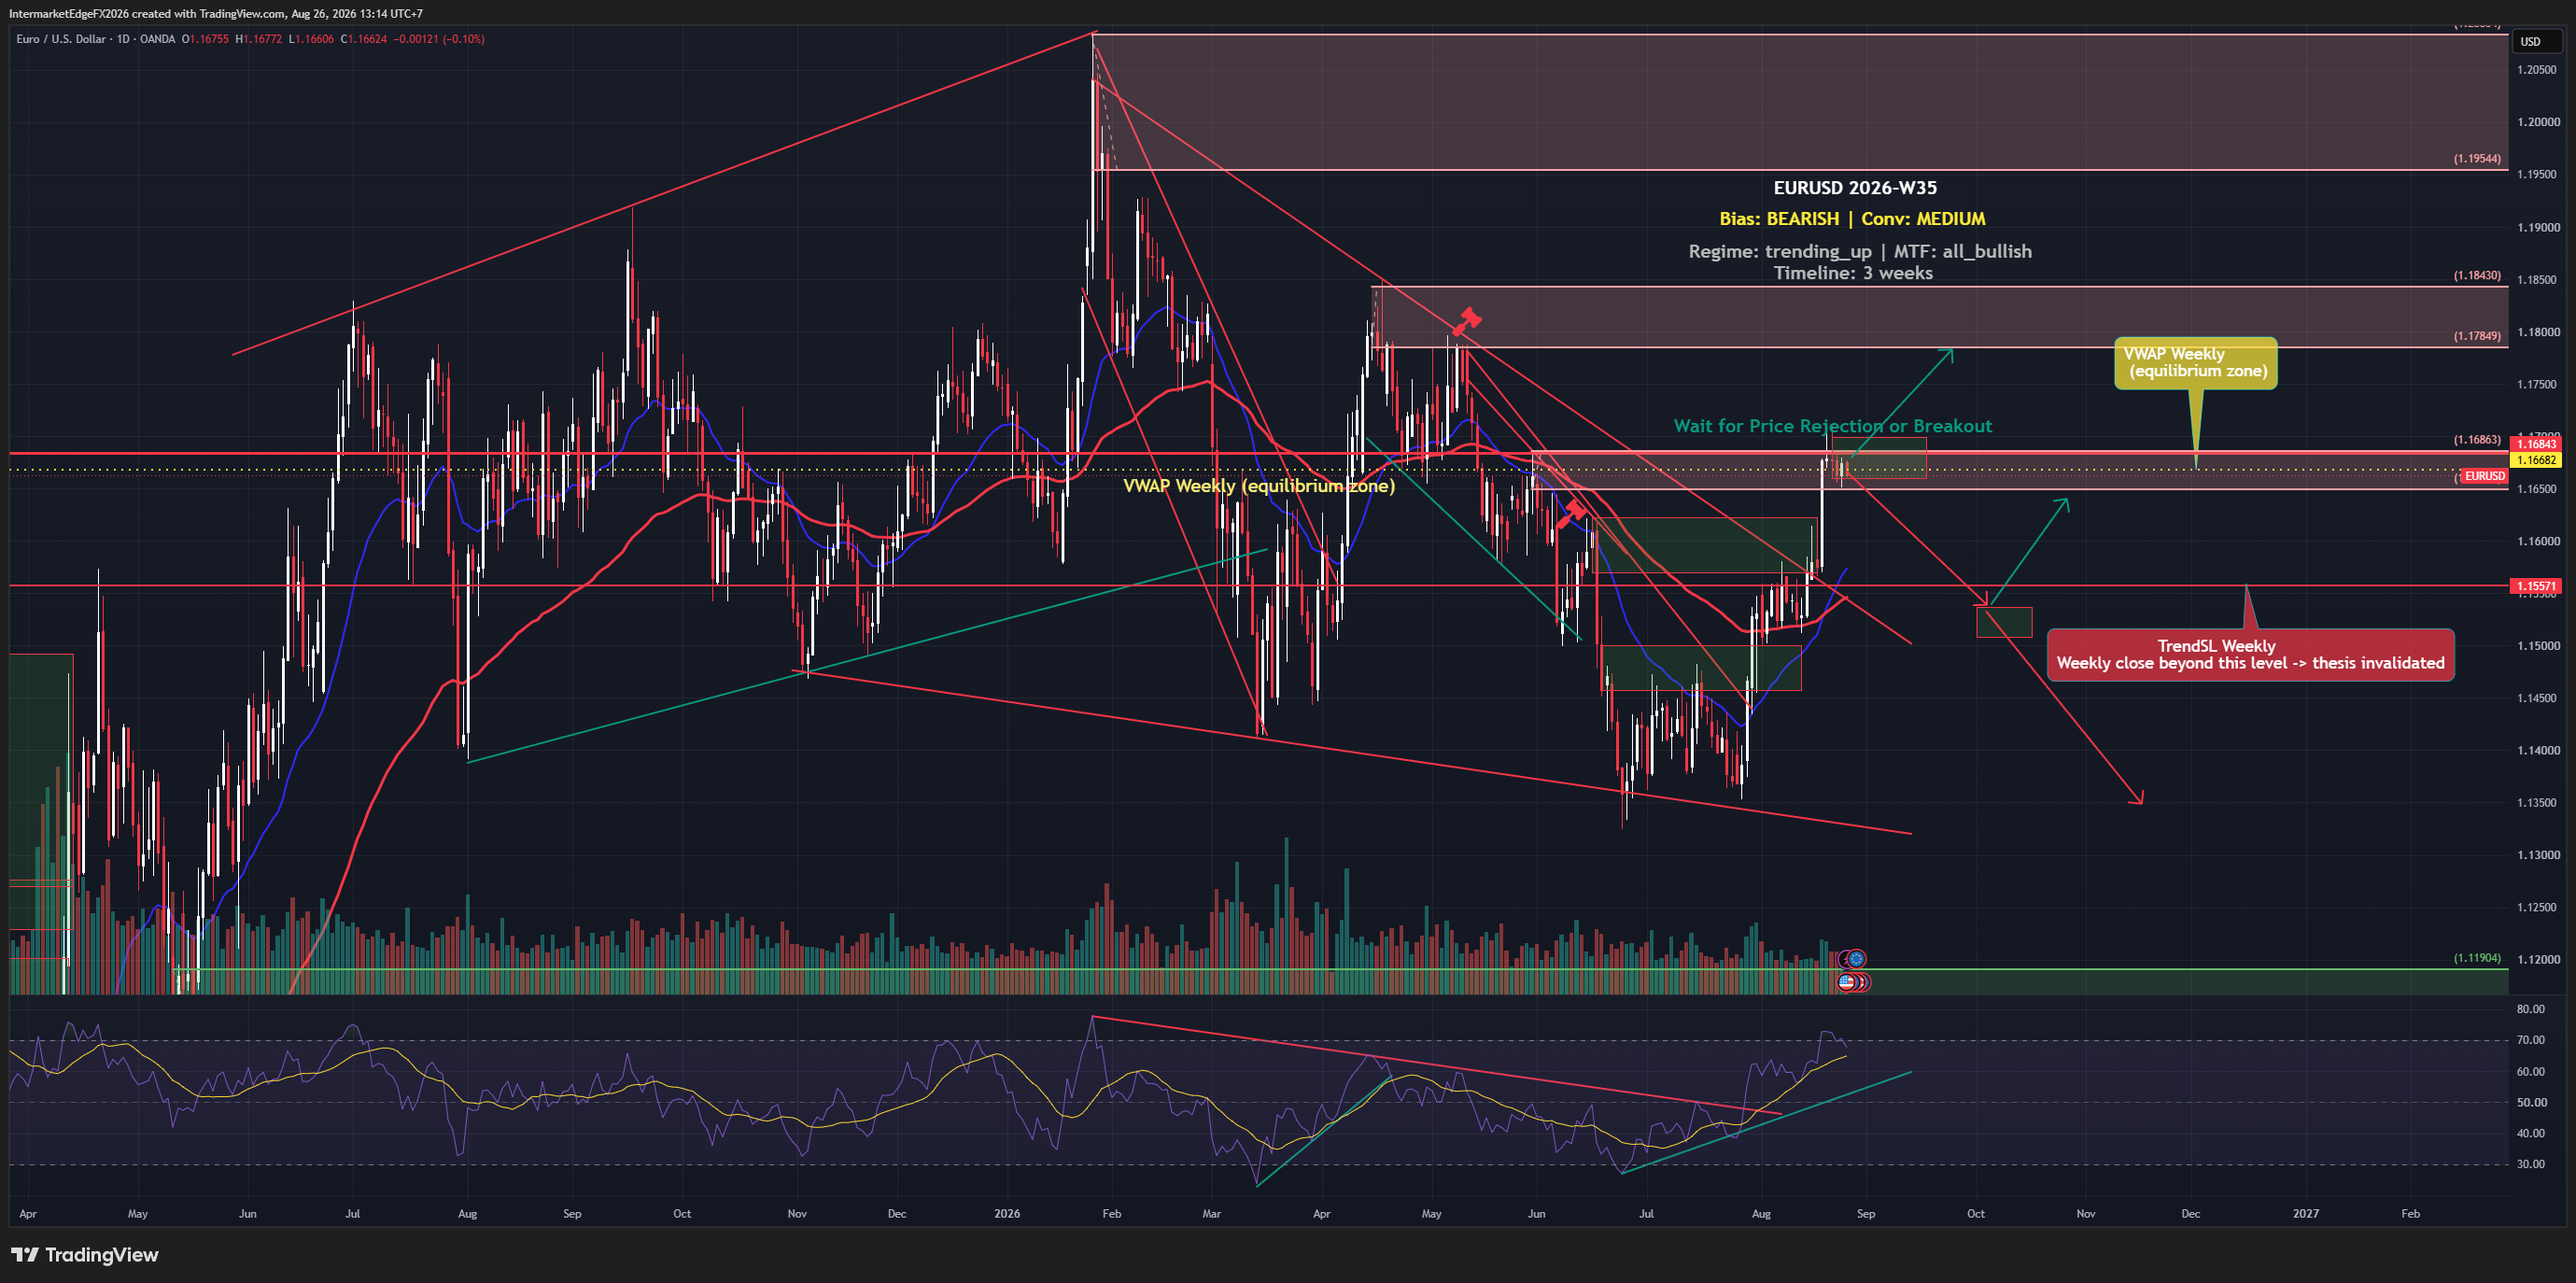
EURUSD Week W35-2026: Inflation Expectations Hit 5.8% While Price Tests VWAP From Underneath, Macro and Charts Tell Opposite Stories

EURUSD Week W35-2026: Inflation Expectations Hit 5.8% While Price Tests VWAP From Underneath, Macro and Charts Tell Opposite Stories

EURUSD is trading at 1.16676 as of Wednesday, 26 August 2026, pressing from underneath the weekly VWAP at 1.16682, a gap so thin it is nearly invisible on a chart, yet technically meaningful. US consumer inflation expectations jumped to 5.8% in August, and Fed's Collins has signaled tightening may be appropriate soon. The macro case for USD strength is building. The problem: every technical timeframe from daily to monthly is still pointed higher on the euro, putting macro and price structure in direct conflict. The framework carries a bearish bias on EURUSD over a roughly three-week horizon, driven primarily by the ECB-versus-Fed rate differential and the structural direction of the US dollar. Rate differential, the gap between what you earn holding dollars versus euros, is the single heaviest causal weight here, and with real yields in the US sitting at 2.38% while the Fed signals further tightening, that differential is pointed in the dollar's favor. The DXY, which measures the dollar against a basket of major currencies including a heavy euro weighting, carries its own bearish bias this week but without a conviction strong enough to act on, that internal tension between a macro-bullish dollar thesis and a DXY that has not yet confirmed it is one reason the overall conviction on this EURUSD view remains at medium rather than high. What keeps this from being a straightforward bearish call is the scale of the signal conflict. -- Intermarket Edge

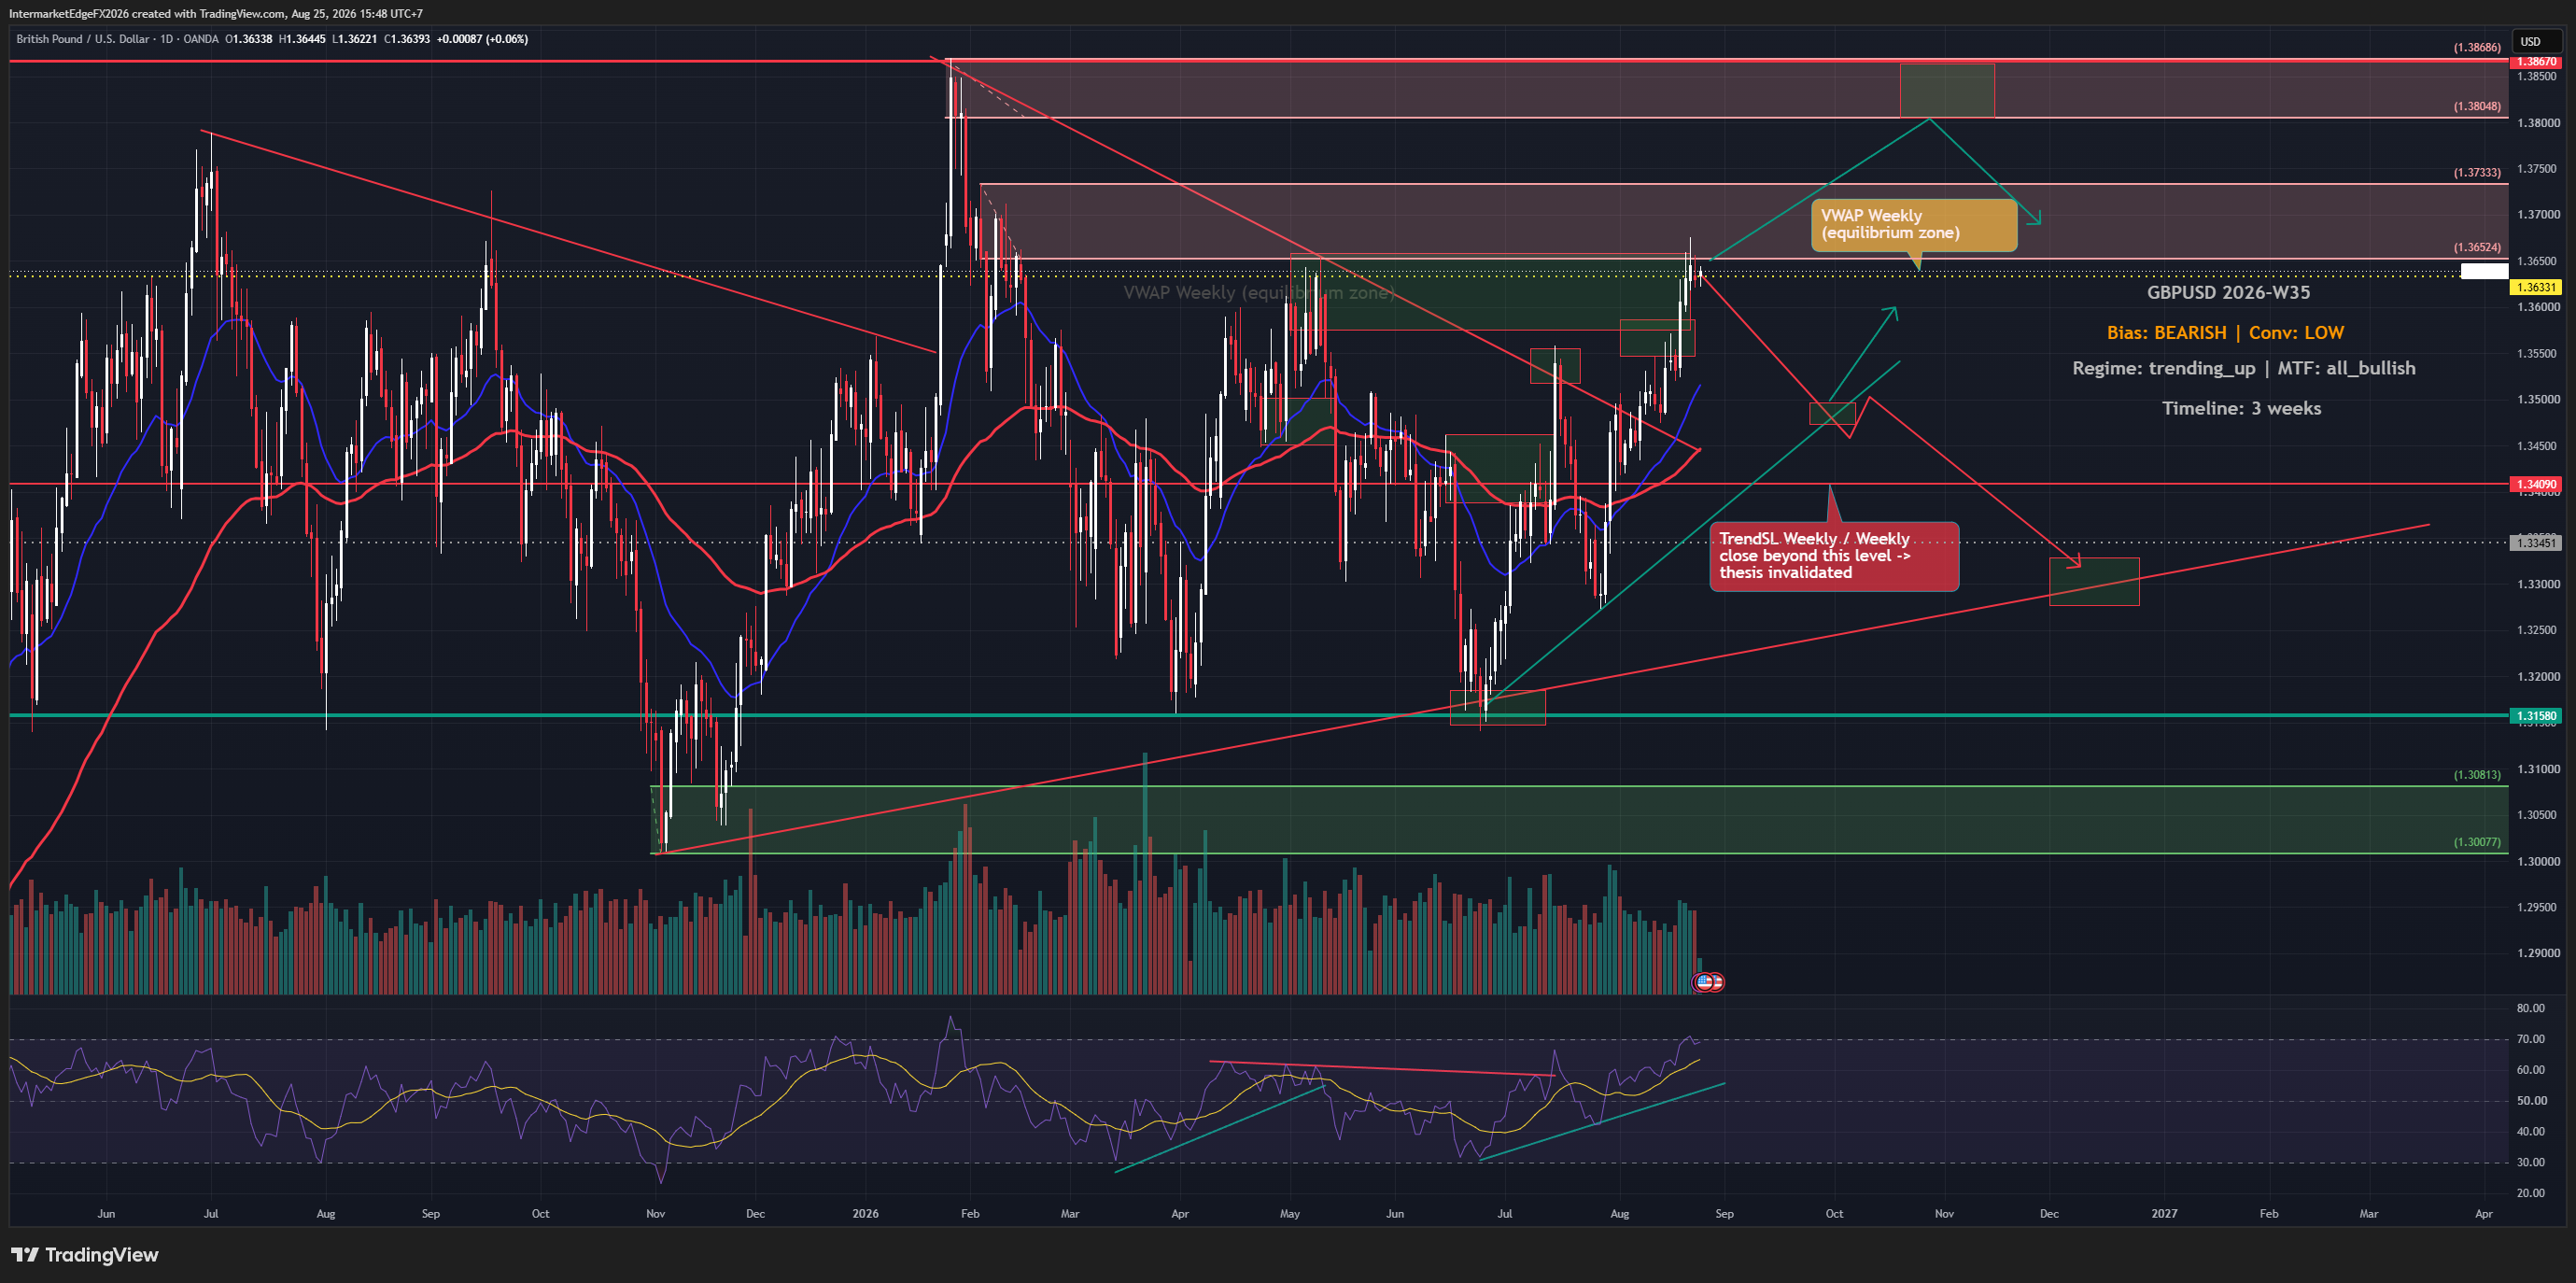
GBPUSD Week W35-2026: Sterling Pauses at Six-Month Highs as Iran Sanctions and Debt Nerves Pull in Opposite Directions

GBPUSD Week W35-2026: Sterling Pauses at Six-Month Highs as Iran Sanctions and Debt Nerves Pull in Opposite Directions

Sterling has climbed for four straight weeks, but as of Tuesday 25 August the rally has quietly stalled just beneath the weekly VWAP at 1.36331, a ceiling the market is testing from underneath. The pause is not random: speculators are already extreme long GBP according to COT data, and US real yields are sitting at 2.4%, a level that mechanically favors dollar strength. The direction everyone thinks they know may be the setup that punishes them. The framework carries a bearish bias on GBPUSD this week, but the conviction behind that call is deliberately low, and understanding why matters more than the label itself. The bearish case rests on two pillars: macro and positioning. On the macro side, Fed hawkishness combined with a 2.4% real yield creates conditions where the dollar should attract flows regardless of what the BOE does, because the USD is offering inflation-adjusted return that sterling cannot easily match. On the positioning side, COT data, which tracks the net futures positioning of speculative accounts, used here as a directional sentiment gauge rather than a standalone citable statistic since the specific report week and net-position figures are not available in this brief, shows speculators are already extremely long GBP. The practical implication of crowding risk, meaning positioning so concentrated on one side that the market runs out of new buyers, is that any negative catalyst does not just stop the rally: it triggers a cascade of exits from the same crowded trade, accelerating the move lower far beyond what fundamentals alone would justify. The problem is that everything else is still pointing up. Price action scores bullishly, the multi-timeframe alignment is entirely bullish, and the macro backdrop for sterling, firm rate-hike bets, subdued dollar, has not broken down. -- Intermarket Edge

Stay in the loop

Get notified about new research, macro insights, and market analysis.

InterMarketEdge

© 2026 InterMarketEdge. Financial intelligence for inter-market traders.