Articles — InterMarketEdge

Articles

Financial intelligence, macro research, and inter-market analysis.

DXY — Iran Strikes Israel, Warsh Declares Independence, and the Deal Decompression Narrative Is Dead

DXY — Iran Strikes Israel, Warsh Declares Independence, and the Deal Decompression Narrative Is Dead

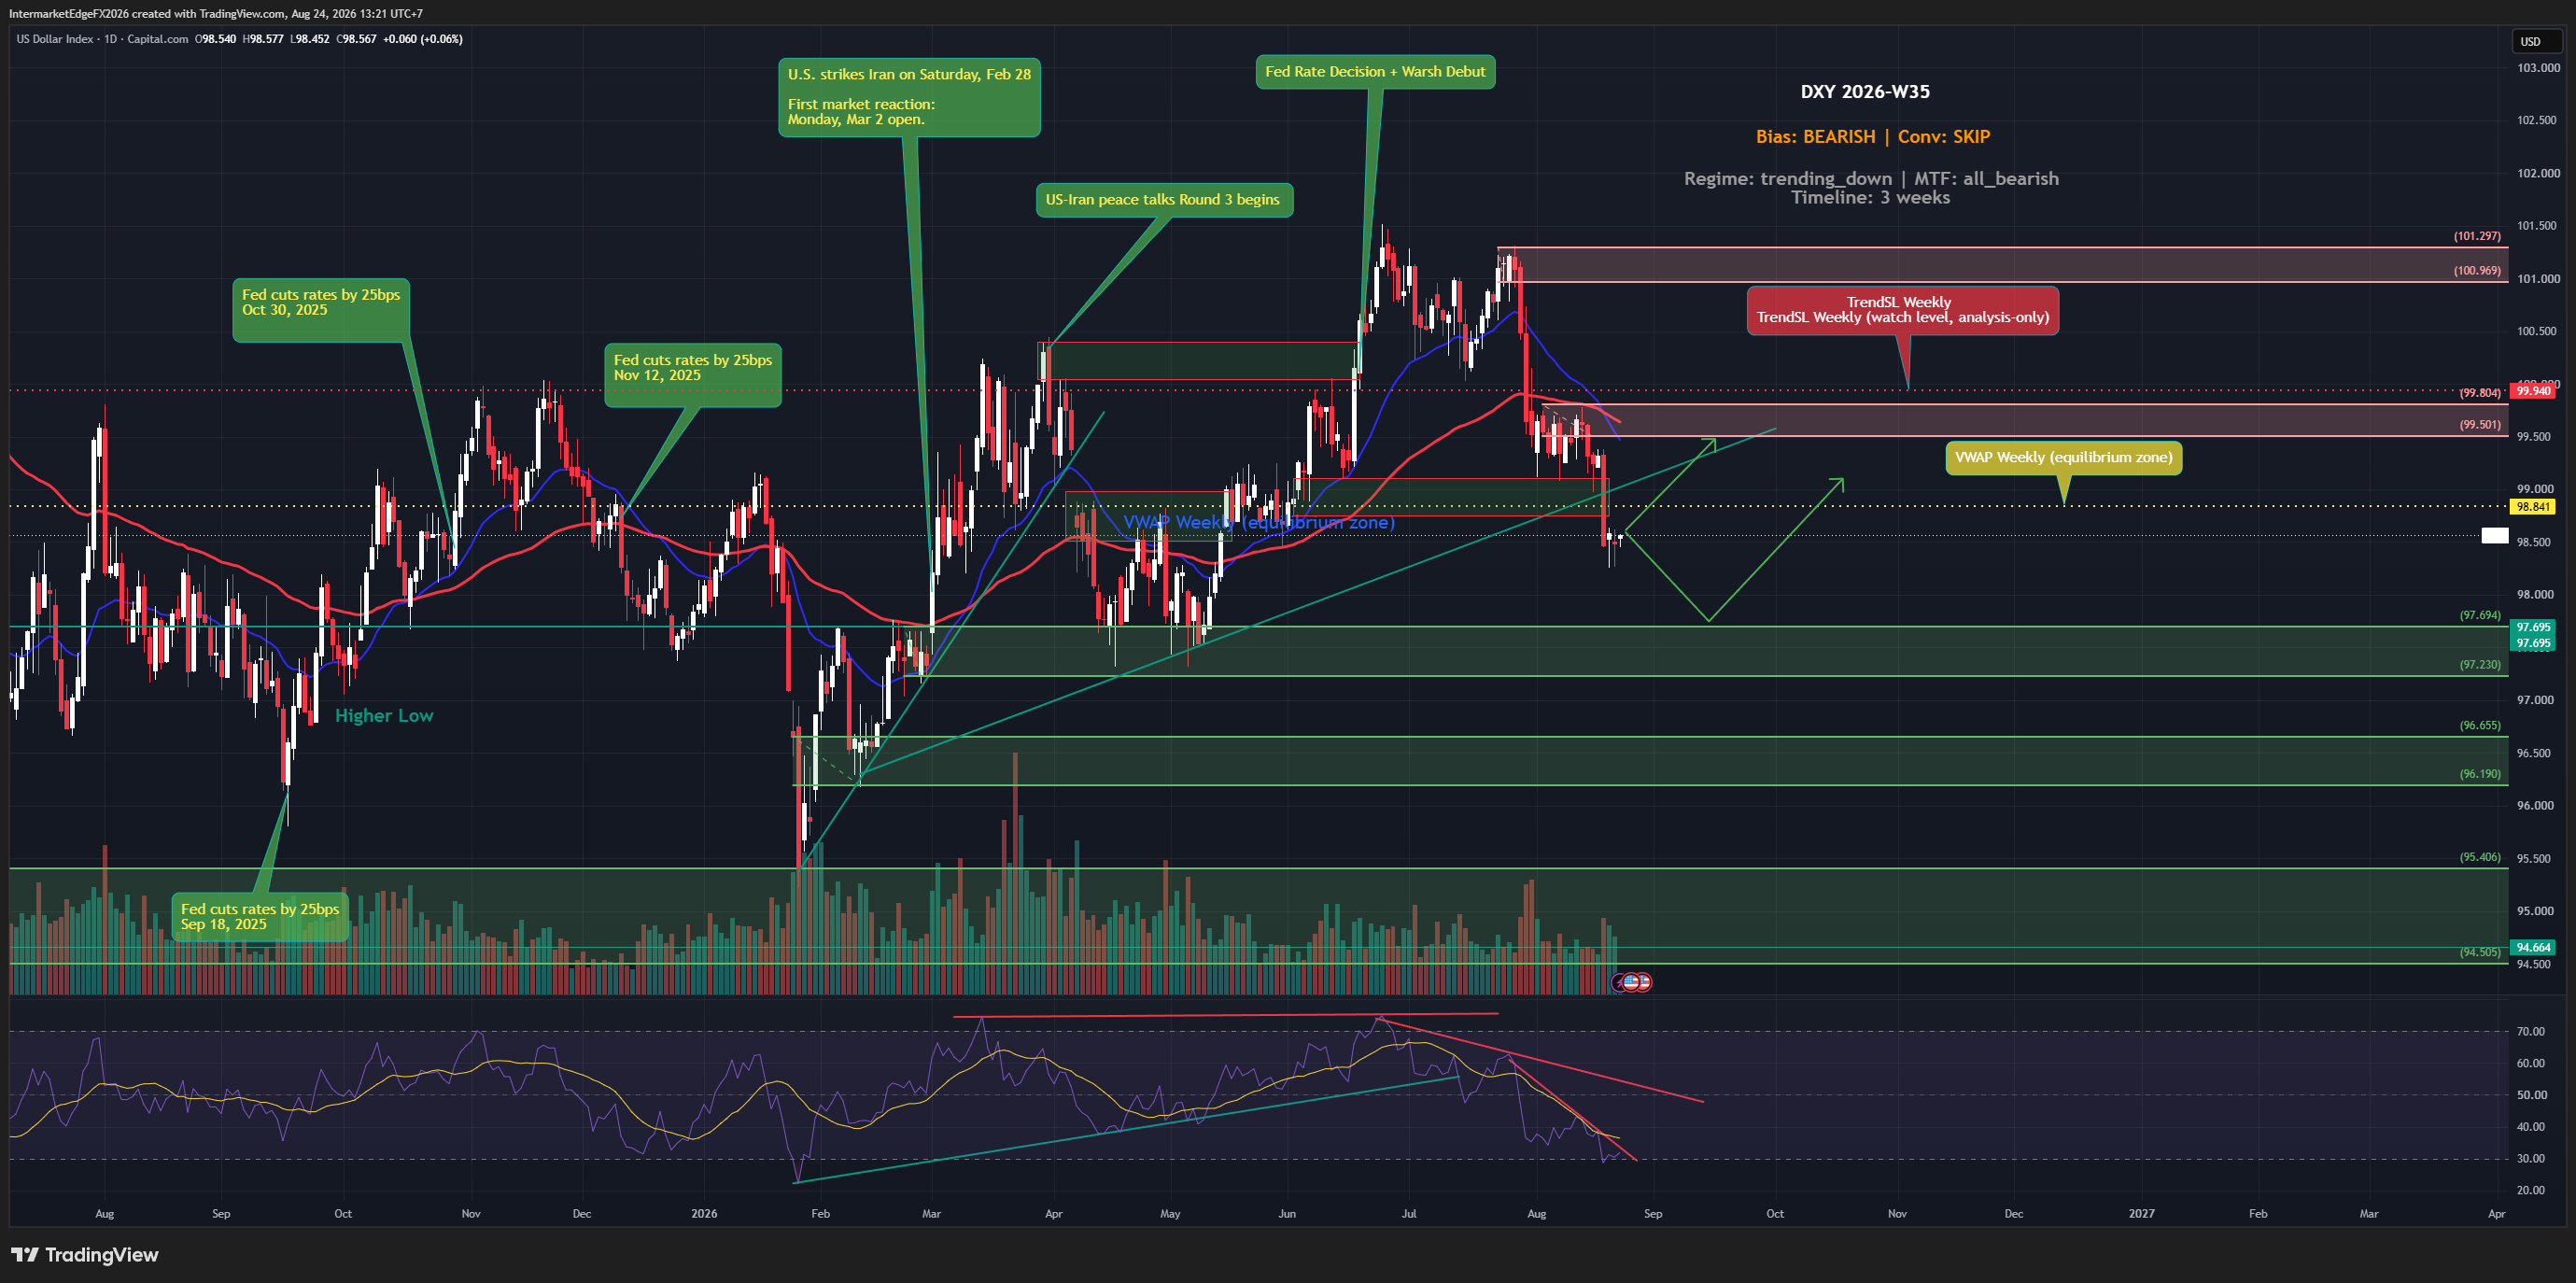
DXY 99.971 | VIX 21.57 | 08 June 2026 The deal decompression narrative is dead. Three weeks of DXY Medium Bear analysis has been overridden in a single weekend. On Sunday night, Iran launched multiple barrages of ballistic missiles toward Israel — the first bombardment since the fragile April 8 ceasefire. Israel struck back on Monday with airstrikes on central and western Iran, while a US military base in Saudi Arabia came under fire in the most serious exchange of hostilities since the ceasefire. Brent has rebounded from $91.69 to $96.99. VIX has spiked from 15.73 to 21.57. S&P 500 is down 200 points. DXY is surging toward the 100.40 invalidation level that, if closed above on a daily basis, formally terminates the Medium Bear framework. Yahoo FinanceMarketPulse The second driver is Warsh. At his Senate confirmation hearing, the new Fed chair framed political pressure as a "test of independence rather than a threat" and committed the Fed to operating on "best assessment of what will serve the public rather than the preferences of the president." EY-Parthenon chief economist notes the June 16-17 FOMC "could acknowledge it may have to hike rates if inflation remains above the 2% target." With May NFP beating at an estimated 130-160K and oil re-accelerating on Iran-Israel, the hike probability has moved from tail to meaningful base case. Investing.com Real yield corrected: 0.736%. Still below 1% structural threshold — but the tactical safe-haven bid and inflation re-acceleration are overriding it. Invalidation of bear count: daily close above 100.40. Bull targets if invalidation: 101.00 → 101.50. Bear survives if: Iran-Israel de-escalates within 48-72 hours. Warsh FOMC June 16-17 is the gating event. Conviction: Medium-High Bull.

USDCAD — Canadian Dollar at Eight-Week Low, BoC Holds June 10, Oil Slides, and USMCA Risk Keeps the Loonie Trapped

USDCAD — Canadian Dollar at Eight-Week Low, BoC Holds June 10, Oil Slides, and USMCA Risk Keeps the Loonie Trapped

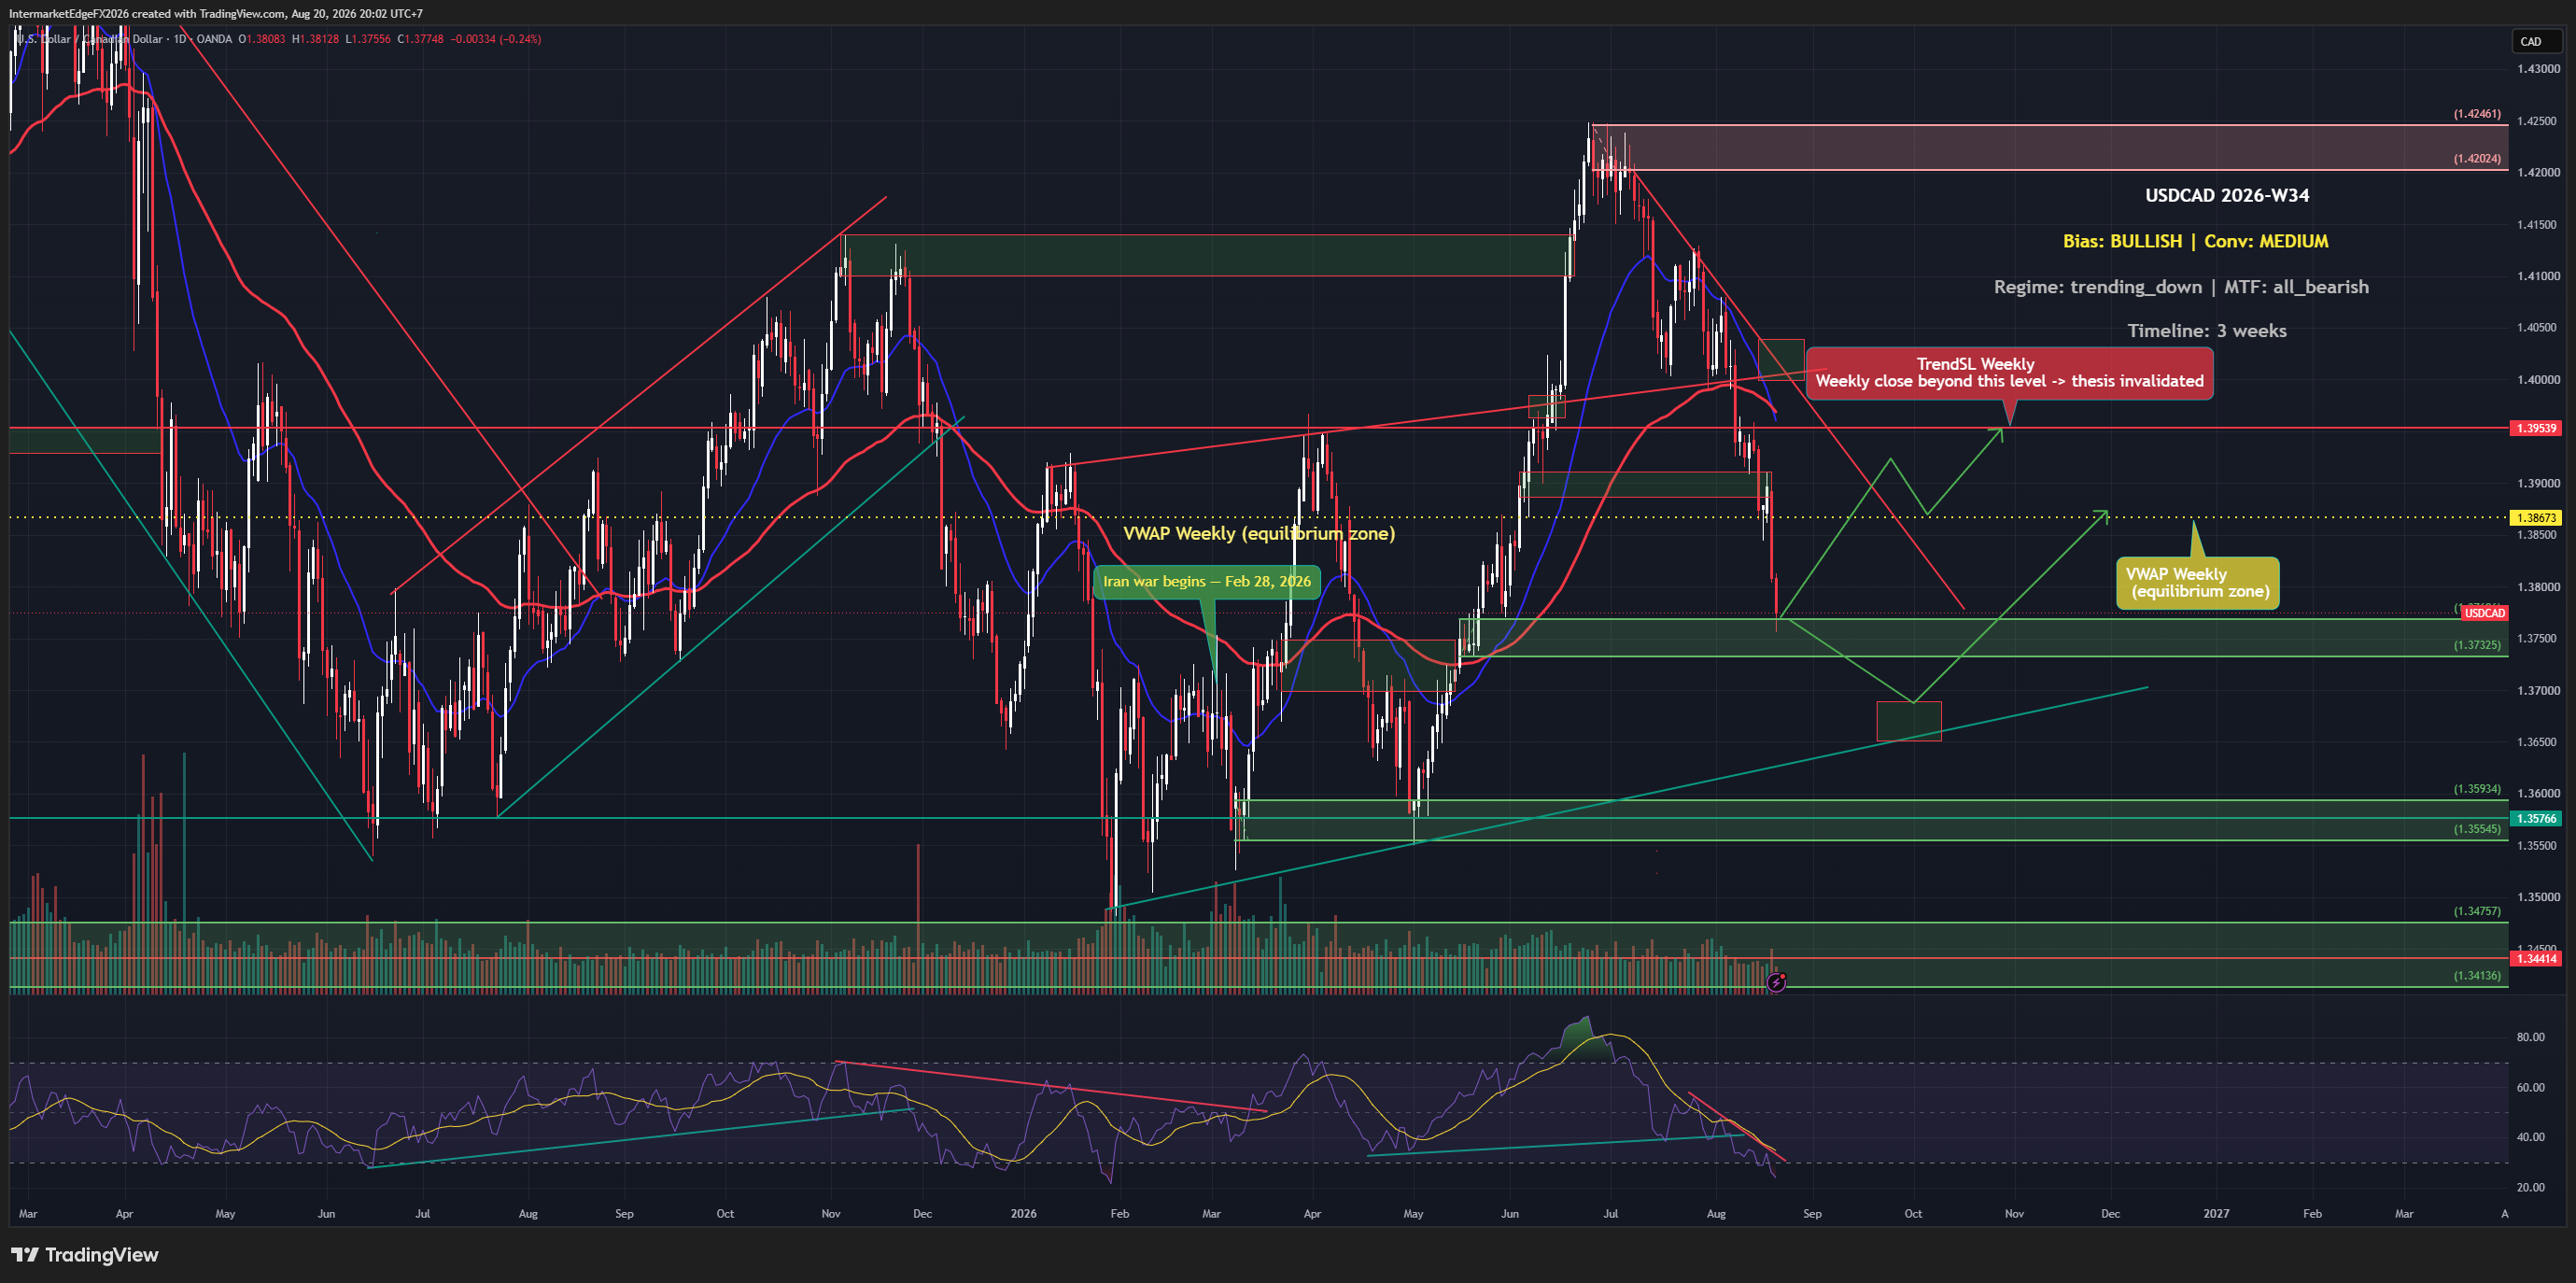
USDCAD 1.3893 | Canadian Dollar 8-week low | 04 June 2026 The Canadian dollar is at its weakest in eight weeks, and three forces are keeping it there simultaneously. First, oil. WTI has declined from $95.33 this morning to $92.61 — a $2.72 drop in a single session on Iran deal optimism. Canada is the largest crude exporter to the US. The oil-CAD channel is among the most stable relationships in FX, and it is working against the loonie today. The counterintuitive implication: if the Iran deal completes and oil falls toward $80-85, CAD gets weaker, not stronger. USDCAD could test 1.4099 resistance on deal completion. Second, domestic weakness. Canada's Q1 2026 GDP contracted for a second consecutive quarter. BoC core inflation measures slowed to five-year lows. The Bank of Canada meets June 10 and is expected to hold at 3.25% — but a dovish tone acknowledging the growth weakness would push USDCAD toward 1.4000-1.4050. Third, USMCA risk. AUDCAD at 0.9920 — below the 1.000 parity level — confirms the structural CAD discount from trade uncertainty is still live. Until AUDCAD holds above 1.000, CAD carries a structural discount that cannot be removed by oil alone. On the chart, price is approaching the 1.4099-1.4139 resistance zone. A daily close above 1.4099 confirms the bull move. A daily close below 1.3593 activates wave (c) lower toward 1.3477 then 1.3400. BoC June 10 is the gating event. Conviction: Medium, Mildly Bullish.

USOIL — Sixth Consecutive Draw, Iran Fires Missiles, Lebanon Complicates the Deal, and $92 Is the Floor That Matters

USOIL — Sixth Consecutive Draw, Iran Fires Missiles, Lebanon Complicates the Deal, and $92 Is the Floor That Matters

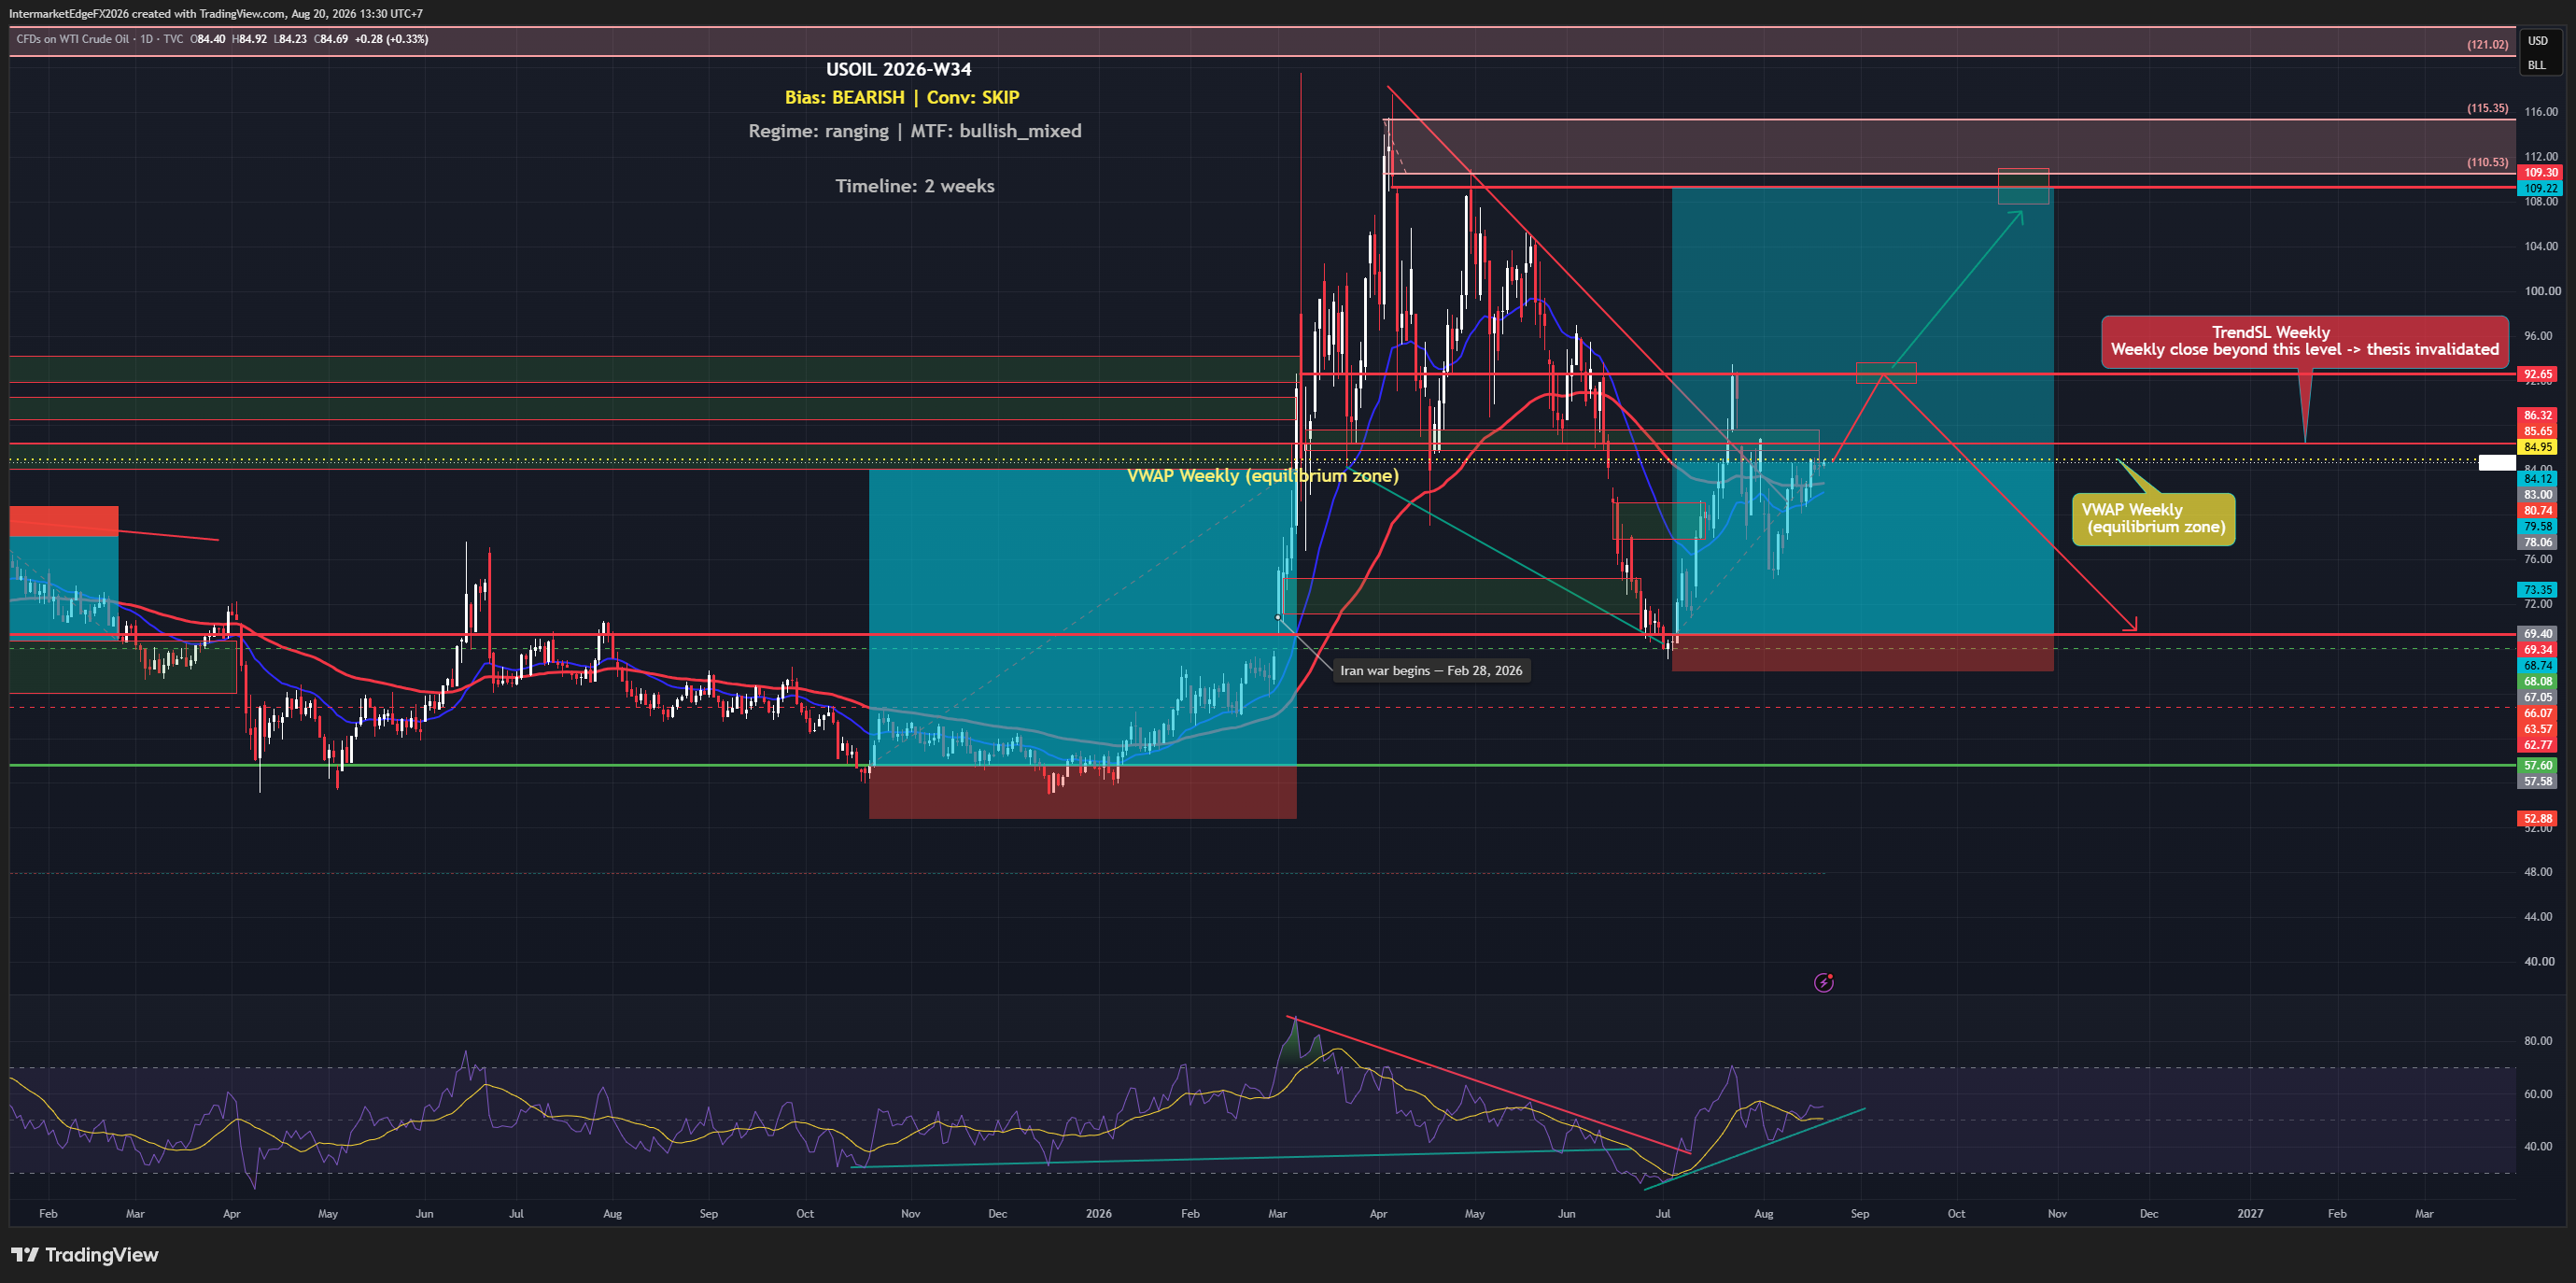
USOIL $95.33 | EIA -7.974M bbl | 04 June 2026 The most bullish EIA print of the current cycle just dropped. Six consecutive weekly draws. Distillates at a 23-year low. The supply picture is unambiguously tightening. And WTI is falling anyway. That is the paradox defining the oil market today — and understanding it is the key to positioning correctly. The EIA draw of -7.974 million barrels for the week ending May 30 was nearly three times the forecast of -2.900M. At current draw rates, US crude stockpiles approach the five-year minimum range within four to six weeks. This is the fundamental floor argument for WTI holding $90-92: the supply picture does not support a rapid decline to the bear targets of $74-71 without either a demand collapse or a full Hormuz reopening. The reason prices are falling despite this data is the Iran-Lebanon nexus. Tehran has conditioned any deal progress on a halt to Israeli operations in Lebanon. Israel has continued strikes despite Trump personally asking Netanyahu to hold back. Iran launched ballistic missiles. US forces struck Qeshm Island in retaliation. Iranian state media says message exchanges with Washington have been suspended. The deal is not dead — Trump insists talks are active — but it is in its most fragile phase since the April 8 ceasefire. The $100-102 resistance has failed twice this week. The $92-97 consolidation zone is the current equilibrium. The $88-92 floor is where supply fundamentals provide genuine structural support. Bear targets if deal completes and Hormuz reopens: $74.49 → $71.11. Invalidation: daily close above $102. Conviction: Medium, Neutral-to-Mild Bear. Timeline extended 2-4 weeks by Lebanon complication.

EURGBP — Greene Fires the Hawkish Signal, ECB Cuts Tomorrow, and the 0.8417 Target Is Back in Play

EURGBP — Greene Fires the Hawkish Signal, ECB Cuts Tomorrow, and the 0.8417 Target Is Back in Play

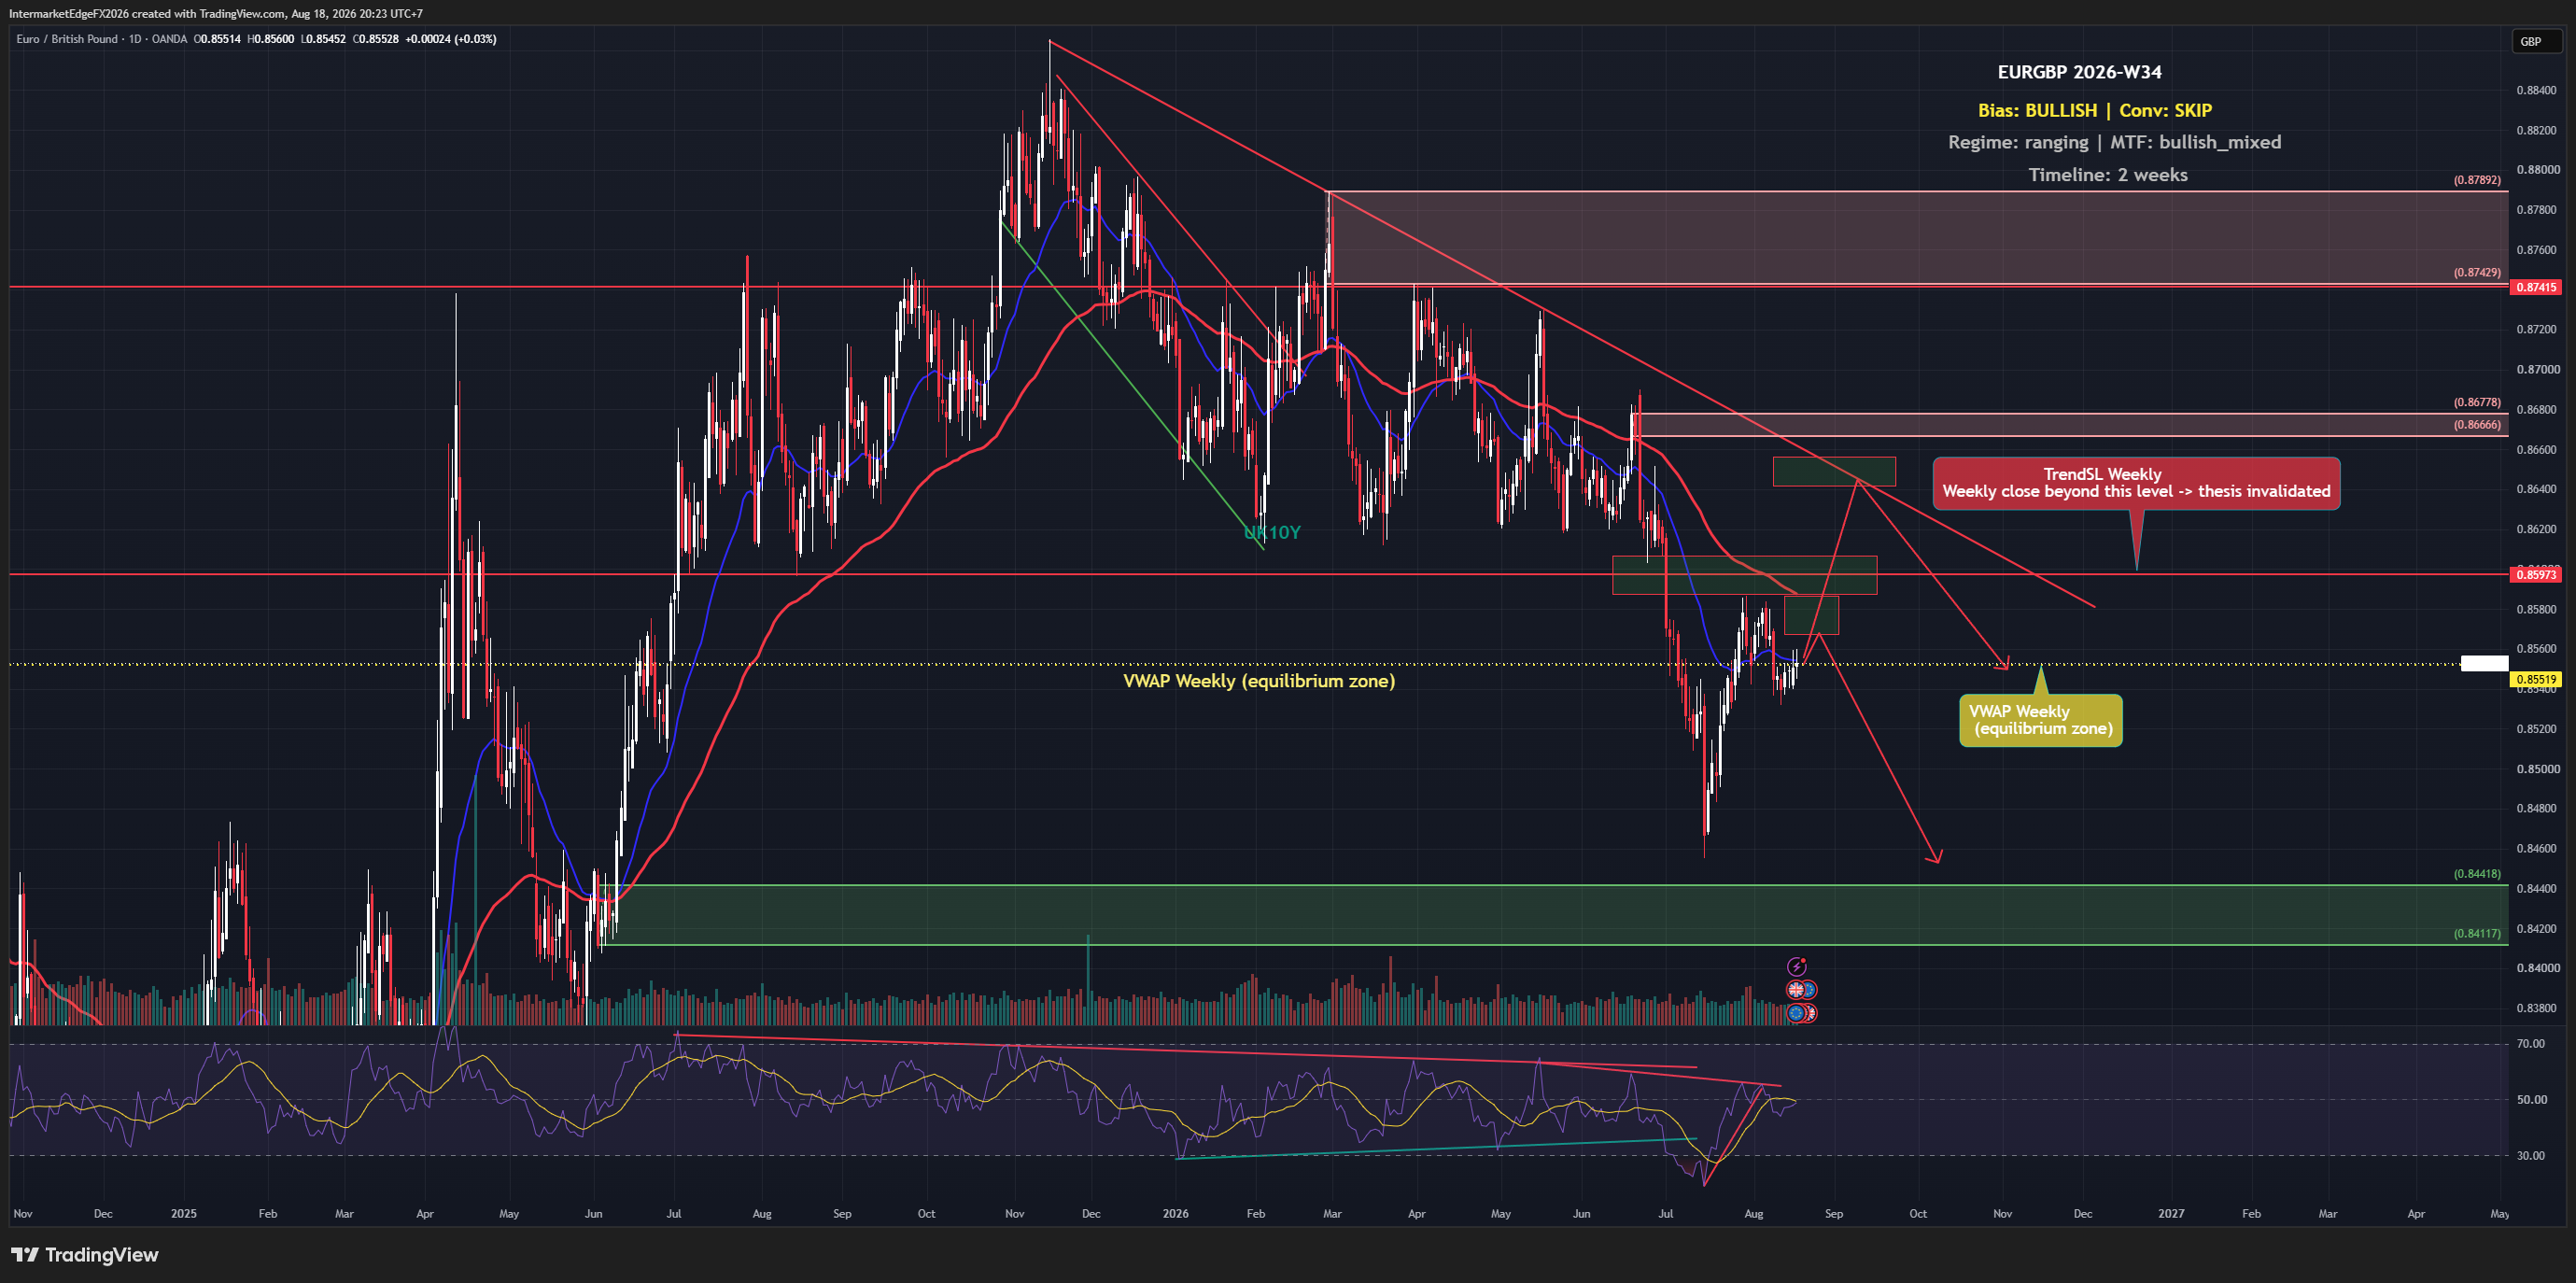
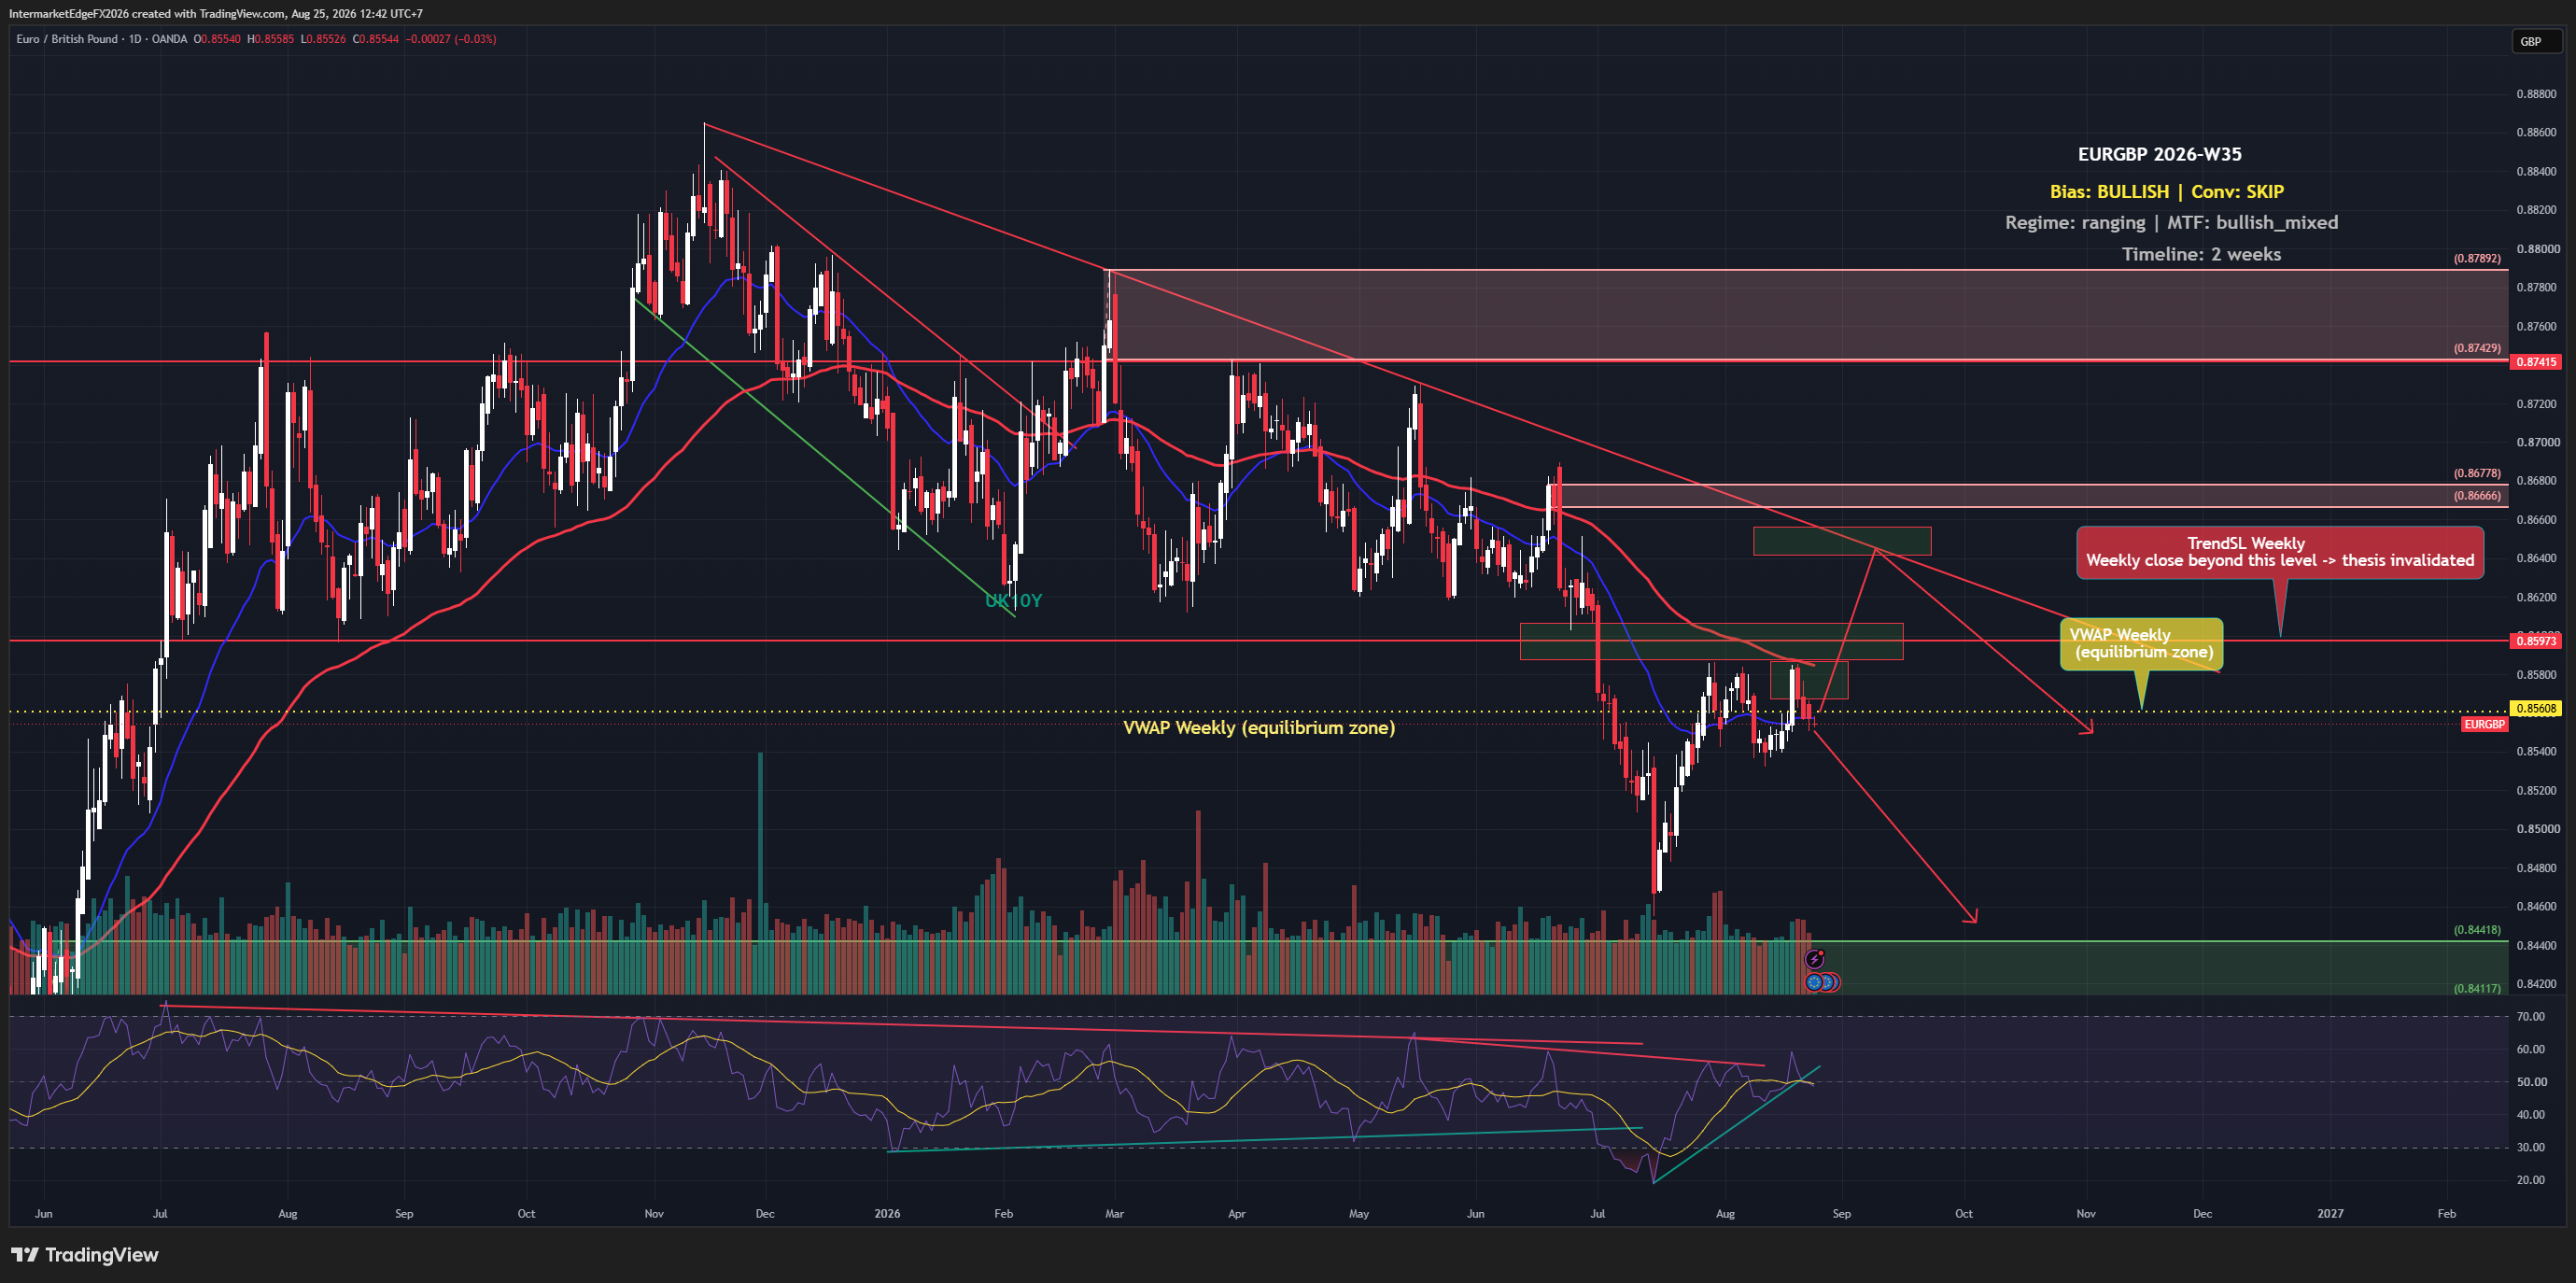
EURGBP 0.8632 | 03 June 2026 The cleanest directional setup in this week's coverage. Two events in the next eighteen hours are pointing the same direction, and the technical structure is mid-move with no exhaustion signal. BoE MPC member Megan Greene delivered a hawkish speech yesterday that materially changes the BoE narrative. She argued the case for raising UK rates has strengthened as the Iran war drags on, that acting sooner is more important than waiting for conclusive evidence, and — most critically — that without an imminent Bank Rate hike, the market yield curve tightening the BoE had been relying on would likely unwind. That is not a suggestion. That is a direct call for action. The ECB cuts tomorrow. The deposit rate moves from 2.50% to 2.25%. The ECB-BoE rate differential widens further against the euro after that cut — from 1.25% to 1.50% in sterling's favor. The oil channel is asymmetric. Brent above $100 applies inflation pressure to both economies, but the UK's energy import dependence means the passthrough is faster and more direct than in the Eurozone. Oil above $100 is Greene's entire argument for preemptive tightening. Every dollar Brent holds above $90 strengthens her case. On the chart, momentum is confirming wave (c) continuation — no divergence, no exhaustion. This is different from EURJPY where negative divergence flagged a topping process. Here the structure is mid-move. Invalidation: daily close above 0.8741. Bear trigger: daily close below 0.8600 on ECB event. Wave (c) targets: 0.84418 → 0.84117. Conviction: Medium-High Bear.

USDJPY Breaches 160 — Gulf Hostilities Boost Dollar, BoJ Intervention Clock Is Running, and the June 16 Hike Is Now 66% Priced

USDJPY Breaches 160 — Gulf Hostilities Boost Dollar, BoJ Intervention Clock Is Running, and the June 16 Hike Is Now 66% Priced

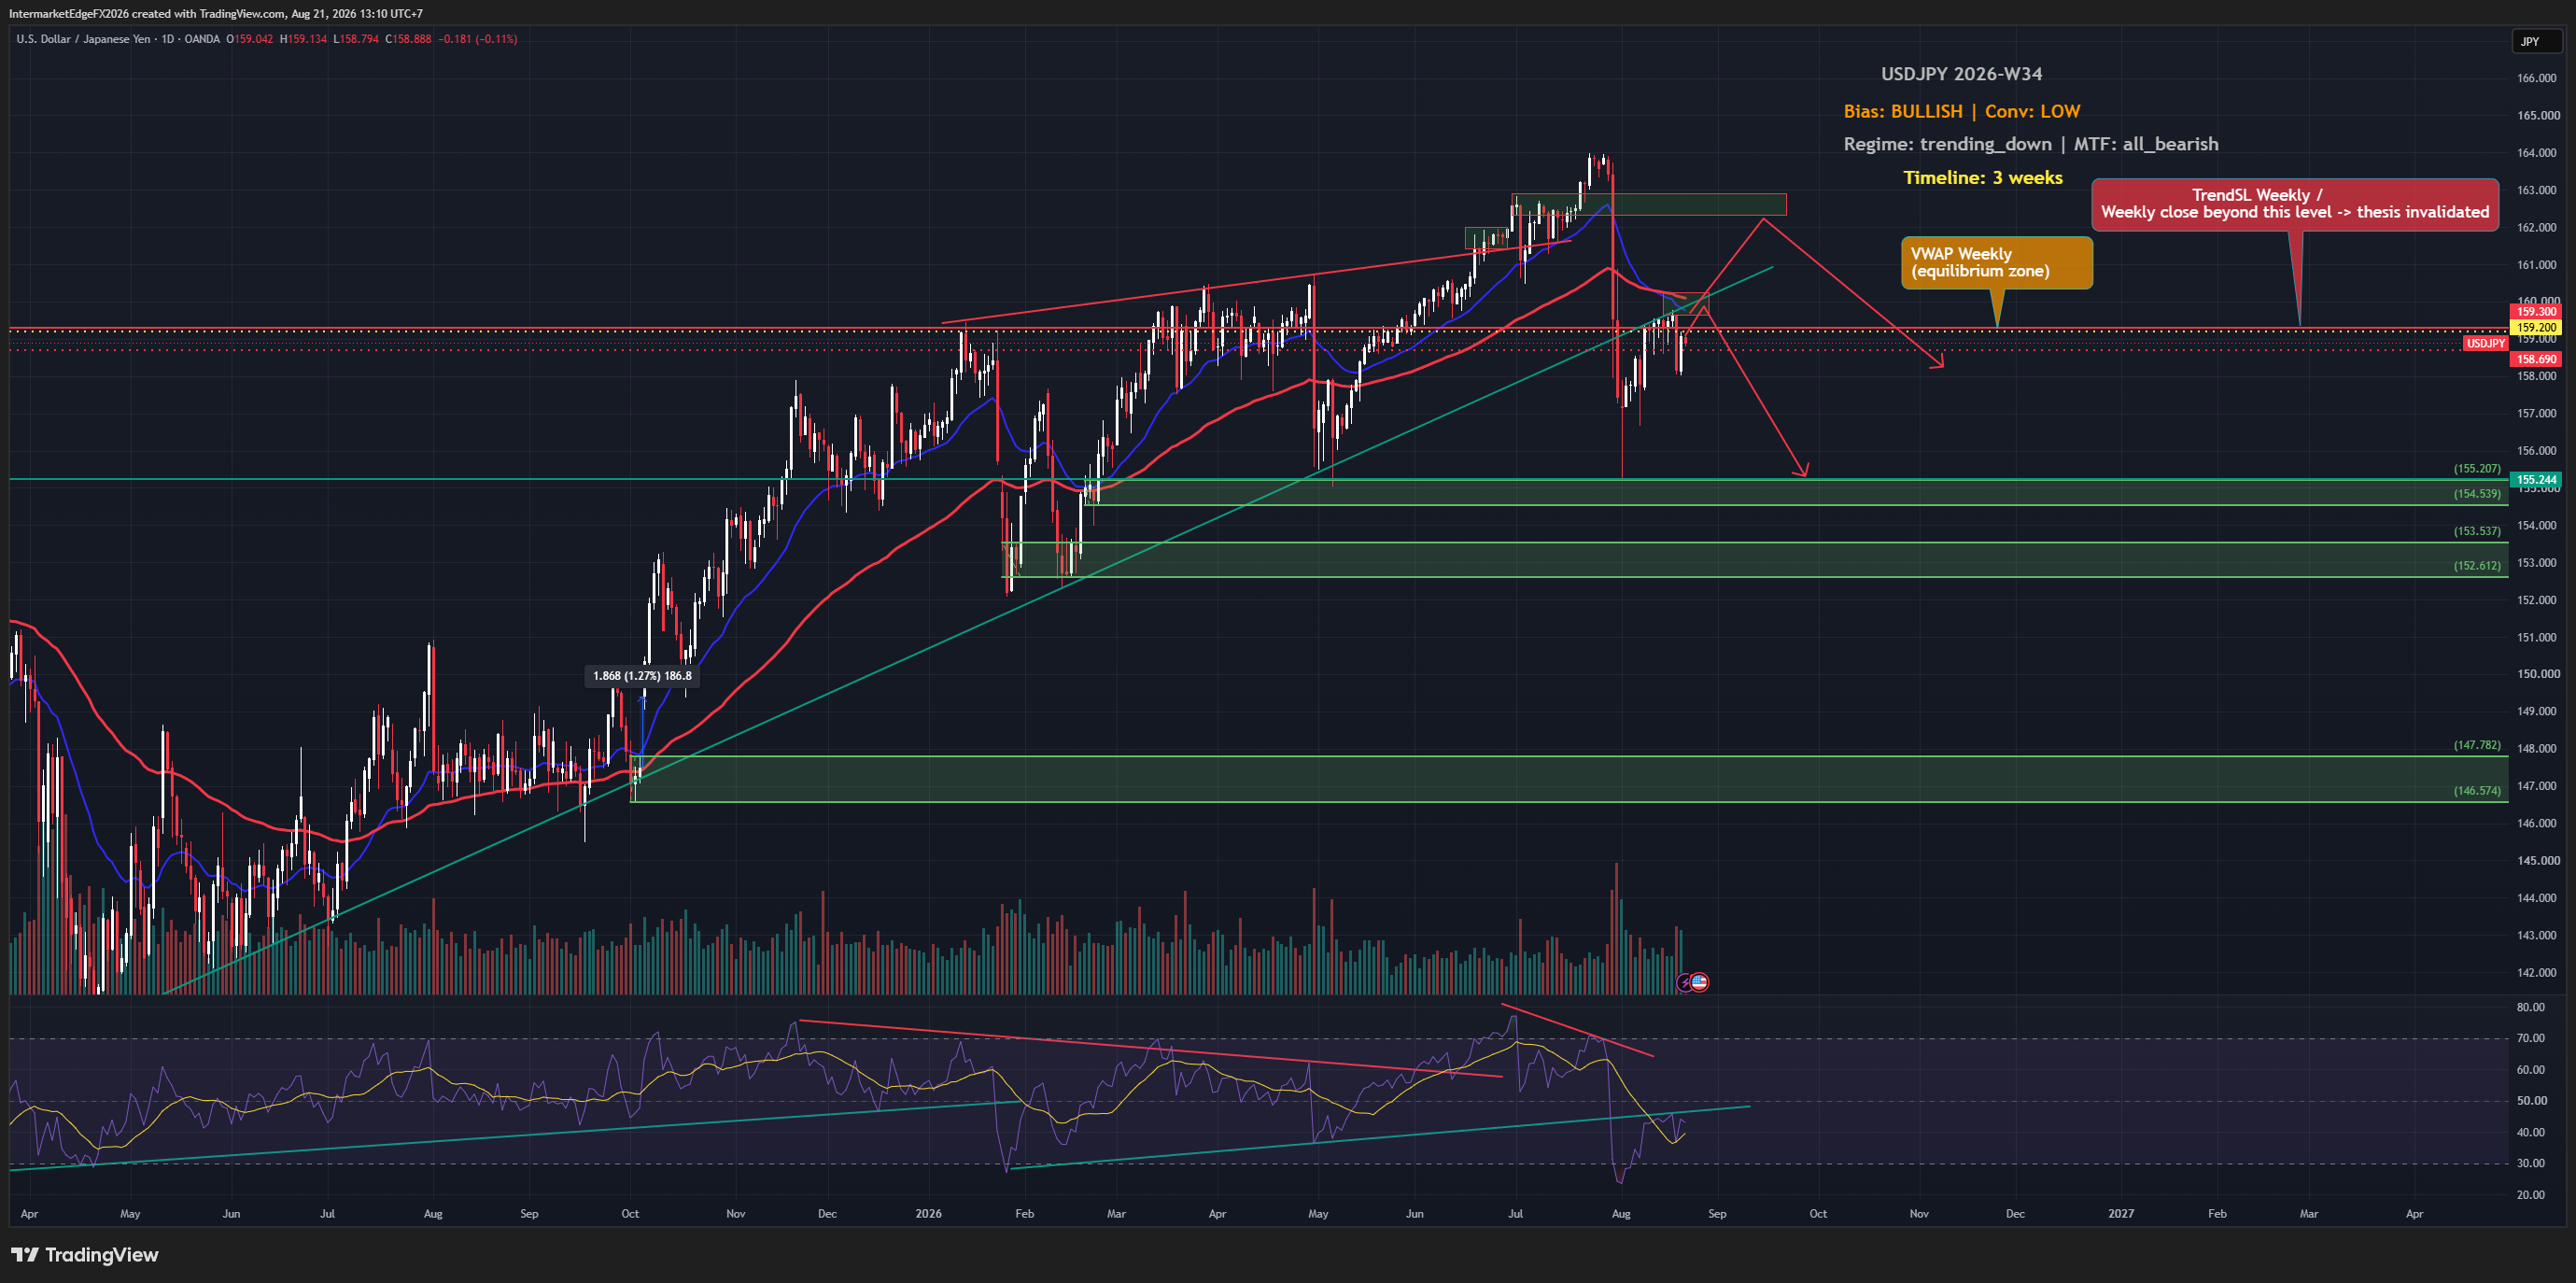
USDJPY 159.897 | intraday high 161.946 | 03 June 2026 USDJPY touched 161.946 this morning — clearing the prior intervention zone — then reversed 200 pips. That single candle is the most important price action of the week. It is either the market self-correcting ahead of MOF action, or verbal intervention has already begun. The structural bear case is built on three pillars that the data pipeline is obscuring. First, JP10Y is not 1.47% as the stale pipeline reads — the chart sidebar shows 2.621%. The corrected US-JP spread is 1.834%, not 2.985%. Carry trade math is deteriorating faster than most analysis reflects. Second, BoJ June 16 hike probability has moved to 66%. The April 28 meeting produced three dissenters voting to hike immediately, and Shunto wages showed 5.09% for a third consecutive year above 5%. Third, the MOF intervention asymmetry is severe: the Ministry spent $62 billion in 2024 defending the yen, the precedent near 160 produced an 800-pip round trip, and the firepower remains. The tactical complication is Gulf hostilities. Trump rejected the halt in US-Iran talks. Brent has retraced above $100. Oil above $100 is dollar-positive and yen-negative simultaneously — Japan is the world's fourth-largest oil importer. This dual channel is why the pair broke 160 today. It reverses the moment a deal is signed. Invalidation: daily close above 161.346. Bear confirmation: daily close below 159.000. Wave (c) targets: 152.612 → 147.782. Today's daily close is the definitive tell. Conviction: Medium-High Bear.

EURJPY at the Ceiling — ECB Cuts Into BoJ Normalization, Oil Rebounds, and 187.936 Is the Line That Cannot Hold

EURJPY at the Ceiling — ECB Cuts Into BoJ Normalization, Oil Rebounds, and 187.936 Is the Line That Cannot Hold

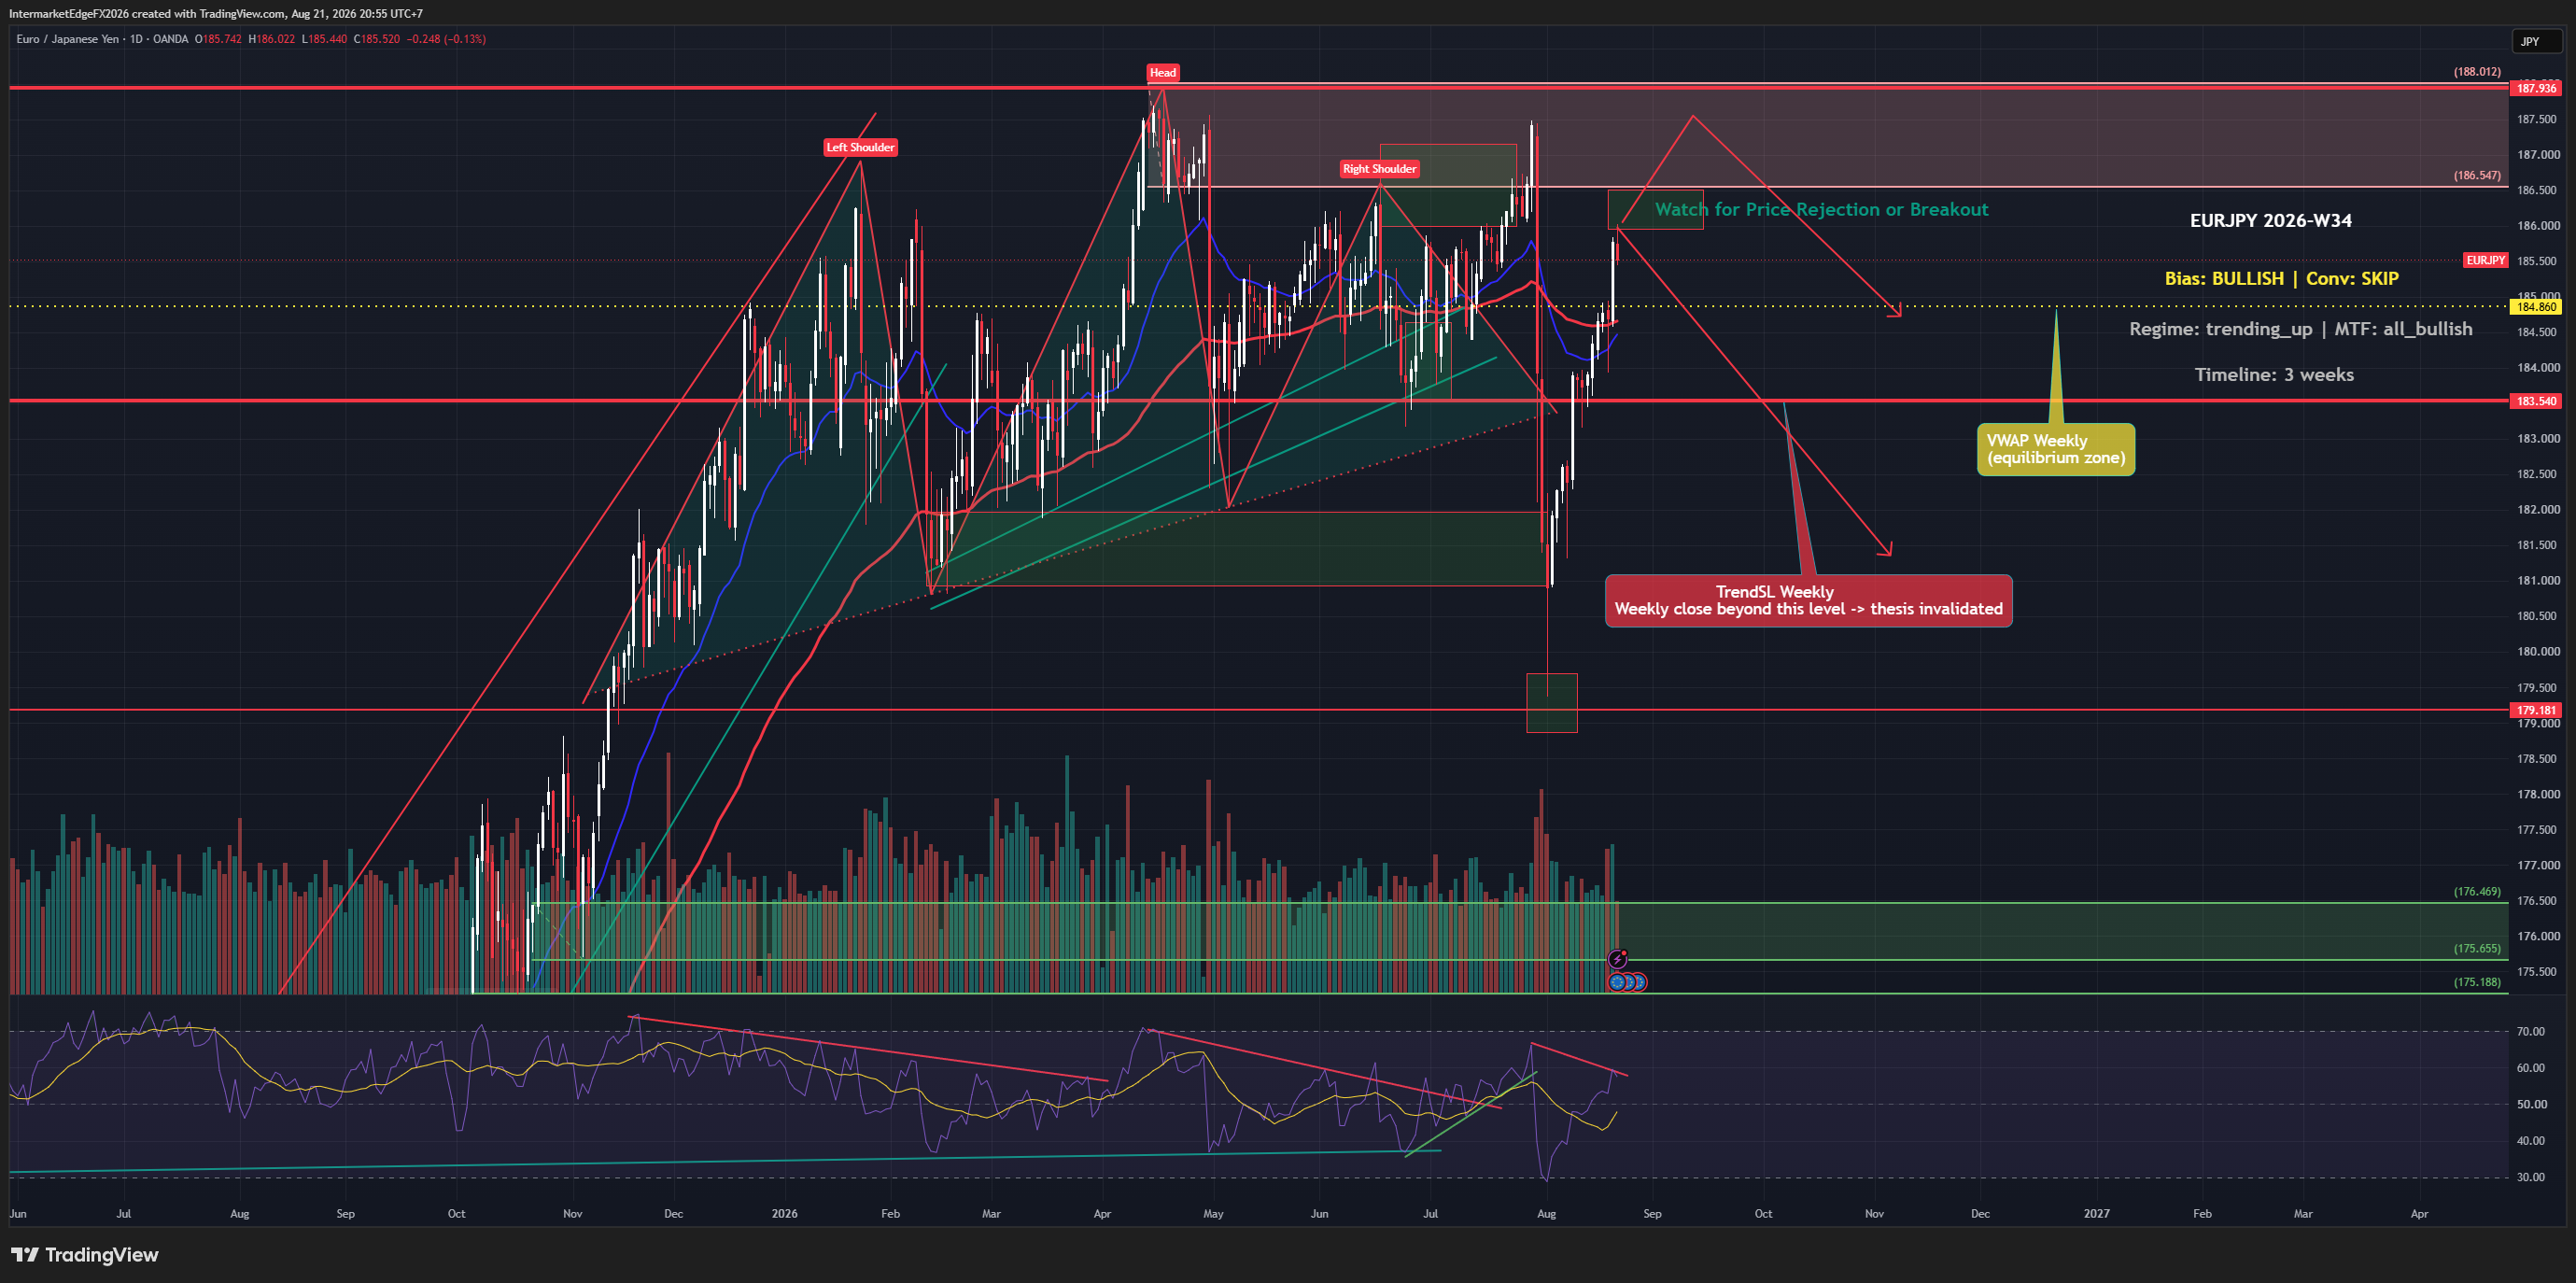
EURJPY 186.063 | 02 June 2026 EURJPY is sitting inside the red resistance zone at 186.00–188.012, and the bear case here is the highest-conviction position in this week's entire instrument coverage. Three structural forces are aligned in the same direction. The ECB is cutting. The June 5 decision — two days away — takes the deposit rate from 2.50% to 2.25%. The rate differential between the ECB and BoJ is compressing, and it will compress further with every subsequent cut. A cutting central bank does not produce a strong currency. The euro is the structurally weaker leg of this cross. The BoJ is normalizing. The pipeline's JP10Y reads 1.47% — stale, last updated May 9. The chart sidebar shows 2.563%. That 110 basis point gap is not a rounding error; it reflects a Japanese bond market that is pricing significantly more BoJ tightening than the pipeline implies. The yen leg of EURJPY has structural support the data pipeline is obscuring. The intervention ceiling is live. USDJPY at 159.852 is 15 pips from 160.00 — the threshold that triggered verbal and physical BoJ intervention in 2024 and that the market universally treats as the current line. A physical intervention would produce a 3–5% yen rally and drive EURJPY down 500–700 pips rapidly. The asymmetry is severe: upside above 160 is capped, downside from intervention is sharp. The single countervailing factor is today's Brent rebound from $91.69 to $98 on Iran deal uncertainty. Japan is the world's fourth-largest oil importer — oil up means yen weakens mechanically. This is why EURJPY is holding near 186 rather than already declining. It is transitional noise, not a structural reversal. Invalidation: daily close above 187.936. Bear confirmation: daily close below 184.00. Wave (c) targets: 171.047 → 169.867. ECB June 5 is the trigger. Conviction: Medium-High Bear.

Sterling Trapped — Bailey Pushes Back, Iran Stalemate Persists, and the 1.3400 Floor Defines the Trade

Sterling Trapped — Bailey Pushes Back, Iran Stalemate Persists, and the 1.3400 Floor Defines the Trade

GBPUSD 1.3462 | 02 June 2026 Sterling has been trapped in the 1.3300–1.3500 range for two weeks, and the tension keeping it there is not resolving soon. Two forces are pulling in opposite directions and neither has won. The bull case runs through the dollar channel, not sterling itself. DXY is in a Medium Bear framework driven by the Iran deal decompression cascade — Brent has fallen $17.95 from its $111.27 peak on May 18. When the deal progresses, DXY falls and cable rises mechanically. The UK energy vulnerability factor amplifies this: as a net energy importer, every dollar of Brent decline below $90 benefits sterling disproportionately relative to other G10 pairs. The bear case is Bailey. The BoE Governor has spent the past week systematically removing rate hike premium from sterling. He stated that allowing inflation to exceed 2% is appropriate given weak growth, that the BoE is in no rush to raise rates while Iran remains uncertain, and that even a 60-day ceasefire would still create uncertainty. Markets were pricing 32bp of tightening in 2026; Bailey has been capping that at every opportunity. This morning's US ISM Manufacturing PMI at 54.0 — beating the 53.0 consensus — added a mild dollar bid that is currently capping GBPUSD near 1.3480. On the chart, the 1.3400–1.3450 green support has held on every test. Resistance at 1.3500–1.3550. Bear targets if support breaks: 1.3081, 1.3007, 1.2818. Key tell this week: EURGBP around ECB June 5. A break below 0.8600 is a leading indicator of cable strength. Conviction: Medium, Neutral-to-Mild Bear. Iran binary resolves the range.

Gold at the Decision Point — Iran Stalemate, Real Yield Inversion, and the $4,296 Support That Cannot Break

Gold at the Decision Point — Iran Stalemate, Real Yield Inversion, and the $4,296 Support That Cannot Break

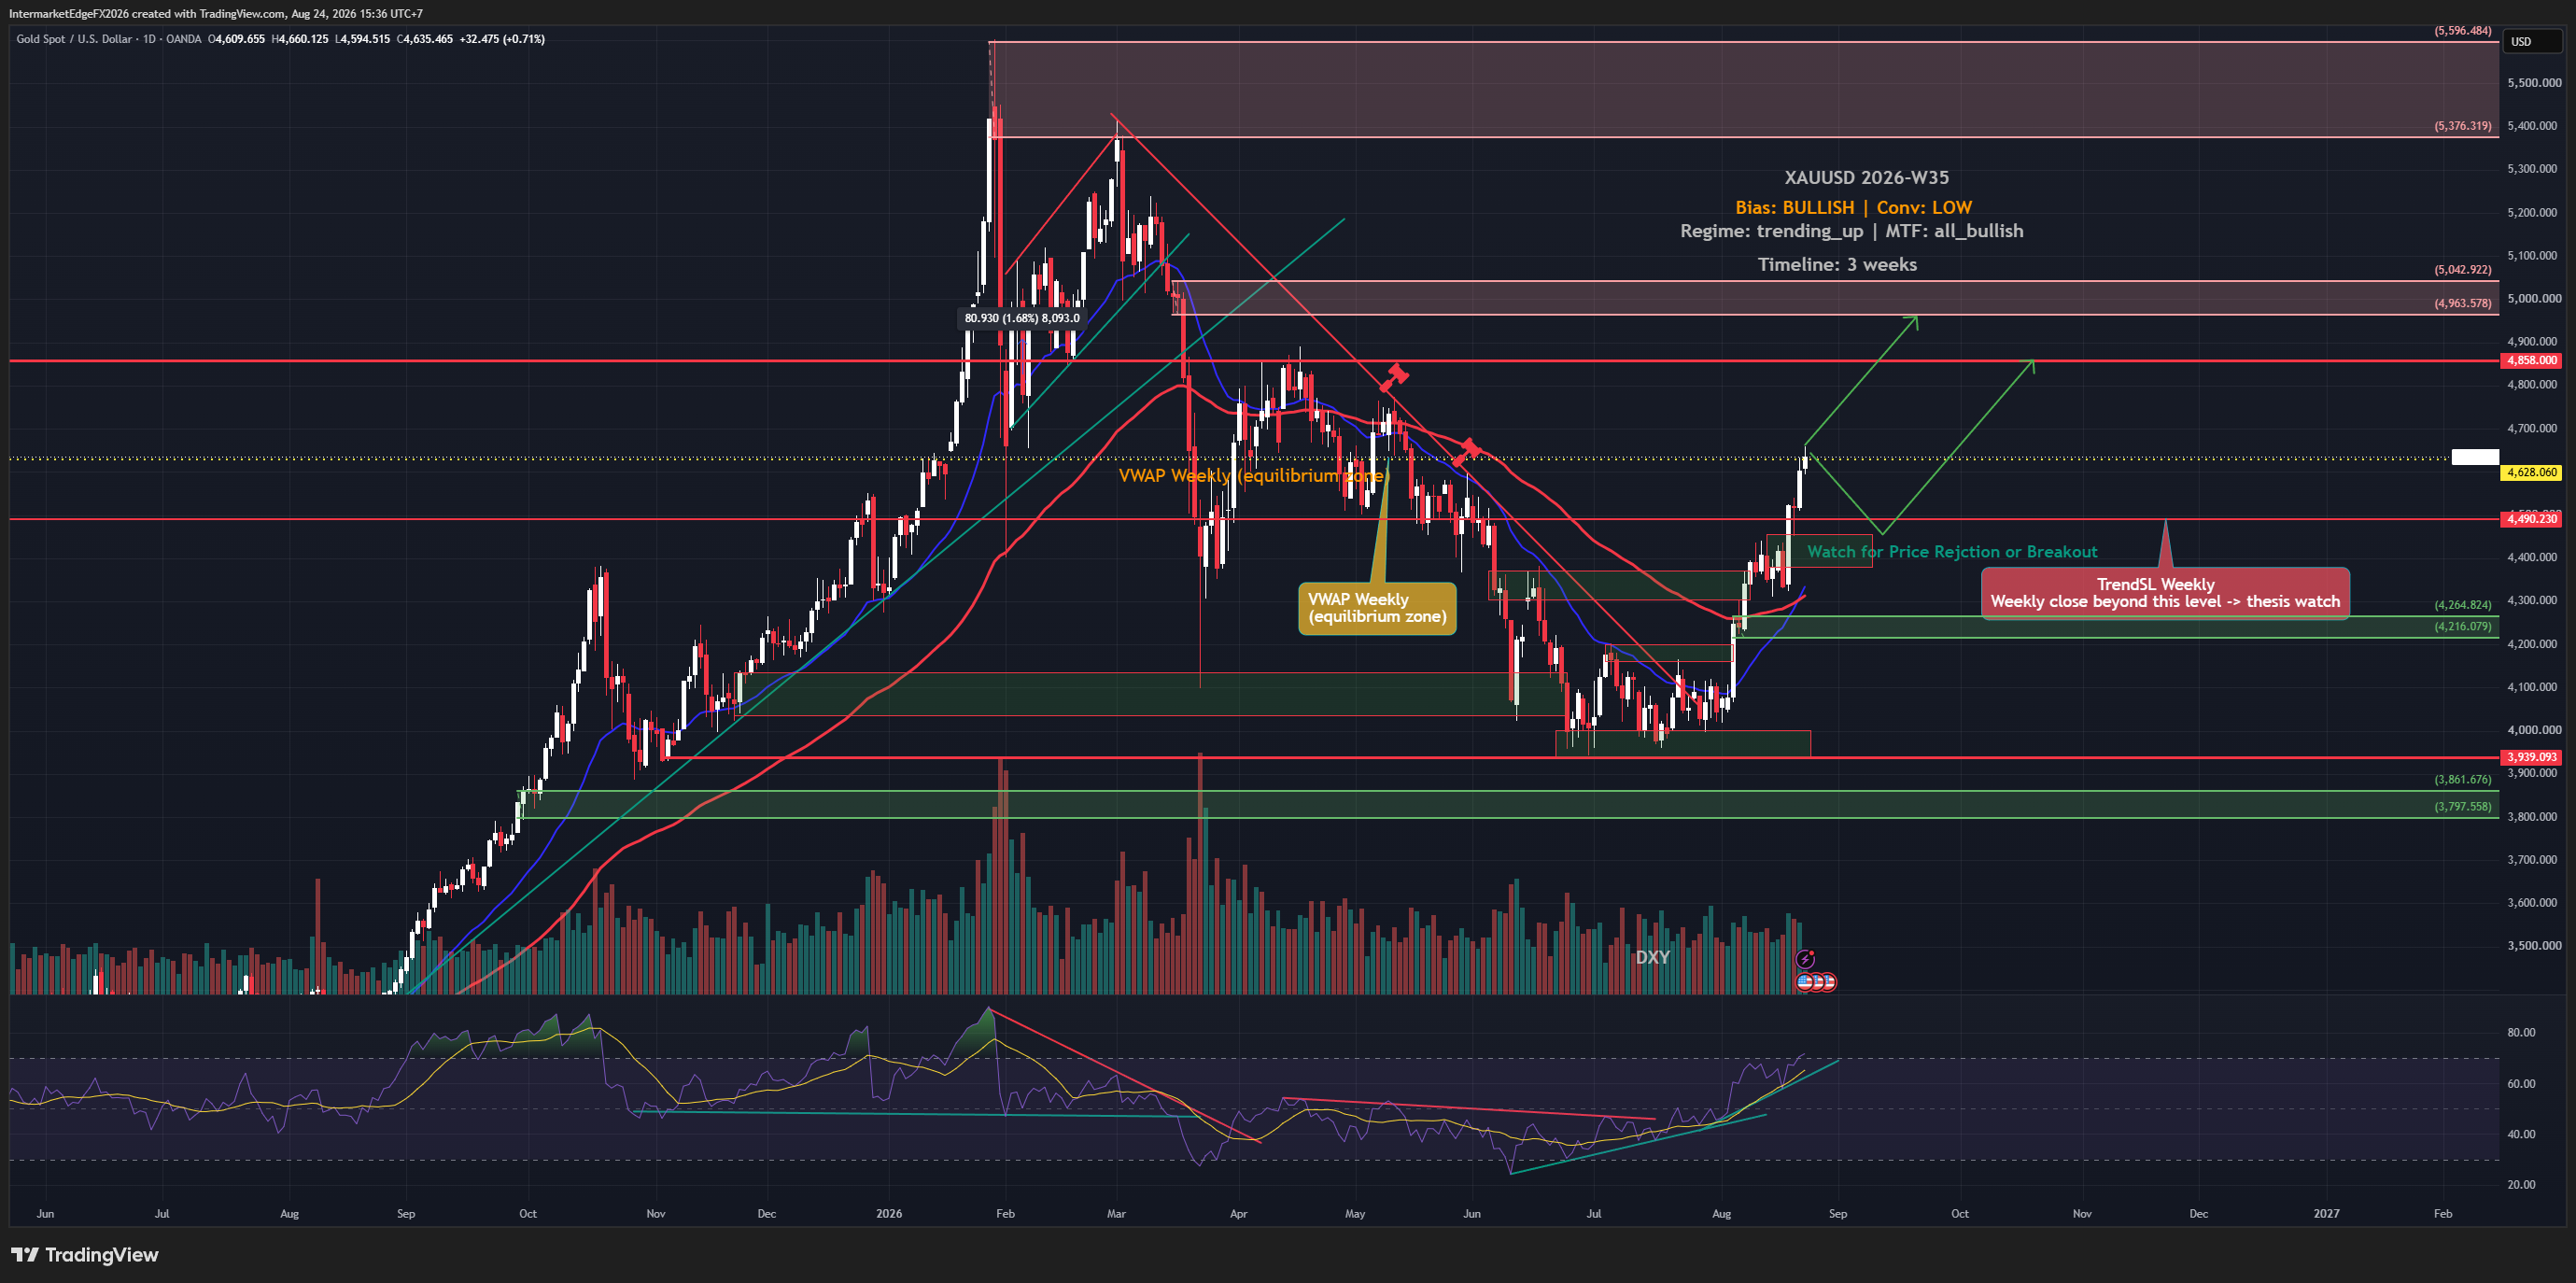
XAUUSD $4,534 | 02 June 2026 Gold is sitting directly on its most important support zone of the year — $4,296 to $4,381 — and the next $200 move in either direction will be decided by a single binary: whether Trump signs the Iran ceasefire deal or walks away. The macro case for gold recovery is structurally sound and does not require geopolitical optimism to hold. With April CPI confirmed at 3.8%, the corrected US real yield is 0.653% — not the 2.05% the stale data pipeline implies. Real yields below 1% historically support gold outperformance on a 3-6 month horizon. The oil decompression cascade has already delivered: Brent fell $17.95 from its $111.27 peak on May 18. Lower oil compresses inflation expectations, reduces Fed hike probability, and begins unwinding the real yield headwind that drove gold from $5,078 to $4,290. The critical regime nuance: in this cycle, an Iran deal is bullish gold — not bearish. Geopolitical de-escalation lowers oil, which lowers inflation, which lowers real yields. The classical safe-haven logic runs backward here. On the chart, RSI has not made a lower low despite price testing the support zone — a momentum divergence consistent with exhaustion of downside pressure. Invalidation is a daily close below $4,178. Bull confirmation sequence: $4,600 → $4,750 → $5,000 weekly close. Key catalysts this week: Iran headline (highest impact, unscheduled), EIA inventory Wednesday, ECB Thursday June 5. Conviction: Conditionally Bullish. The support must hold.

Stay in the loop

Get notified about new research, macro insights, and market analysis.

InterMarketEdge

© 2026 InterMarketEdge. Financial intelligence for inter-market traders.