Articles — InterMarketEdge

Articles

Financial intelligence, macro research, and inter-market analysis.

AUDUSD | May 22, 2026 The Commodity Currency That Lost Its Commodity Story

AUDUSD | May 22, 2026 The Commodity Currency That Lost Its Commodity Story

**AUDUSD | May 22, 2026** AUDUSD is trading at 0.7143. That number looks stable. It is not. Three structural forces are converging simultaneously against the Australian dollar, and the catalyst that ties them together arrived on Wednesday when the ABS released April labor force data. Australia's unemployment rate rose to 4.5% - the highest since November 2021. Employment fell by 18,600, the first contraction in five months, against expectations of a 17,500 gain. The participation rate declined. The underemployment rate ticked higher. Every measure of labor market health deteriorated simultaneously. The market partially priced it: AUDUSD dipped to 0.7106 on the release before recovering to 0.7143 on Iran deal optimism. That recovery is borrowed time, not structural support. The unemployment shock matters because it changes the RBA calculus. Before Wednesday, the RBA was "Hold 4.10%, watching CPI." After Wednesday, the labor market is cooling faster than expected, unemployment is approaching the RBA's own NAIRU estimate of 4.5-5.0%, and the case for rate cuts is building. A cutting RBA versus a holding-or-hiking Fed is a structural AUD-negative that plays out over months, not sessions. The second force is the commodity premium compression. AUD rode the Iran war commodity shock higher, but the RBA's own May Statement acknowledges this boost is short-lived with few lasting implications for Australian mining. Brent has now fallen from $111.27 at the start of this week's analysis series to $104.62 today. The terms-of-trade tailwind is fading. The third force is AUD's high risk-sentiment beta. VIX at 16.76 and equities at new week-highs are providing a temporary floor. When that floor is removed - whether by an Iran deal collapse, a China disappointment, or an EIA inventory build - AUD reprices fast. Key levels: 0.7276-0.7200 resistance, 0.6938-0.6879 near-term target, 0.6491-0.6438 structural floor if both commodity and RBA premium exit simultaneously. Conviction:

USOIL | May 21, 2026 The Oil Market's Most Important Week - What the $5 Swing Tells You About Hormuz

USOIL | May 21, 2026 The Oil Market's Most Important Week - What the $5 Swing Tells You About Hormuz

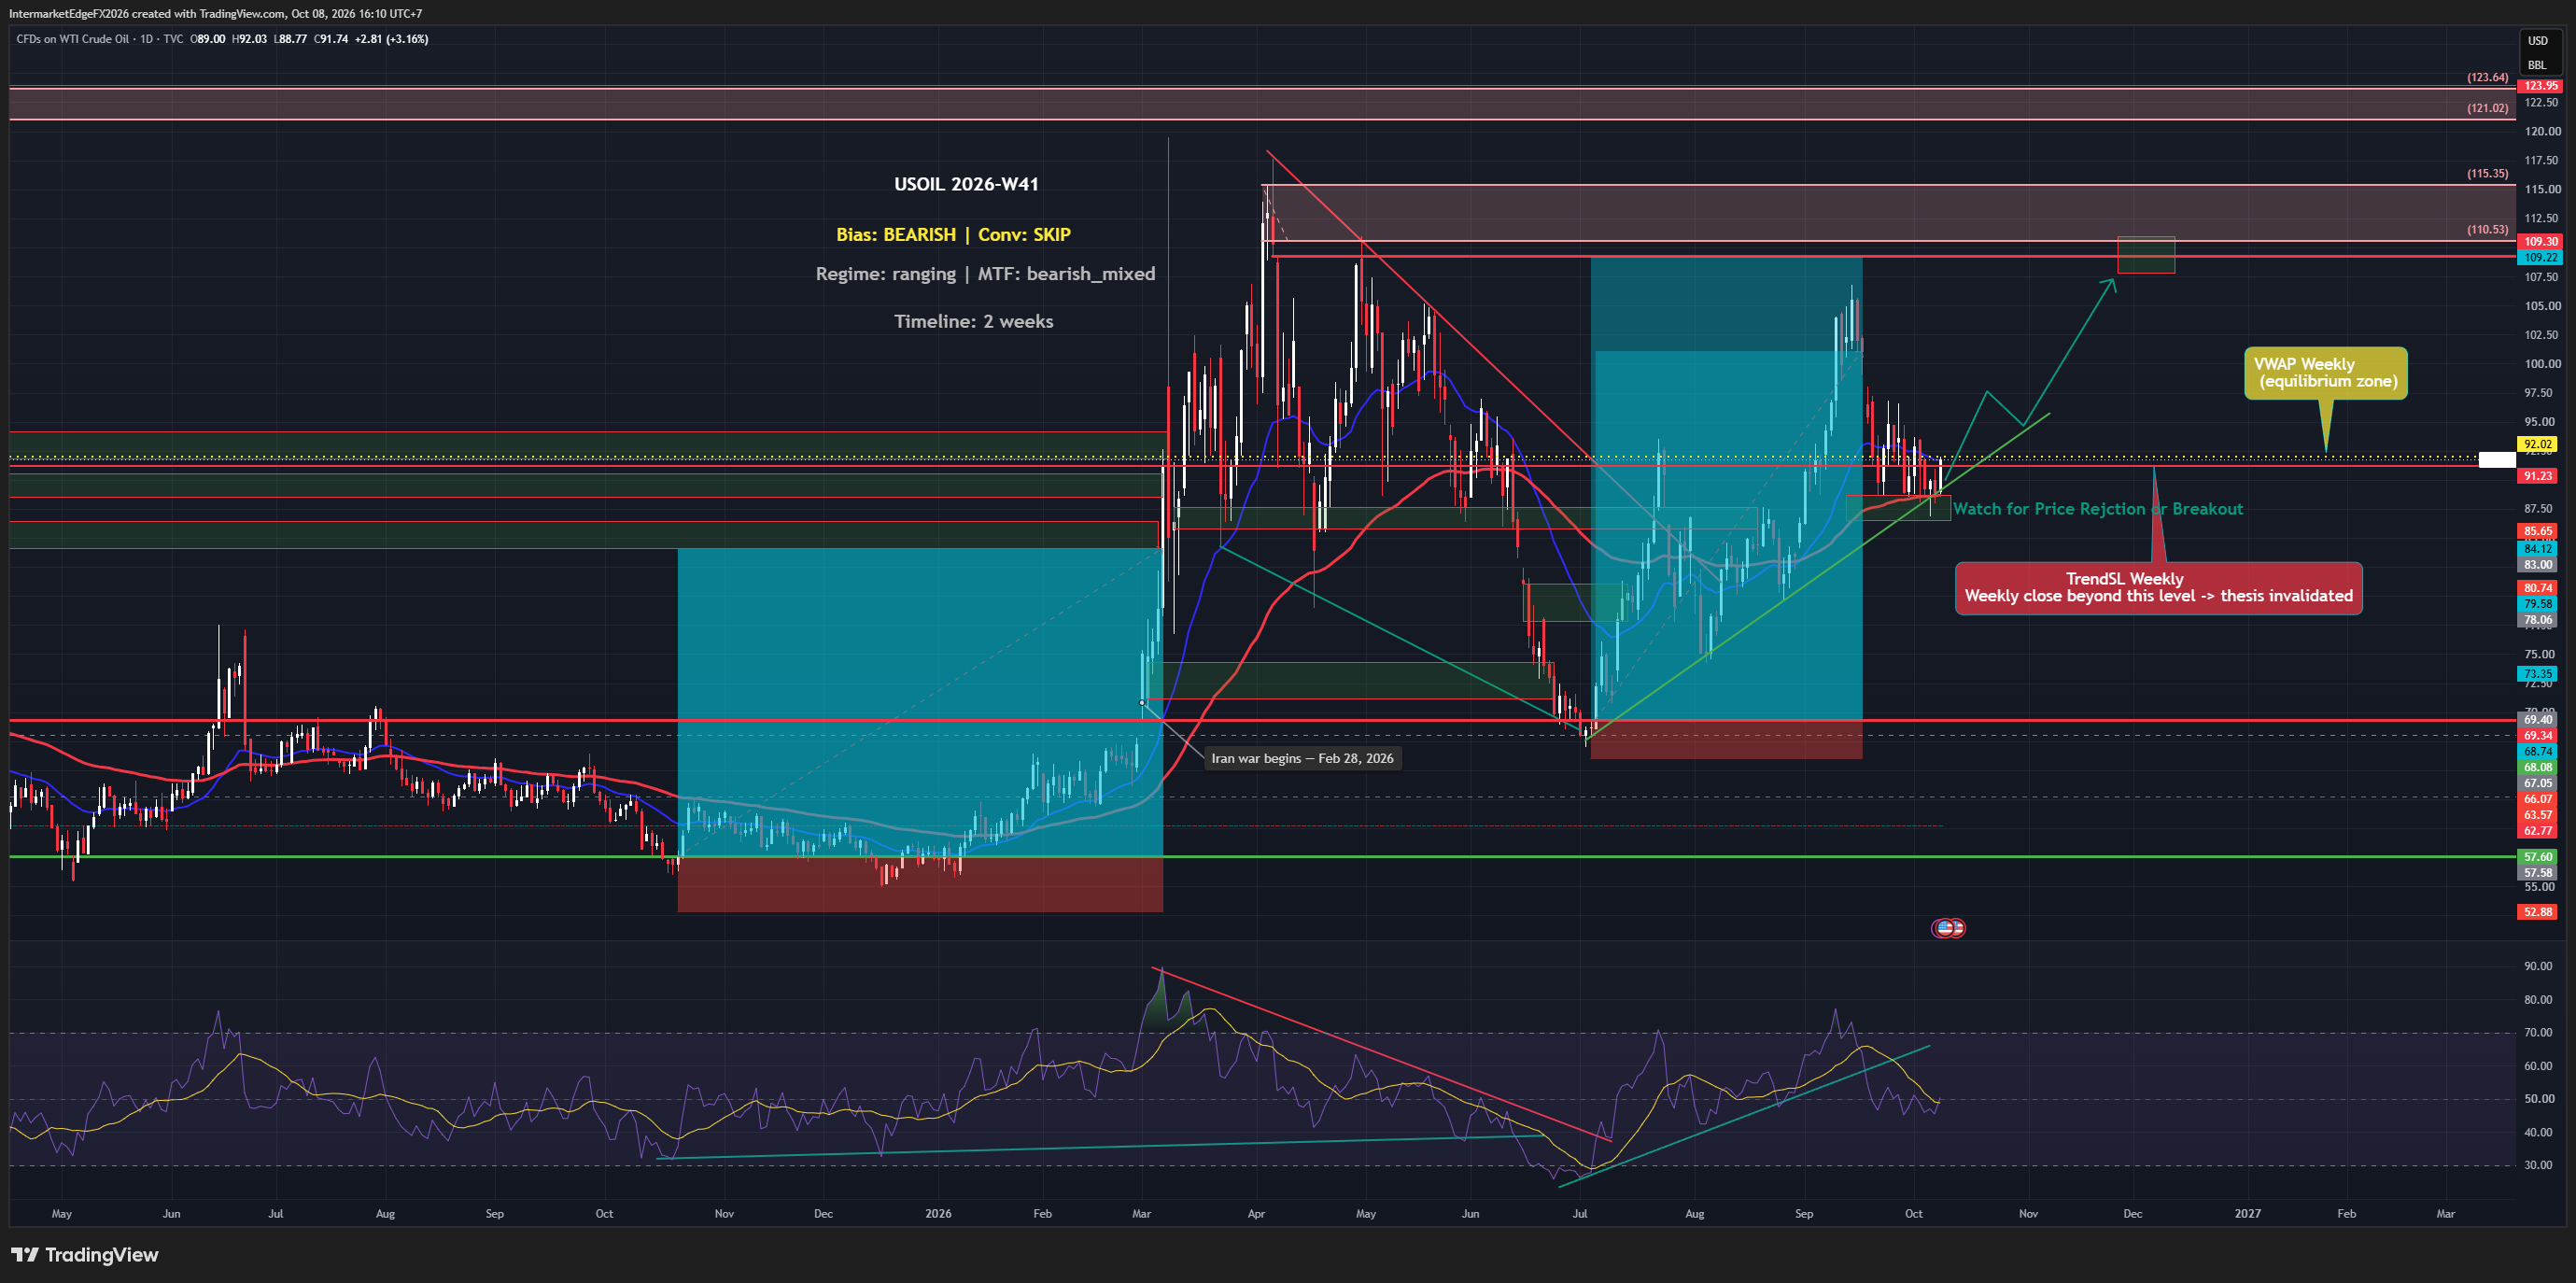
**USOIL | May 21, 2026** WTI at $101.13. Brent at $107.40. This is the instrument that drove every other analysis published this week. The Brent sequence from May 18 to May 21 is the story of the week in a single column of numbers. From $111.27 on Monday to $106.09 Thursday morning, then bouncing to $107.40 by evening. A $5 decline and partial recovery across four trading days - not noise, but the market pricing and partially repricing Hormuz reopening probability in real time. The structural picture is unambiguous. This is still the largest oil supply shock in market history by some measures. Hormuz remains largely restricted. Three supertankers transited the Strait on Wednesday - in a market accustomed to hundreds per week. That is not normalization. US crude inventories fell for a fourth consecutive week, confirming demand is holding and the supply shortage is genuine. OPEC+ adding +411kbpd from June is a gesture in a market facing a daily shortfall estimated at 14+ million barrels. But the Iran deal probability introduces a binary outcome that overrides the structural argument in the short term. A deal confirmed sends WTI toward $74-82 as the war premium exits - gradually, not instantly, because physical infrastructure takes months to normalize. A deal collapse sends WTI back toward $109-115. Wednesday's EIA data is the supporting variable. The Iran headline is the primary driver. The intermarket confirmation is clear. Gold at $4,515 recovered alongside oil today. EURUSD held above 1.15. USDJPY stayed below 160. Every currency pair analyzed this week - USDCAD, EURUSD, DXY, GBPUSD, EURGBP, EURJPY, USDJPY - moved because of this number. The structural tell is not a diplomatic announcement. It is tanker tracking data. Watch three supertankers become thirty. When that happens, Brent flips from backwardation to contango - and the war premium exits. Conviction: Medium. Structurally bullish. Directionally binary on Iran.

USDJPY | May 21, 2026  - The Pair That Just Hit Two Walls Simultaneously - Iran Deal Optimism Meets BoJ Hawkish Signal

USDJPY | May 21, 2026 - The Pair That Just Hit Two Walls Simultaneously - Iran Deal Optimism Meets BoJ Hawkish Signal

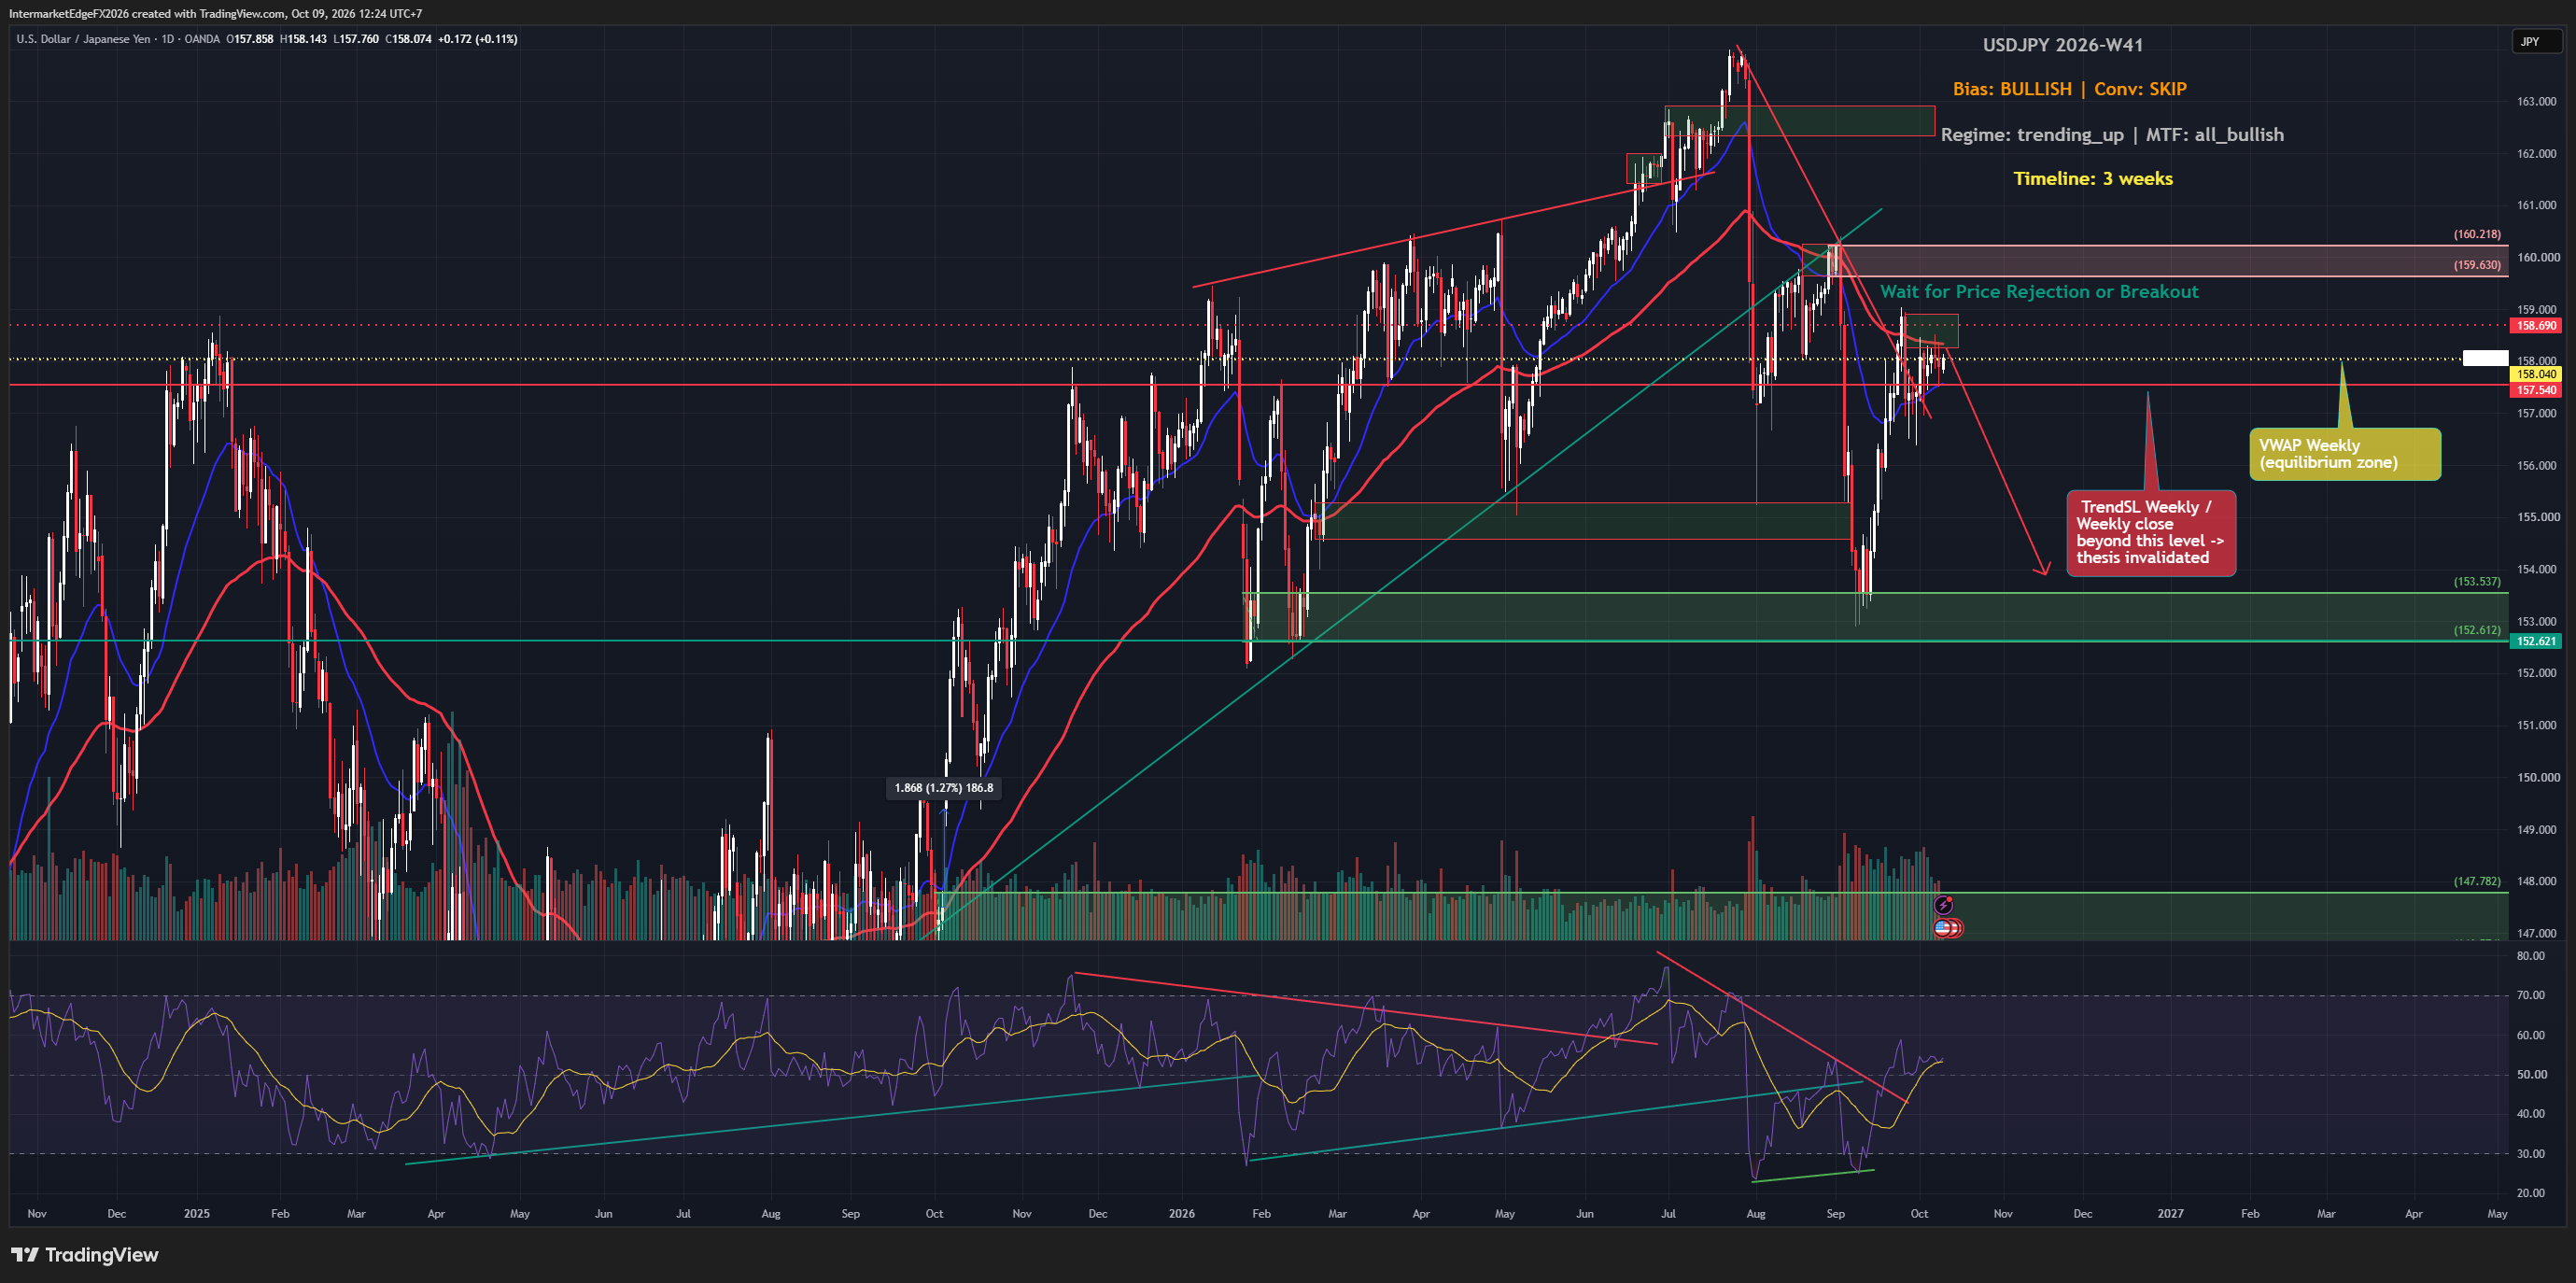
USDJPY | May 21, 2026 USDJPY hit 160 on Wednesday. It has already rejected from that level. And the forces now aligned against the dollar-yen carry trade are the strongest combination seen in this week's entire analysis series. Two things happened simultaneously in the last 24 hours. Trump said Iran negotiations are in the "final stages," causing the dollar to fall against the yen for the first time in eight consecutive sessions as safe-haven USD flows reversed. And BoJ board member Junko Koeda delivered an explicit hawkish signal, stating the central bank needs to continue raising rates with underlying inflation already around the 2% target. Both forces are USDJPY-negative. Neither is ambiguous. The Brent crude sequence this week captures the macro shift in a single column of numbers. From $111.27 on May 18 to $106.09 today - a $5 decline in three trading days. The Hormuz geopolitical premium is decompressing in real time. For Japan specifically, this creates a double tailwind: the safe-haven USD bid falls as geopolitical risk eases, and energy import cost pressure reduces as oil softens. JPY benefits from both sides of the Iran de-escalation trade simultaneously. The 160 level is not just technical resistance. It is the intervention threshold. Japan's Ministry of Finance has acted at this level before. This creates an asymmetric risk profile: upside is hard-capped at 160 by intervention threat, downside is structurally open toward 155-152 and potentially 147-148 if Brent breaks below $100. Three drivers aligned bearish for the first time this week: Iran de-escalation removes safe-haven USD premium, BoJ normalization compresses the carry spread, and the intervention zone eliminates meaningful upside. The one counter-force - the US-JP yield spread at approximately 3.10% - is compressing but not yet broken. Conviction: Medium-High. Watch 160. Watch Brent.

EURJPY | Update - May 20, 2026 | 21:24 GMT+7 Carry Cross Bounces - But the Iran De-escalation Signal Is the Real Story

EURJPY | Update - May 20, 2026 | 21:24 GMT+7 Carry Cross Bounces - But the Iran De-escalation Signal Is the Real Story

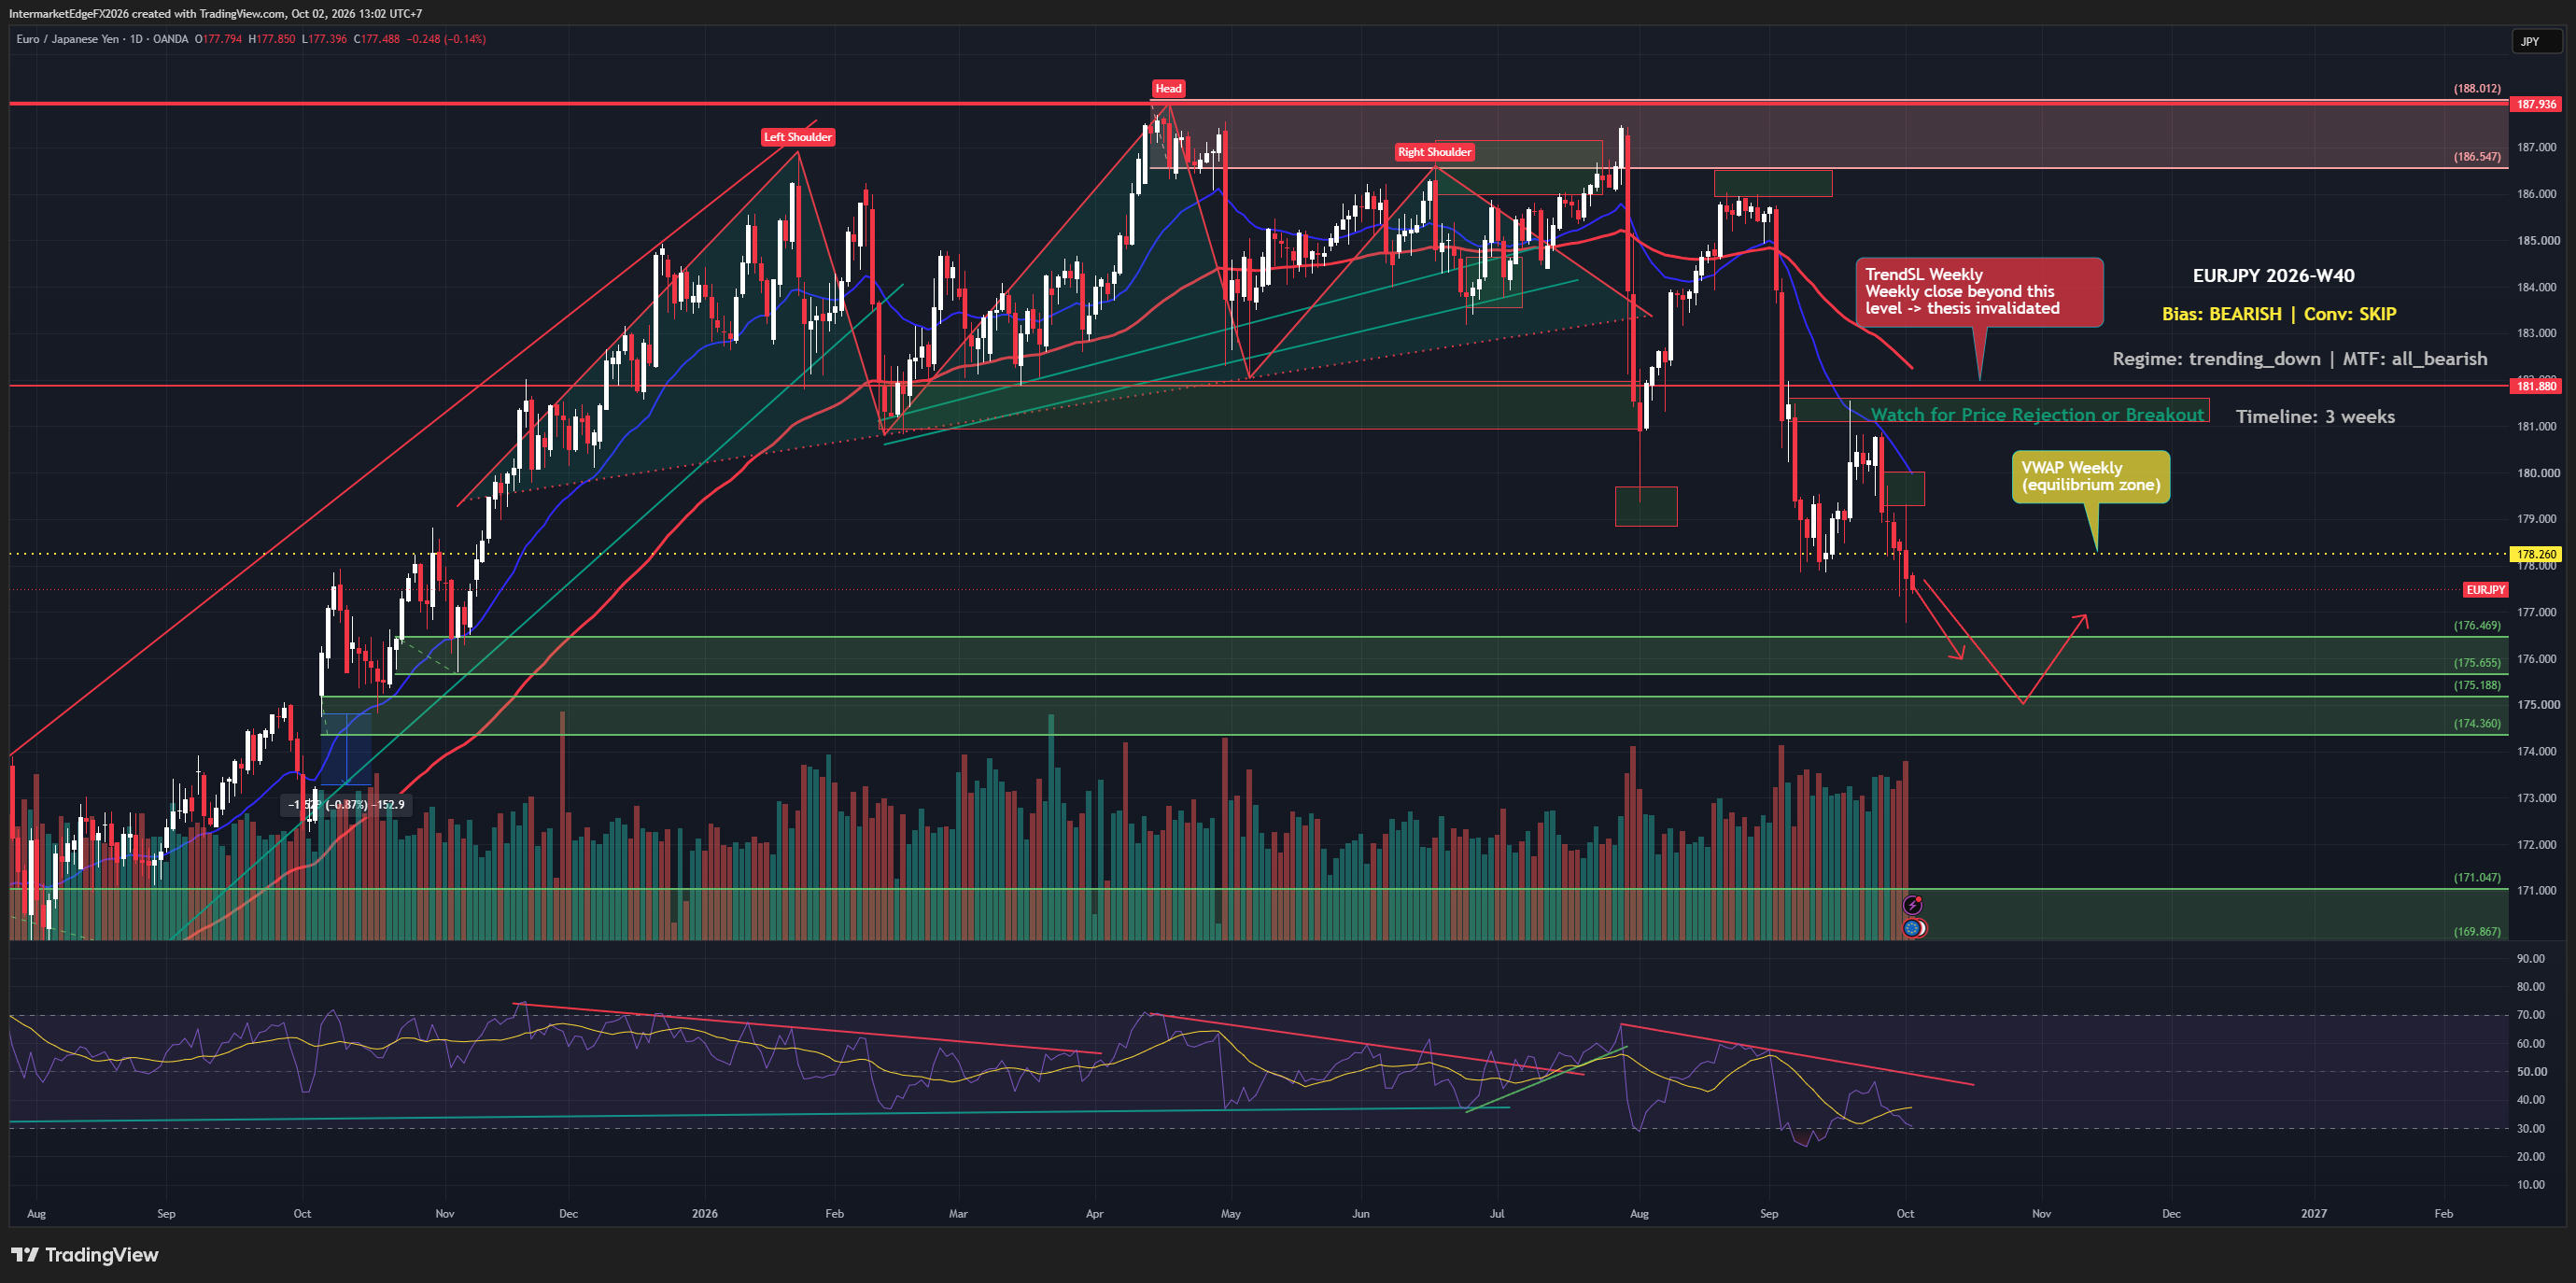
**EURJPY | Real-Time Update - May 20, 2026** EURJPY is at 184.59. The 24 basis point bounce from the session low is not the story tonight. What is happening behind that number is. Iran has sent an updated peace proposal to Pakistan mediators. Brent has dropped to $108.26 - the lowest level of the week. WTI is at $101.58. Oil has fallen nearly $3 in 48 hours. This is the market beginning to price the probability of Hormuz reopening, and it changes the entire analytical framework for EURJPY. The context matters. On May 6, when Trump paused Project Freedom citing "great progress," WTI plunged 15% intraday to $88. The market already showed how violently it reprices when a deal gets close. Tonight is a smaller version of that signal - Iran has sent a proposal, but Trump says he is "not satisfied." The market is pricing probability, not outcome. For EURJPY specifically, this creates a direct conflict. The EUR structural bid - the de-dollarization flow that has been supporting EURUSD above 1.15 despite the ECB cutting cycle - is built on Hormuz urgency. If that urgency compresses, the EUR loses a structural support layer. At the same time, equities are rising (S&P 500 +0.43% to 7,392), which means the carry trade is not being unwound. VIX at 17.91, DE-JP yield spread still +152bps - the carry math is intact. The result: Brent falling while equities rising. EURJPY downside is gradual, not a crash. Carry is not broken. EUR foundation is weakening. Three scenarios this week: Iran deal materializes in 48-72 hours - EURJPY drops toward 180-182 fast (25%). Talks continue without resolution - EURJPY consolidates 182-186, base case (55%). Talks collapse and Iran escalates - oil spikes, EURJPY volatile both ways (20%). The tell: watch Brent and EURUSD simultaneously. If Brent falls but EURUSD holds above 1.15, the structural bid is still absorbing the pressure. If both break together, 180 gets tested quickly. Do not chase tonight. Watch Brent. Watch the next Iran headline.

EURGBP | May 20, 2026 The Cross That Tells the Truth - EUR Outperforming GBP for Structural Reasons

EURGBP | May 20, 2026 The Cross That Tells the Truth - EUR Outperforming GBP for Structural Reasons

**EURGBP | May 20, 2026** Most traders ignore EURGBP. That is exactly why it is worth paying attention to. Unlike EURUSD or GBPUSD, this cross strips out the dollar entirely. No USD noise. No safe-haven flows. No DXY mechanics. Just a direct, unfiltered comparison between two economies and the central banks managing them. And what it is telling you right now is both clear and counterintuitive. EUR is winning against GBP - not because the Eurozone is strong, but because the UK is structurally weaker in ways the market is actively pricing. The ECB is in a cutting cycle with the deposit rate at 2.50%, which should theoretically weaken EUR. The BoE is holding, which should theoretically support GBP through the yield differential - UK 10Y yields are 151 basis points above Germany. Yet EURGBP is holding at 0.8663 and the technical path is toward the major demand zone at 0.8420-0.8441 rather than a sharp EUR collapse. The explanation is asymmetry. EUR is absorbing a structural de-dollarization bid from global central banks and sovereign wealth funds reallocating reserves away from USD - a process that accelerated after the Iran war began in February 2026. GBP has no equivalent support. Sterling is not a reserve accumulation target. The BoE is paralyzed between sticky inflation and fragile growth, carrying a fiscal risk premium and post-Brexit trade friction discount that EUR does not. UK 10Y yields are elevated but failing to attract capital - when yield advantage cannot support a currency, the market is telling you something about credibility. Near-term technical structure points toward continued grinding lower to test 0.8420-0.8441. Medium-term structural argument favors EUR if that zone holds. Watch 0.8420. The reaction there tells you which force is stronger.

EURUSD | May 19, 2026 The Euro at 1.1621 - Holding Above 1.14 While the World Reprices the Dollar

EURUSD | May 19, 2026 The Euro at 1.1621 - Holding Above 1.14 While the World Reprices the Dollar

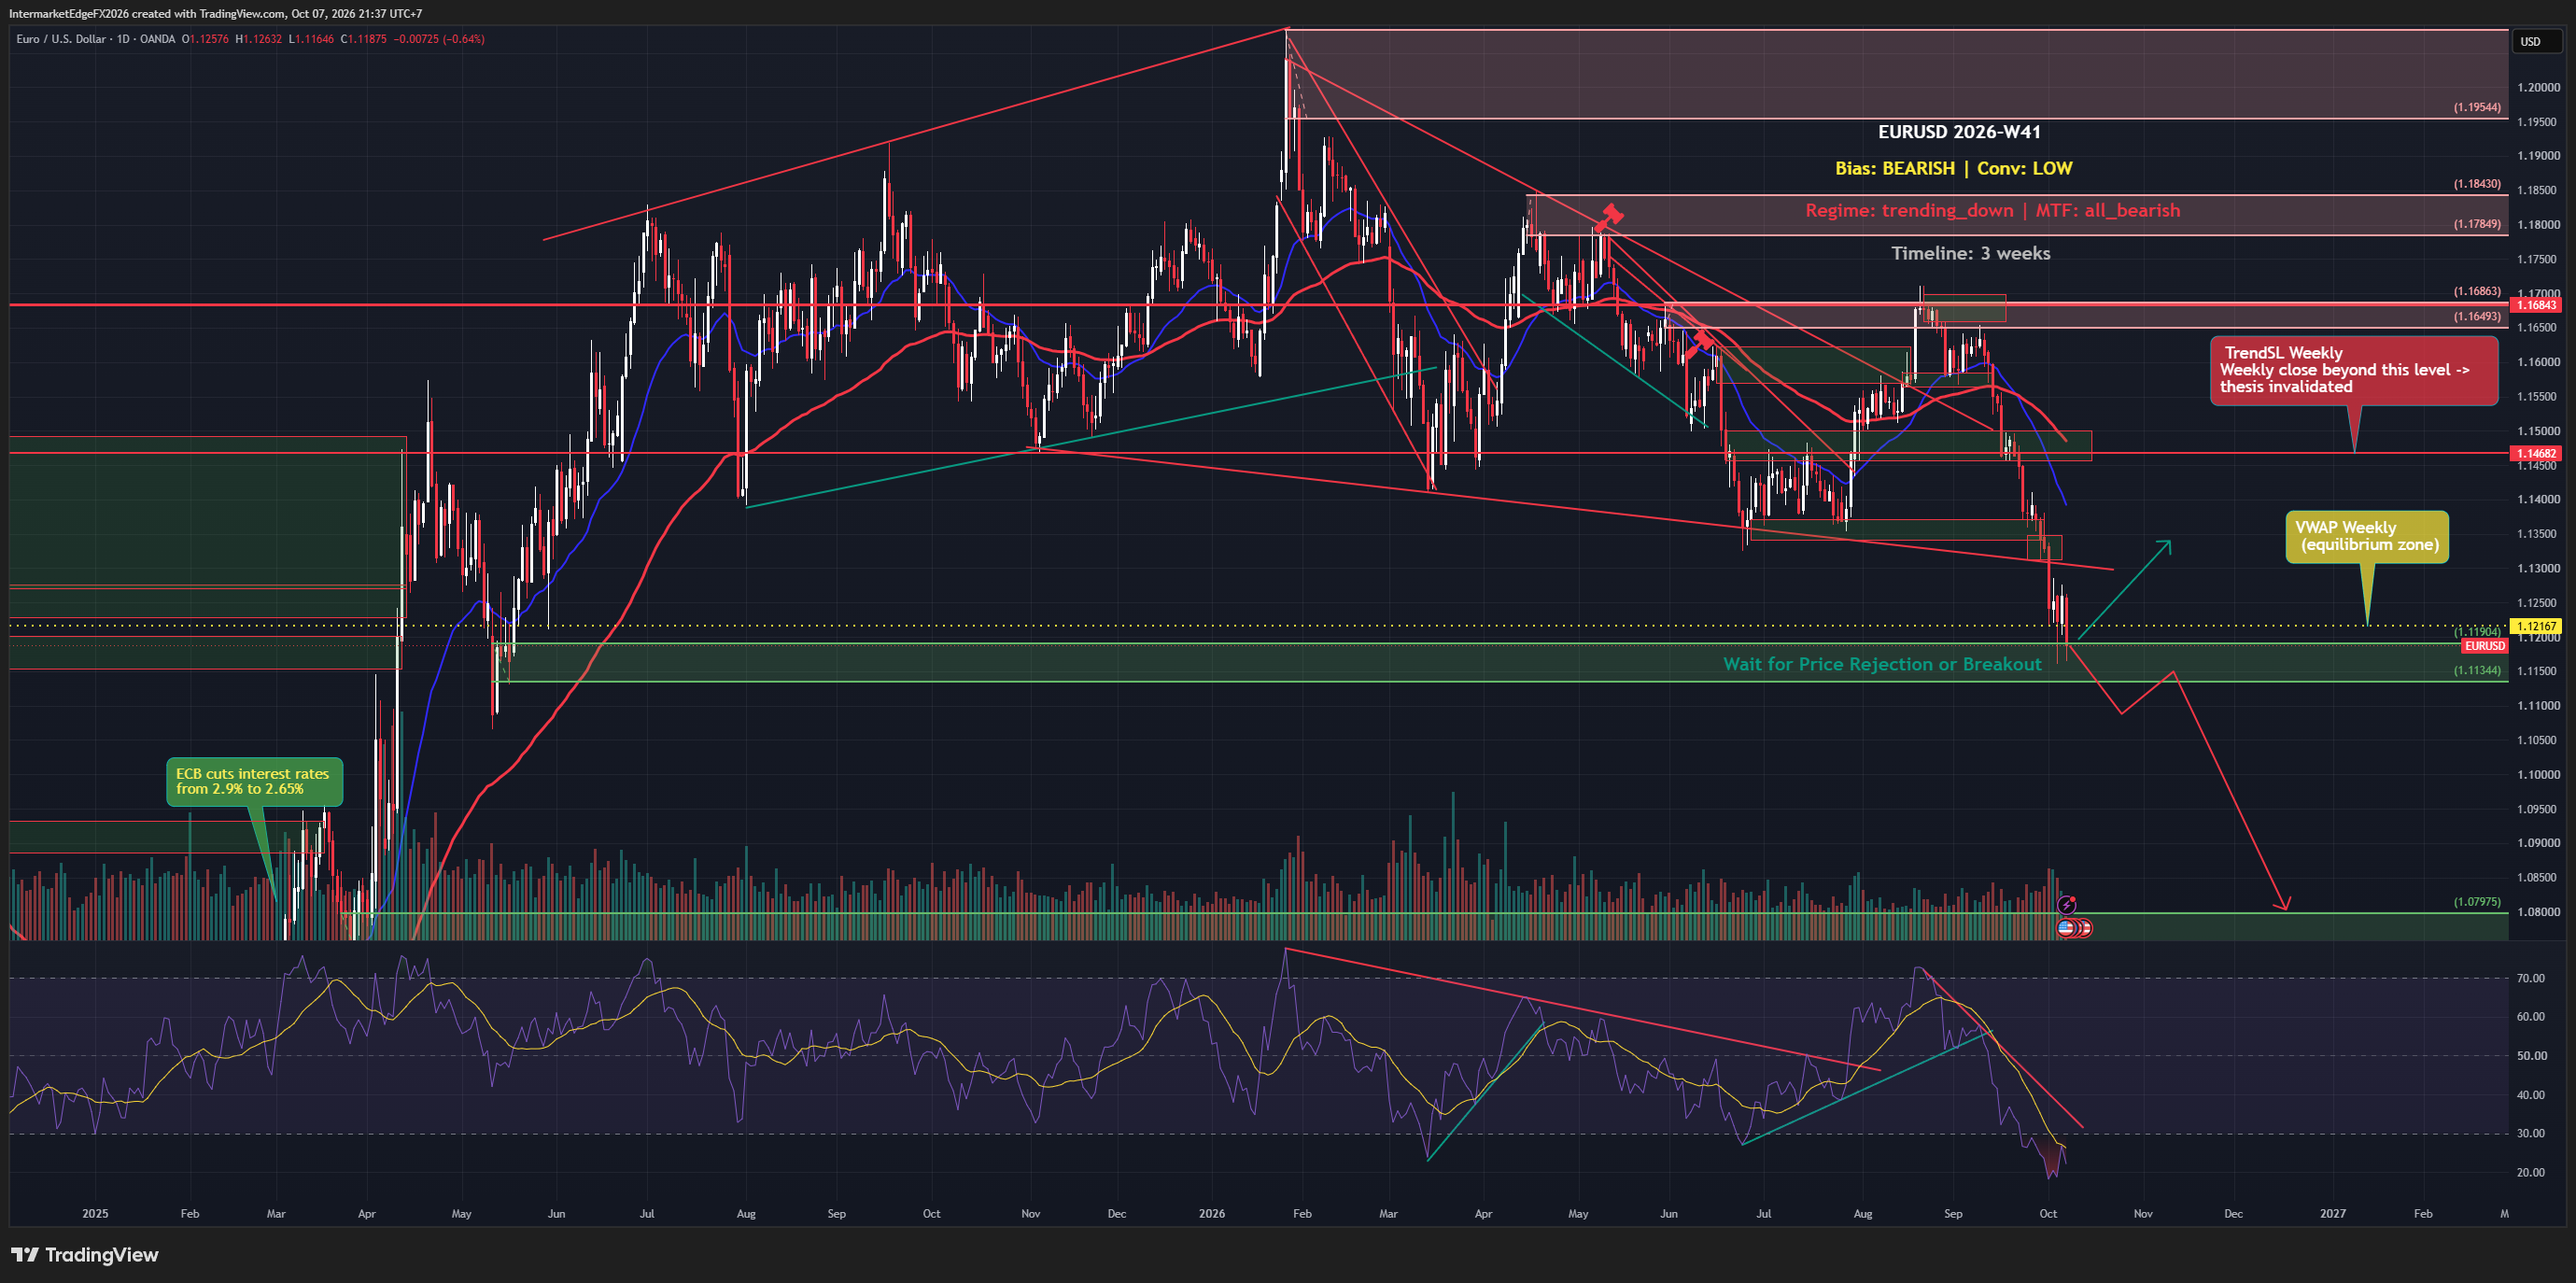
**EURUSD | May 19, 2026** EURUSD is trading at 1.1621 tonight. By every classical measure, it should not be here. The ECB is in a cutting cycle with the deposit rate at 2.50%. Eurozone CPI is at 2.2%. The DE-US 10Y yield spread is -163 basis points - one of the widest structural disadvantages for EUR in over a decade. Every rate differential model says EURUSD should be closer to 1.08-1.10. The fact that it is trading 600 pips above that range is the most important macro signal in FX right now. Something structural has changed. Global central banks and sovereign wealth funds - particularly from the Middle East, Asia, and emerging markets - have been systematically reducing USD exposure since the SWIFT exclusion of Russia in 2022. The Iran war shock of February 2026 accelerated that process. EUR is the deepest and most liquid alternative to USD in global reserve portfolios, and it is absorbing a structural bid that has nothing to do with ECB versus Fed policy. This is the regime that explains the anomaly. De-dollarization flows are non-price-sensitive and do not stop for weekly data releases. They provide a persistent floor under EUR demand that the standard interest rate model cannot see. Two additional forces are reinforcing this bid: Warsh uncertainty - the new Fed Chair has zero established reaction function, keeping institutional dollar positioning tentative - and Brent crude above $110, which signals the Hormuz premium is still active and the geopolitical urgency driving reserve reallocation has not eased. The near-term structure is consolidation between 1.14 and 1.19. No collapse without a hawkish Warsh shock or genuine Hormuz resolution. No breakout above 1.19 without US data deterioration or further geopolitical escalation. Watch Brent and EURGBP daily - they tell you whether the regime is intact before EURUSD price does.

GBPUSD | May 19, 2026 Sterling at 1.3412 - Holding the Line While the Dollar Searches for Direction

GBPUSD | May 19, 2026 Sterling at 1.3412 - Holding the Line While the Dollar Searches for Direction

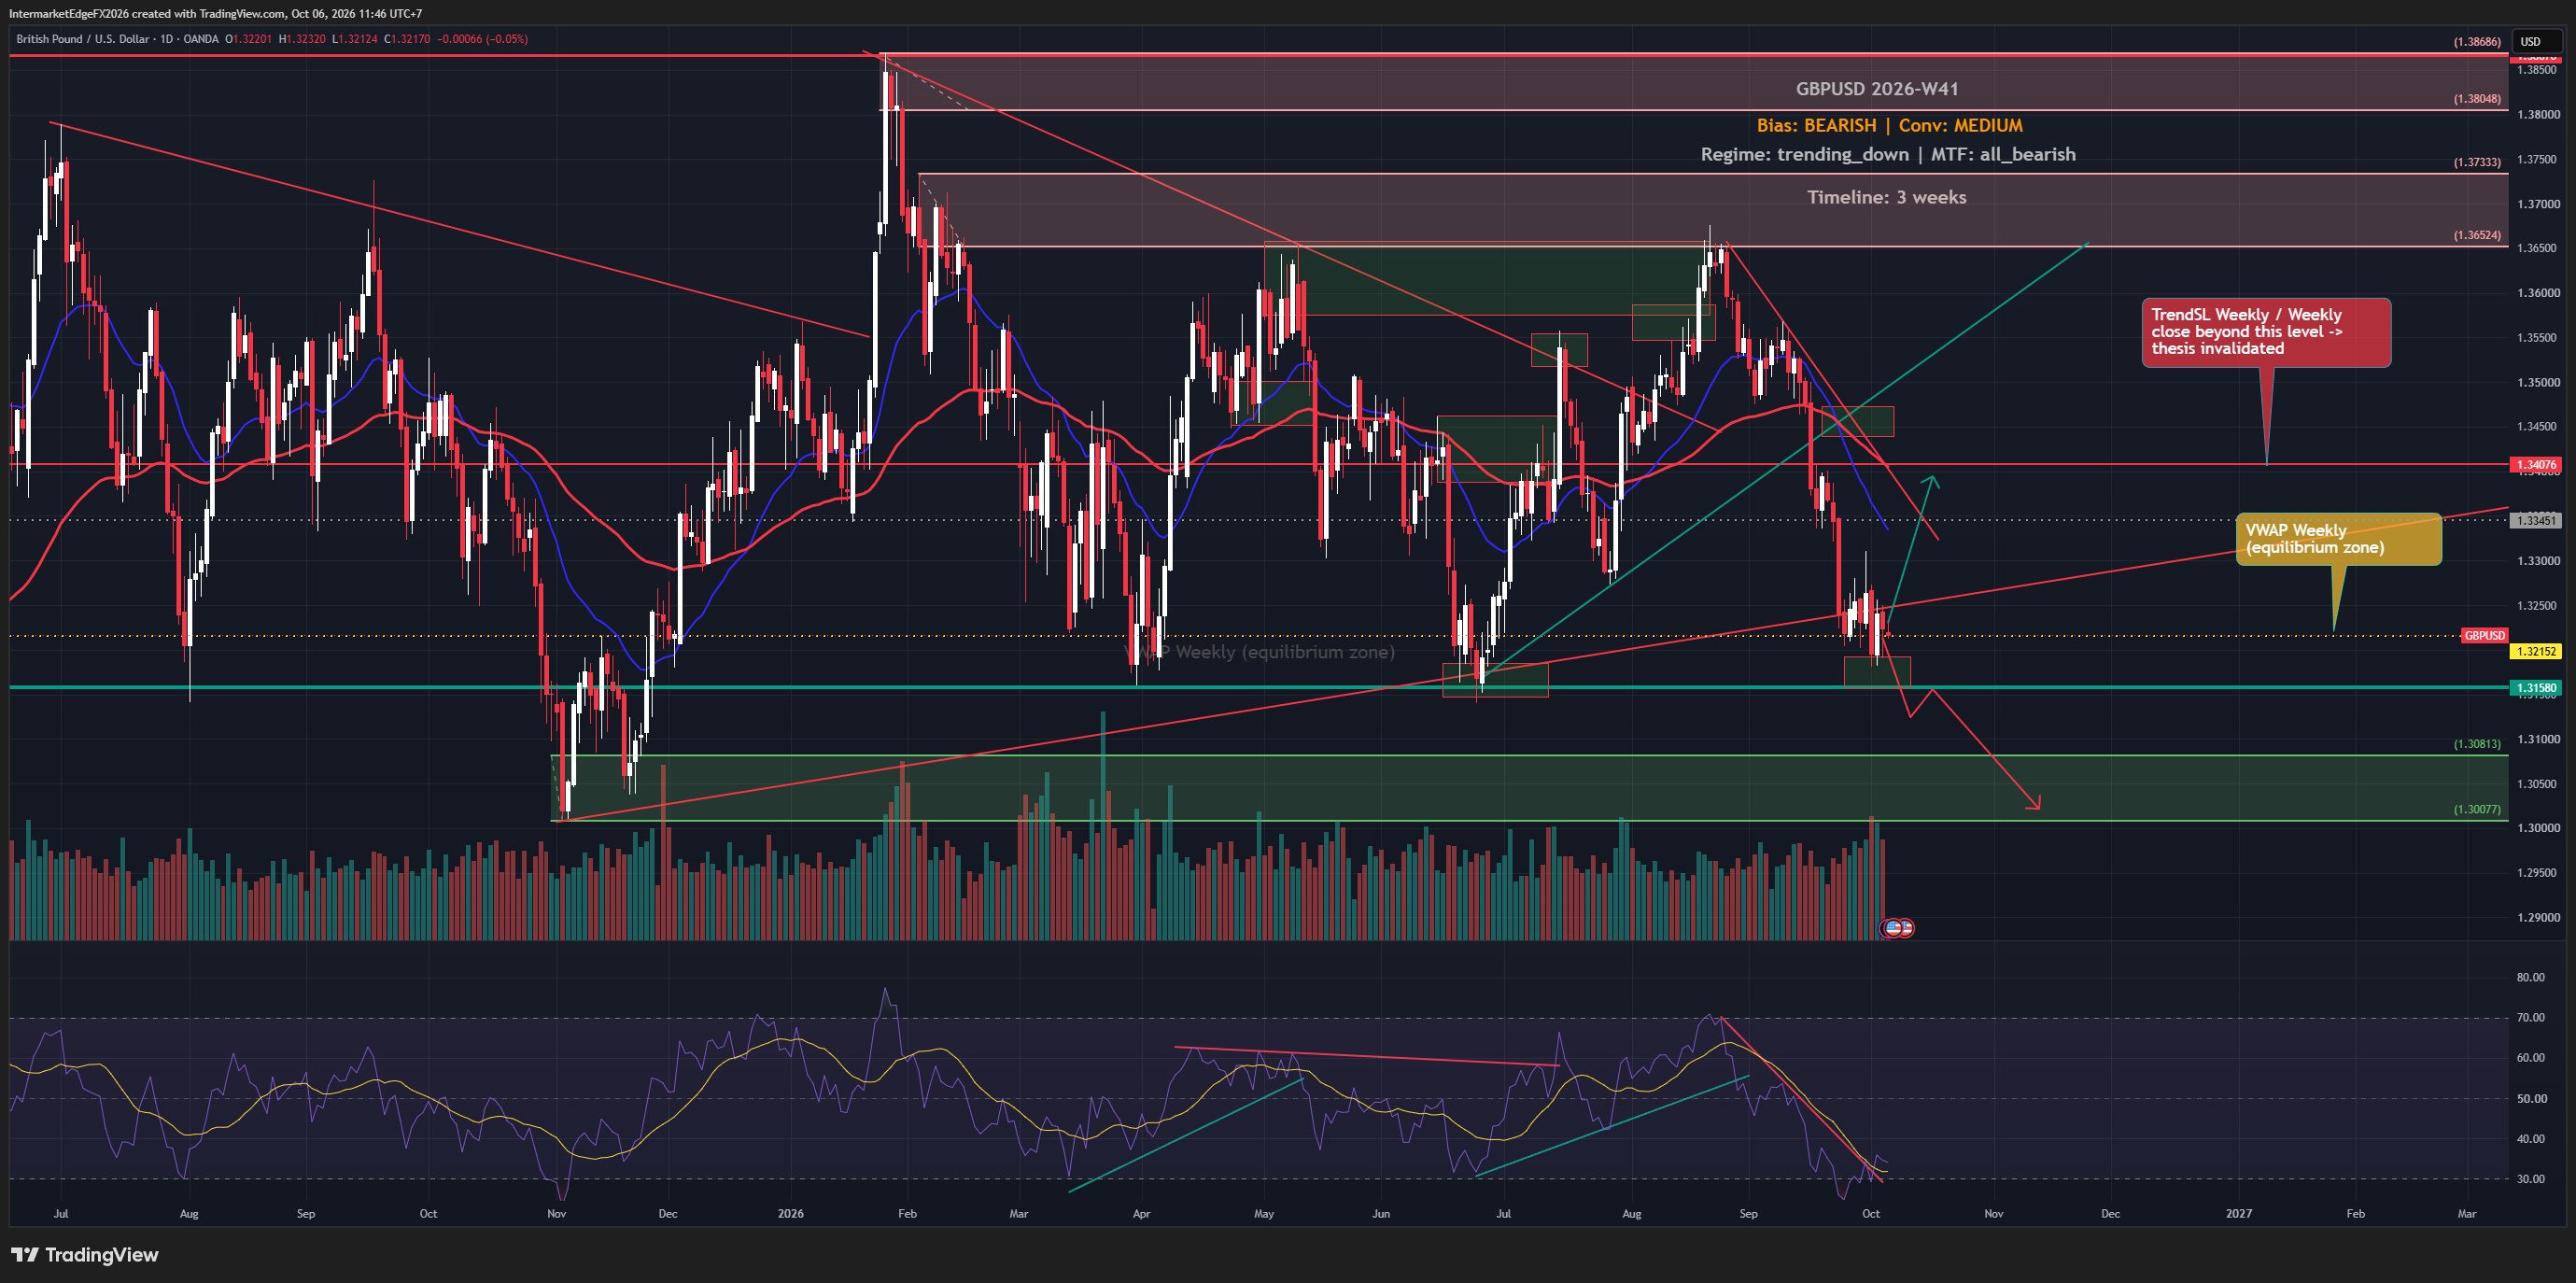
GBPUSD is trading around 1.3412 within a descending wedge structure that has been developing since the January 2026 highs. The pair is now approaching a key compression point, with UK labor market data on May 19 likely to determine the next breakout direction. From a macro perspective, the USD remains trapped in a “stagflationary ambiguity” regime: inflation is still elevated while growth is slowing, leaving the Fed without a clear path forward. Despite higher US yields, DXY remains capped below 100 due to EUR strength and broader de-dollarization flows, indirectly supporting GBPUSD. On the UK side, the economy faces its own stagflation pressures. Inflation remains sticky, growth is weak, and the BoE is stuck in a difficult position — unable to tighten aggressively but not ready to ease either. EURGBP at 0.8682 confirms that GBP has been underperforming EUR, meaning GBPUSD resilience has been driven more by USD weakness than genuine sterling strength. Three major drivers are shaping GBPUSD this week: 1. UK labor data (Claimant Count & Unemployment Rate) Weak data would pressure GBP lower, while stable employment and strong wages could support an upside breakout. 2. USD direction via Fed communication and DXY A move above DXY 100 would create renewed downside pressure on GBPUSD. 3. The wedge compression structure itself The market is nearing the wedge apex, suggesting a significant breakout is likely within 1–2 weeks. Key technical levels: * Resistance: 1.3500 → 1.3727 → 1.3800 * Support: 1.3308 → 1.3196 → 1.2700 Bullish scenario: * UK labor data remains firm and DXY stays below 100 → GBPUSD could break higher toward 1.3500 and potentially 1.3727. Bearish scenario: * UK labor data deteriorates while DXY breaks above 100.48 → GBPUSD could fall below 1.3308 and reopen the path toward the 1.28 region. Overall, the technical structure remains moderately bullish, but the fundamental outlook is still heavily dependent on UK labor data and the bro

The Dollar at 98.78 - Warsh Era Begins, Dollar Searches for Direction

The Dollar at 98.78 - Warsh Era Begins, Dollar Searches for Direction

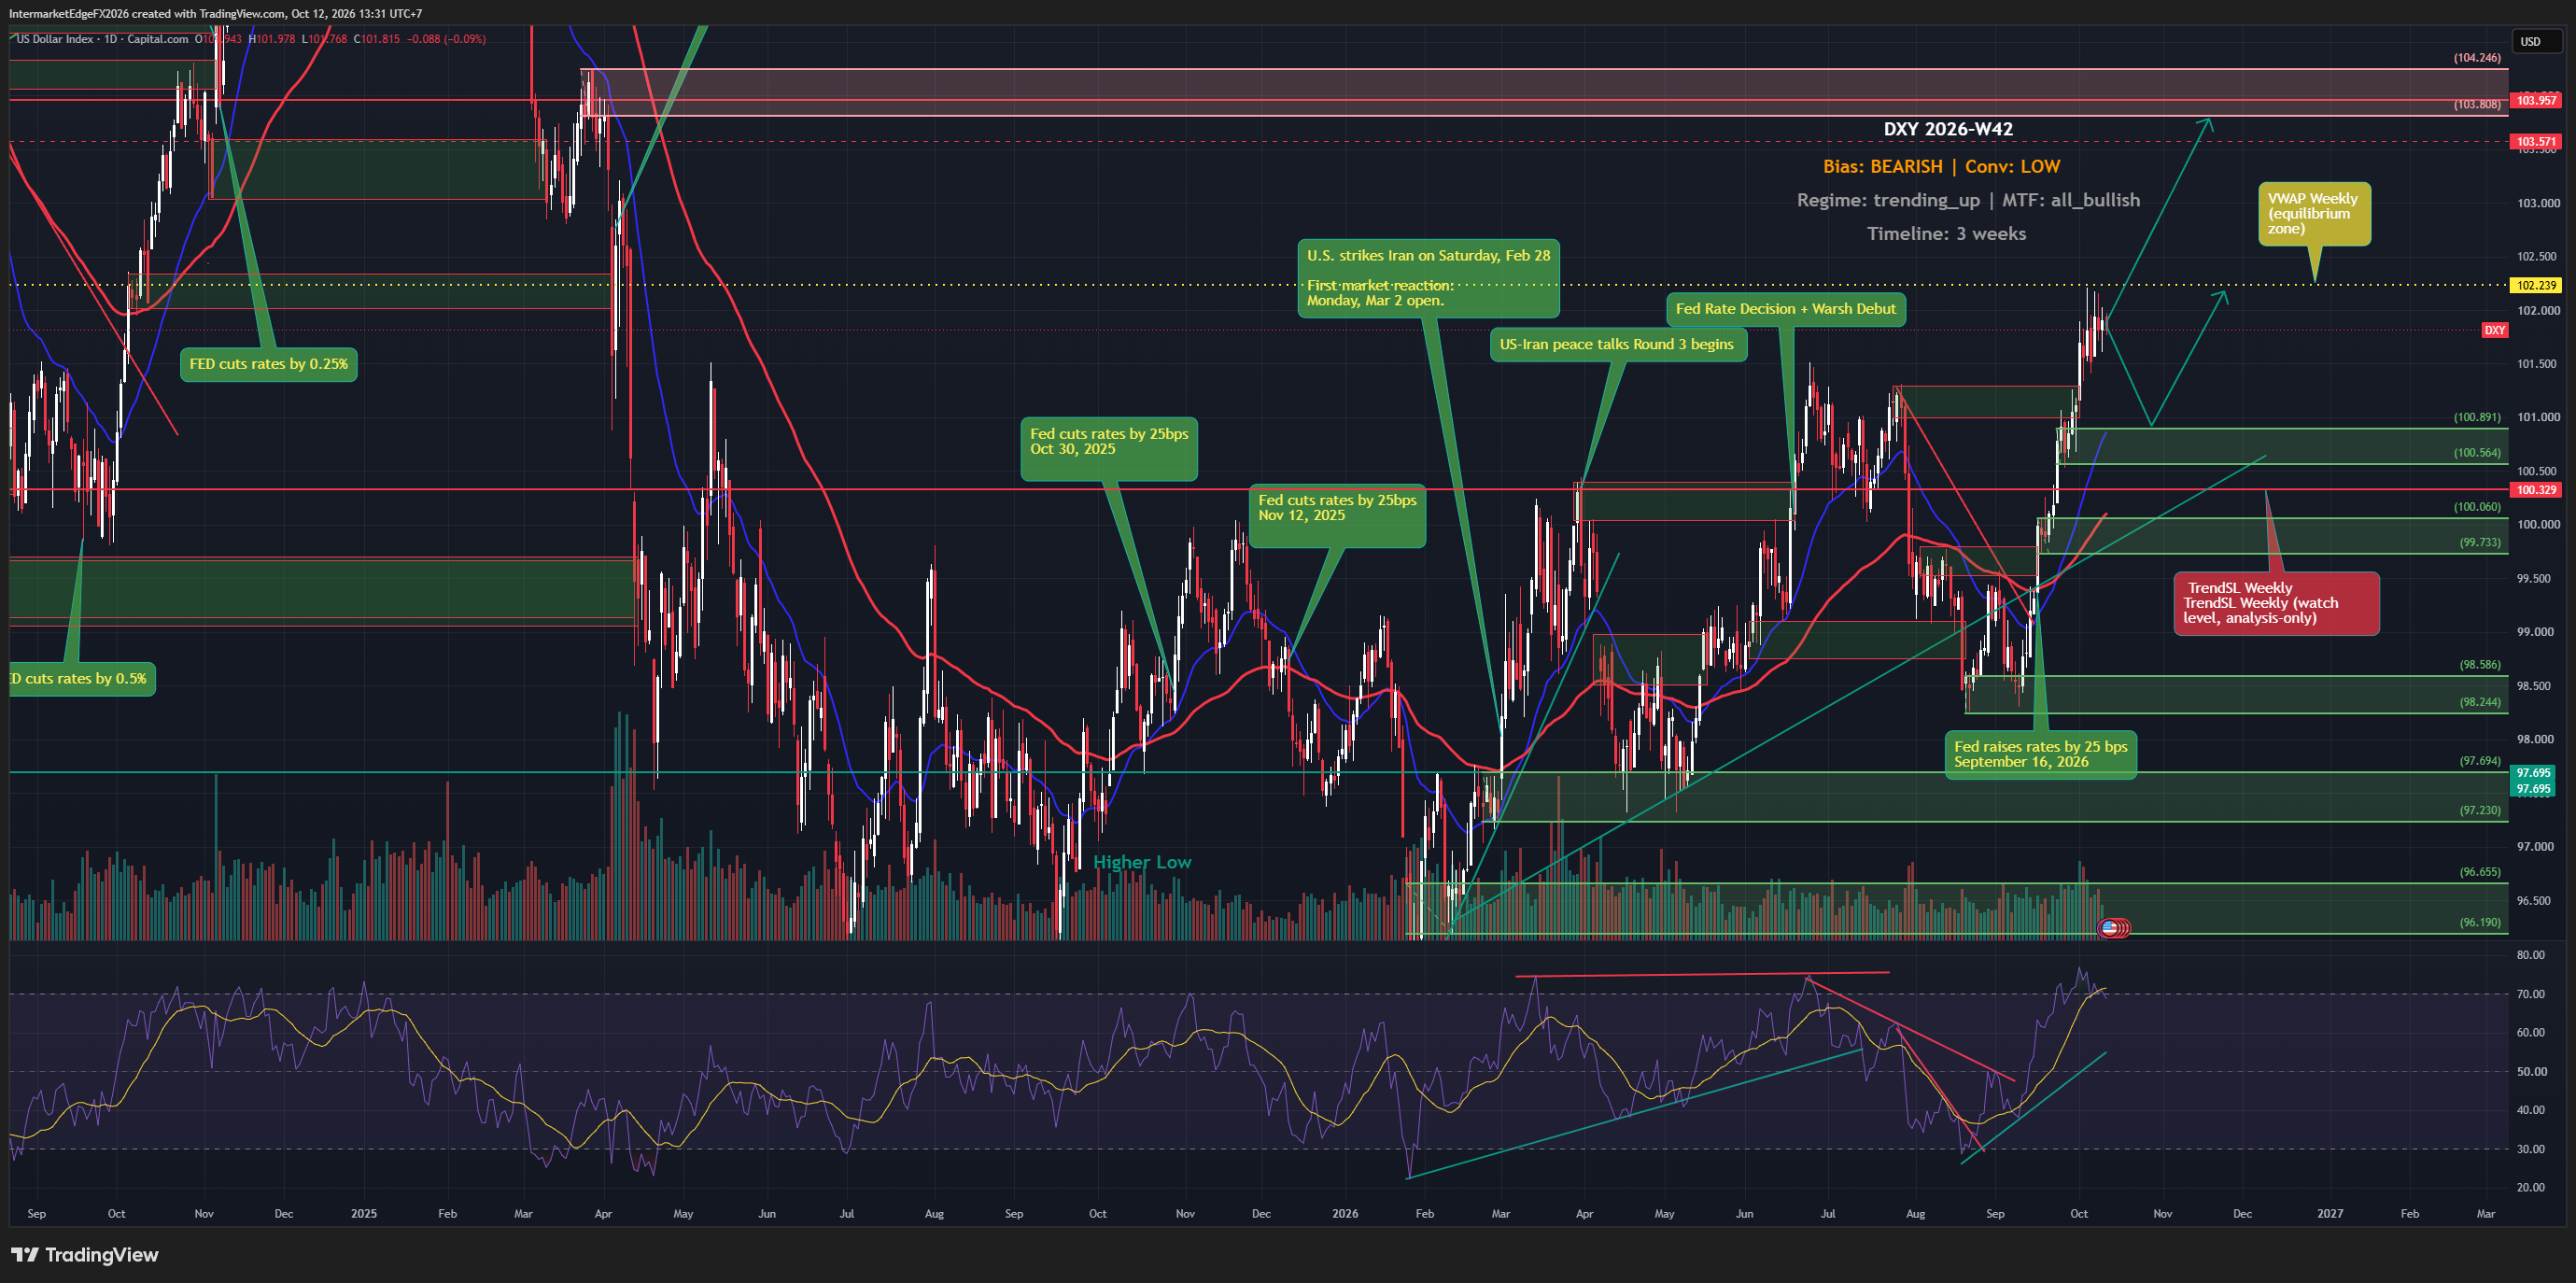
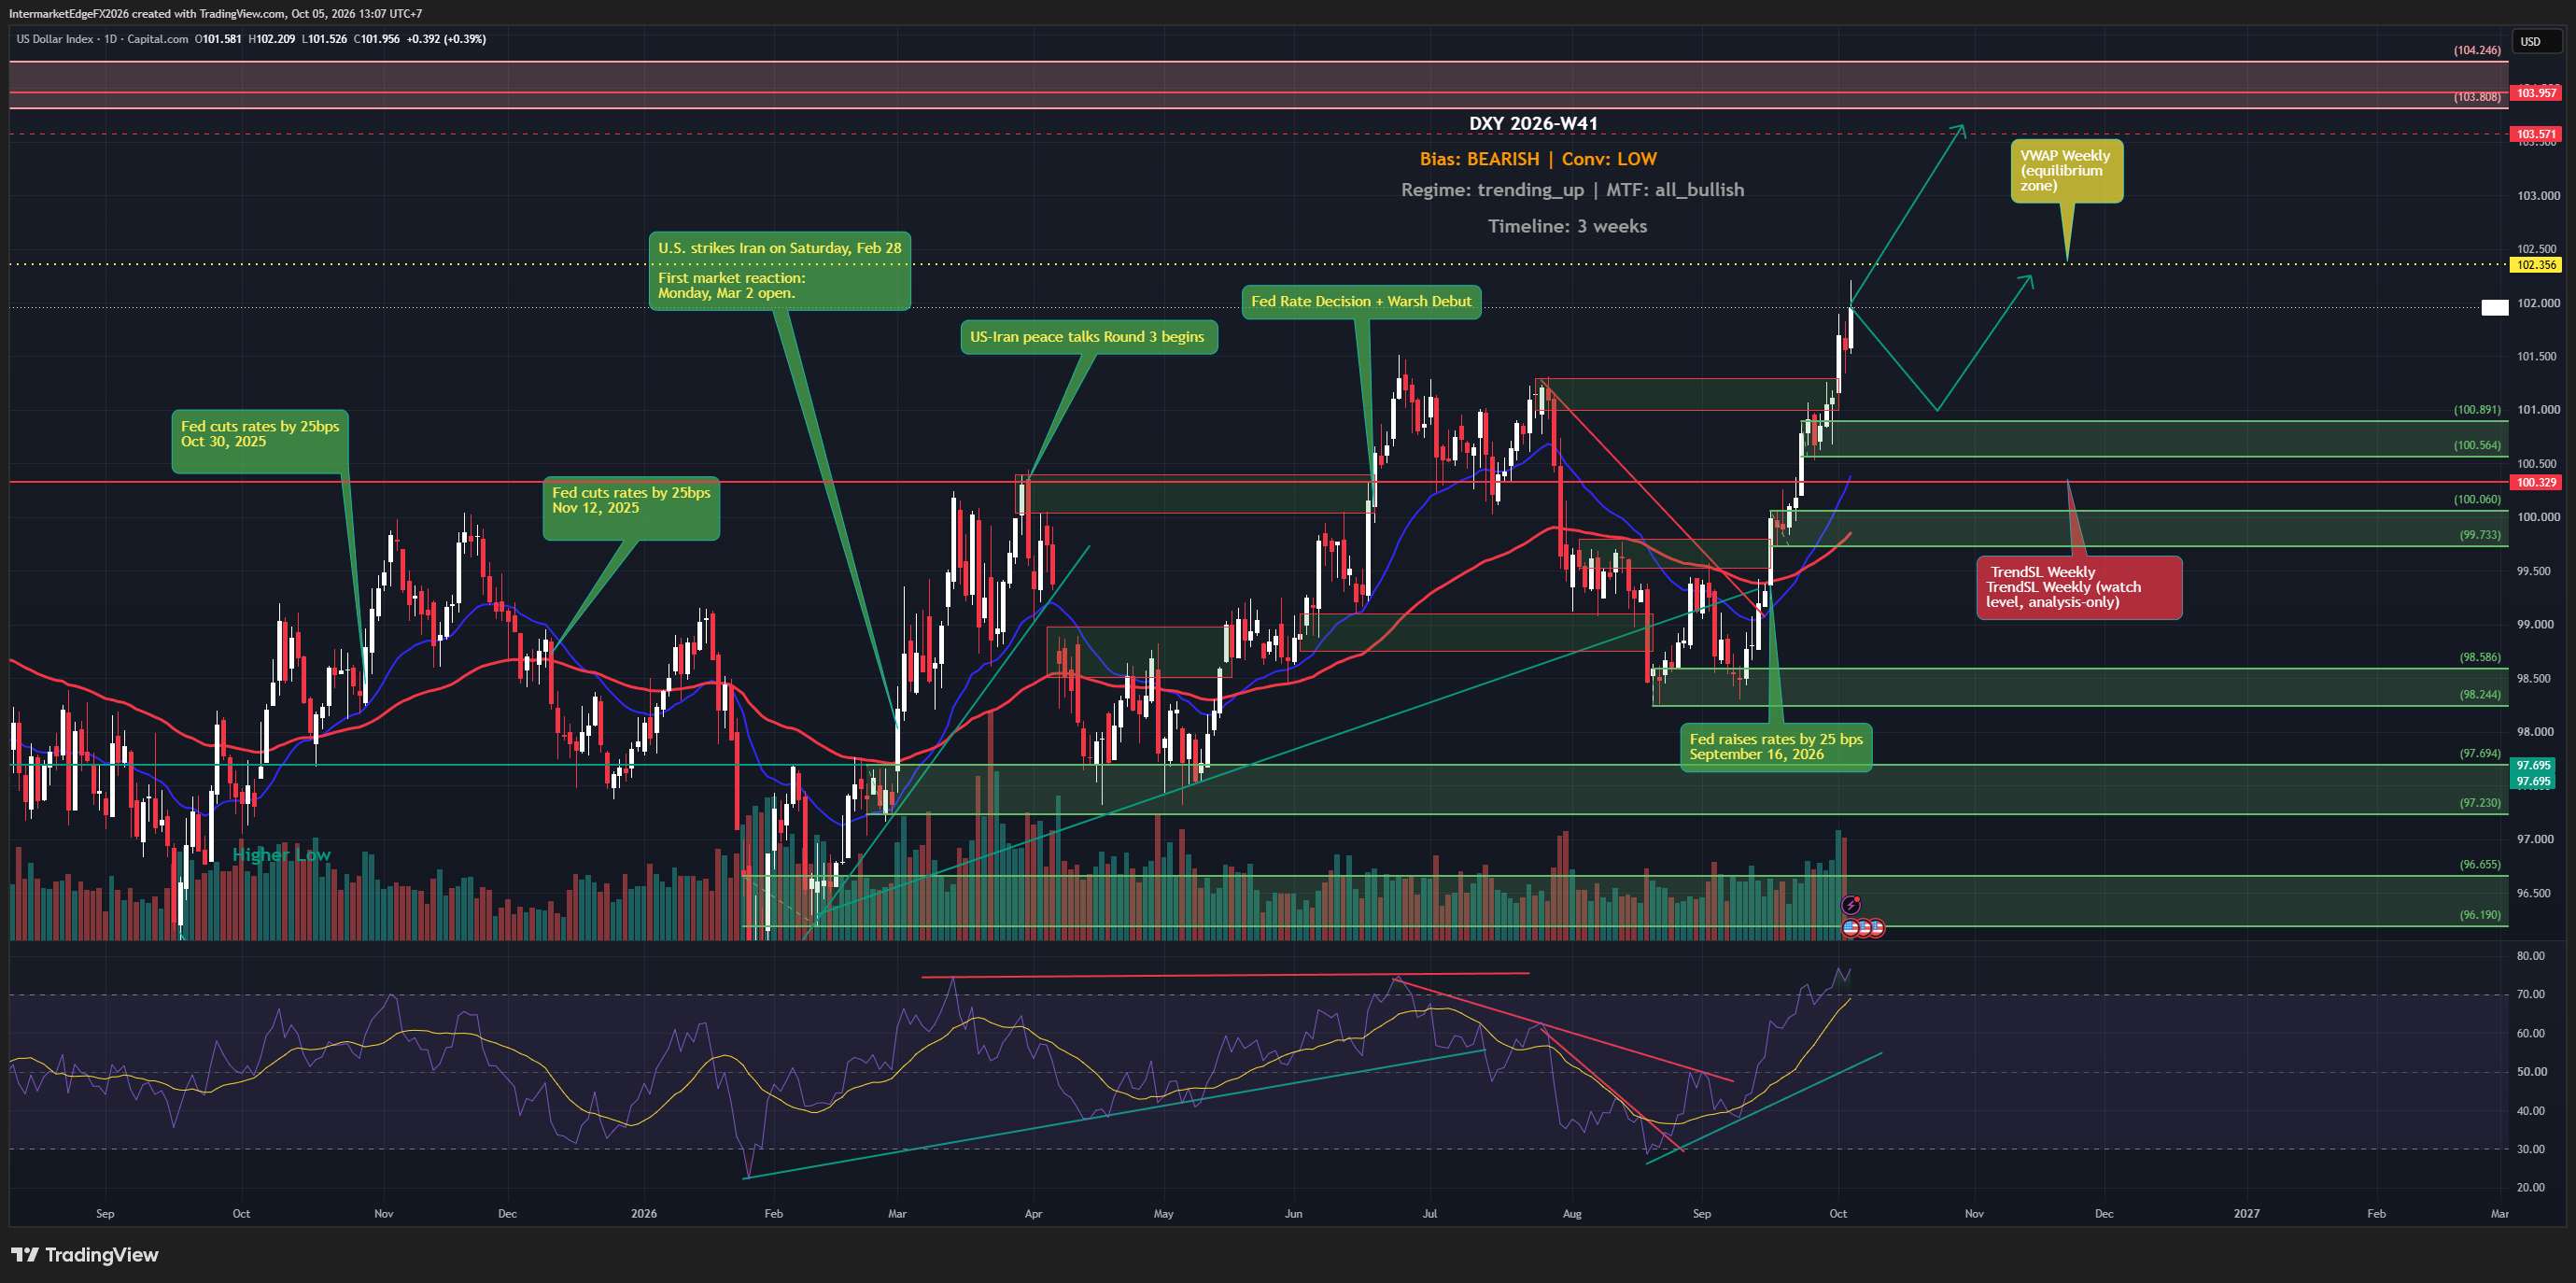
**DXY | Weekly Outlook - May 19, 2026** DXY is at 98.78. By every classical input it should be higher. That gap between where the dollar is and where the macro narrative says it should be is the most important question in FX this week. The United States has a new Fed Chair with a hawkish reputation. April CPI printed at 3.8%. CME FedWatch is pricing 40% probability of a rate hike by April 2027. In any previous tightening cycle, this configuration produces a stronger dollar. Yet DXY has been unable to reclaim 100 for nearly three months - since the Iran war began in late February and restructured the way institutional allocators think about reserve assets. What is holding DXY below 100 is not weakness in the US economy. It is the mechanical weight of EURUSD at 1.1651 - which alone accounts for 57.6% of the index - combined with a de-dollarization structural bid from EM central banks and sovereign wealth funds that does not respond to weekly rate moves. Global yields are also rising in parallel across DE10Y, JP10Y, and UK10Y, which limits the relative yield advantage that would normally drive institutional dollar buying. The regime is Stagflationary Dollar Ambiguity. Two forces are fighting simultaneously and neither has won: the inflation case for dollar strength and the geopolitical case for reserve asset diversification away from USD. This week, the resolution comes from one event: FOMC Member Waller speaks Tuesday May 19. Three scenarios - hawkish confirmation sends DXY toward 99.62 then 100.48, ambiguity keeps the range, dovish surprise breaks 97.695 support. Conviction is Medium-Low. This is not a week for directional dollar positioning ahead of Tuesday.

Gold at $4,553 - What Is the Market Still Pricing In?

Gold at $4,553 - What Is the Market Still Pricing In?

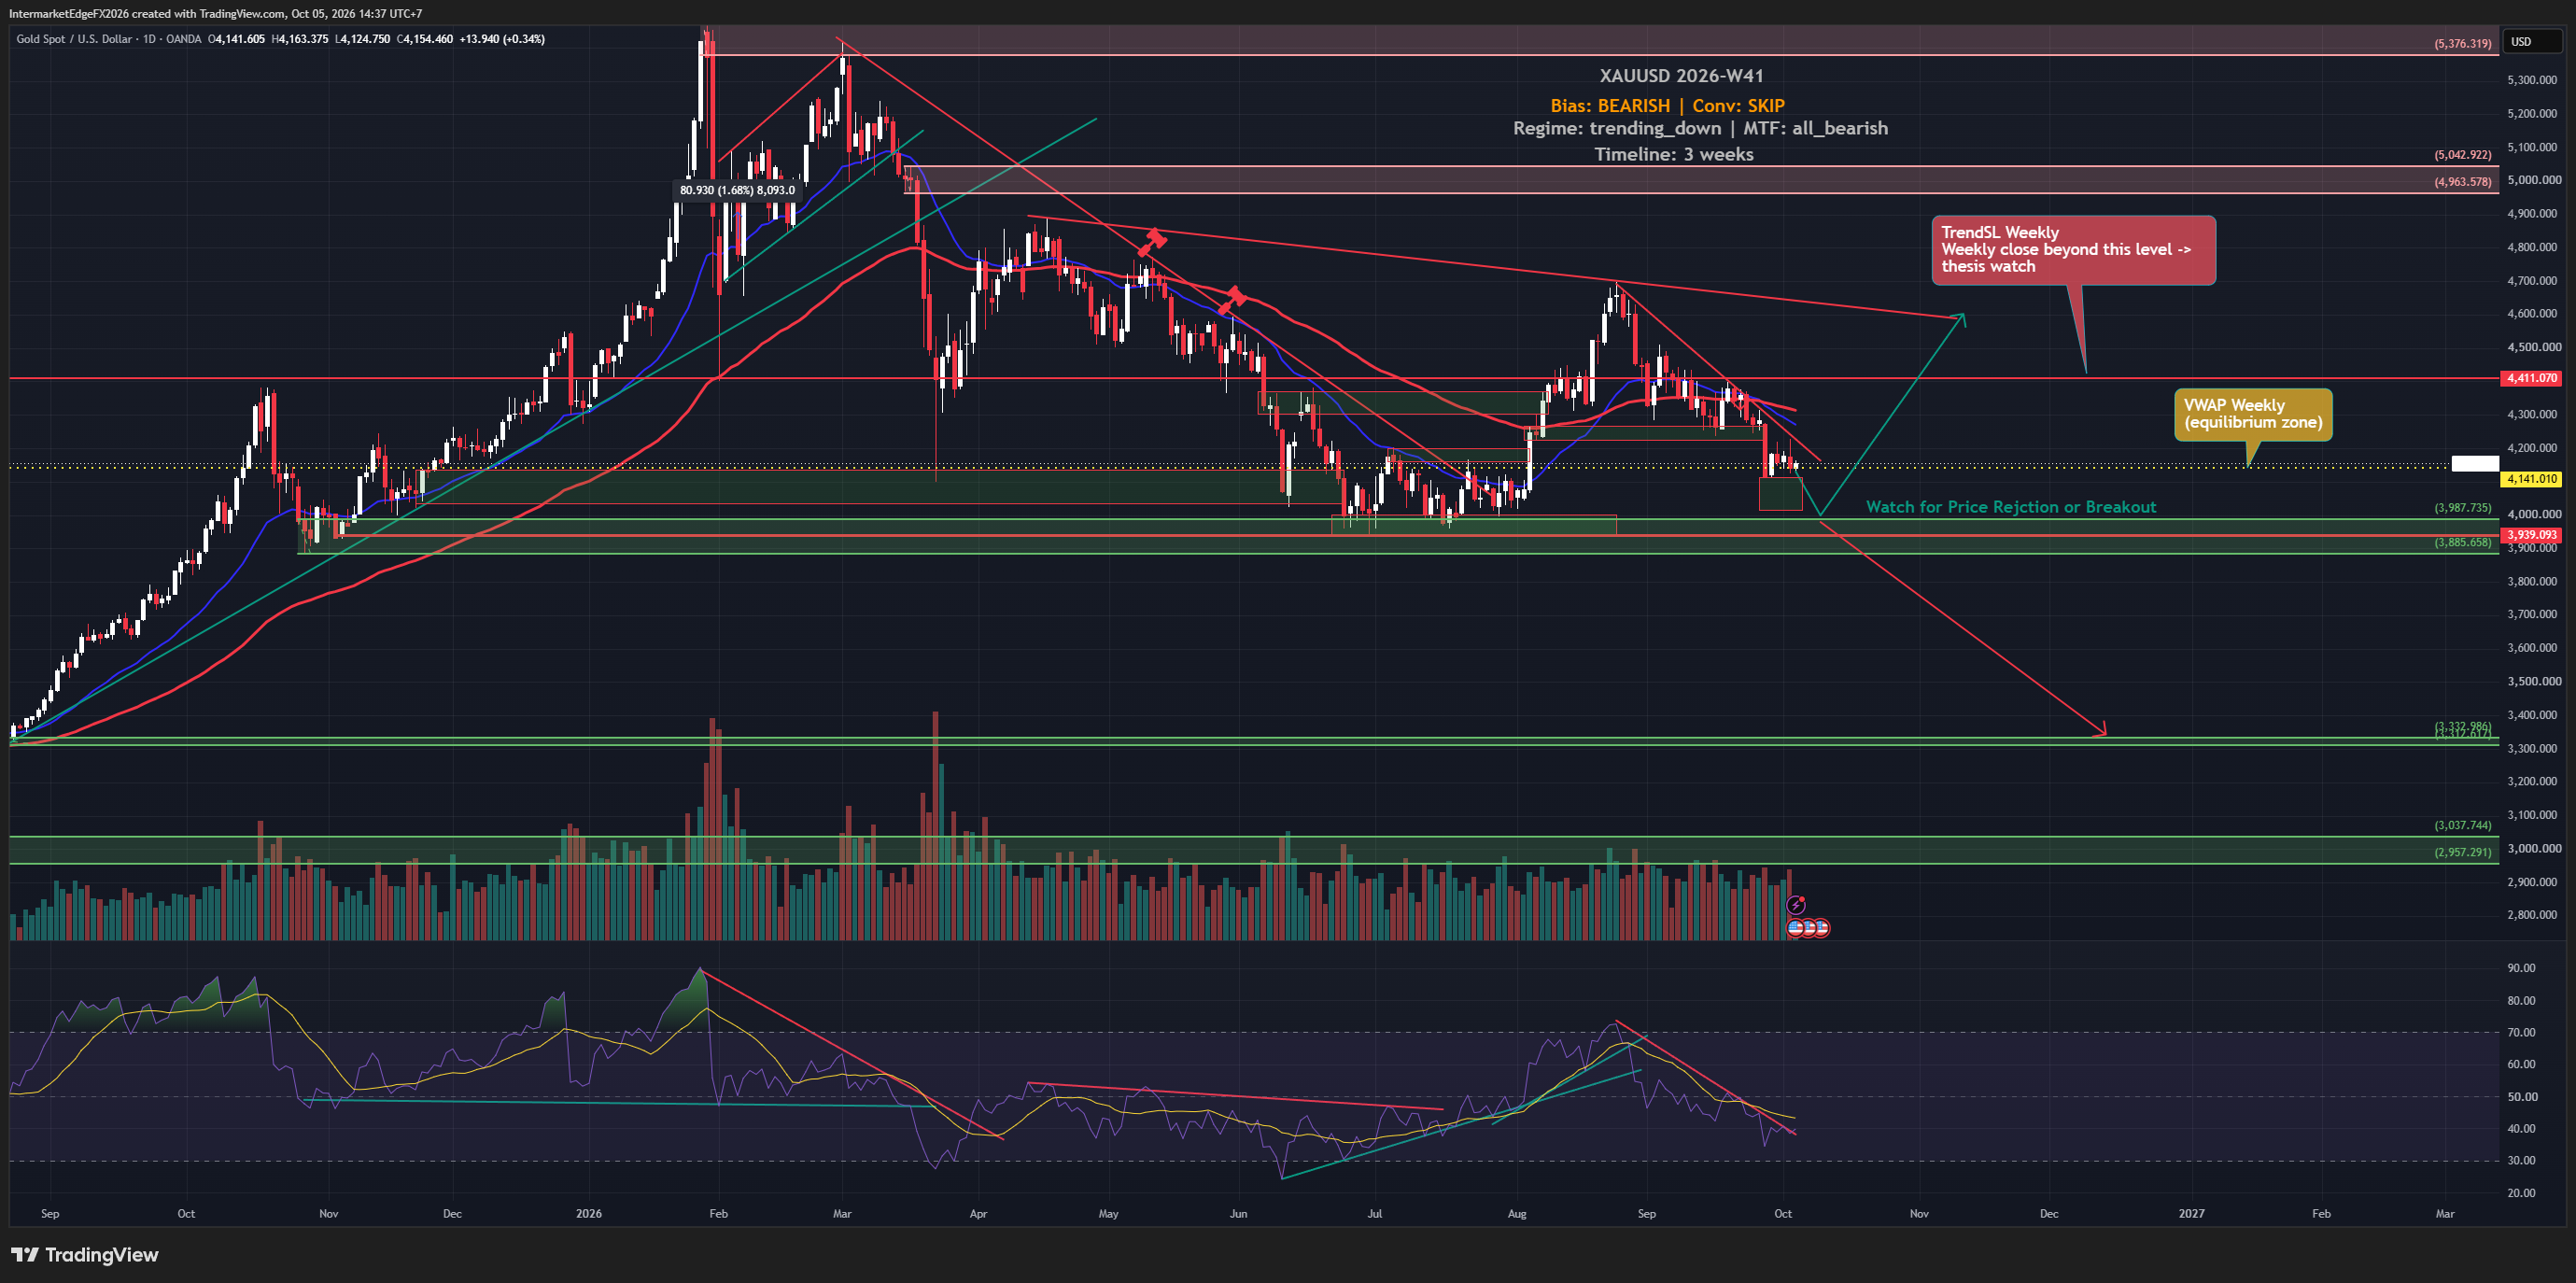
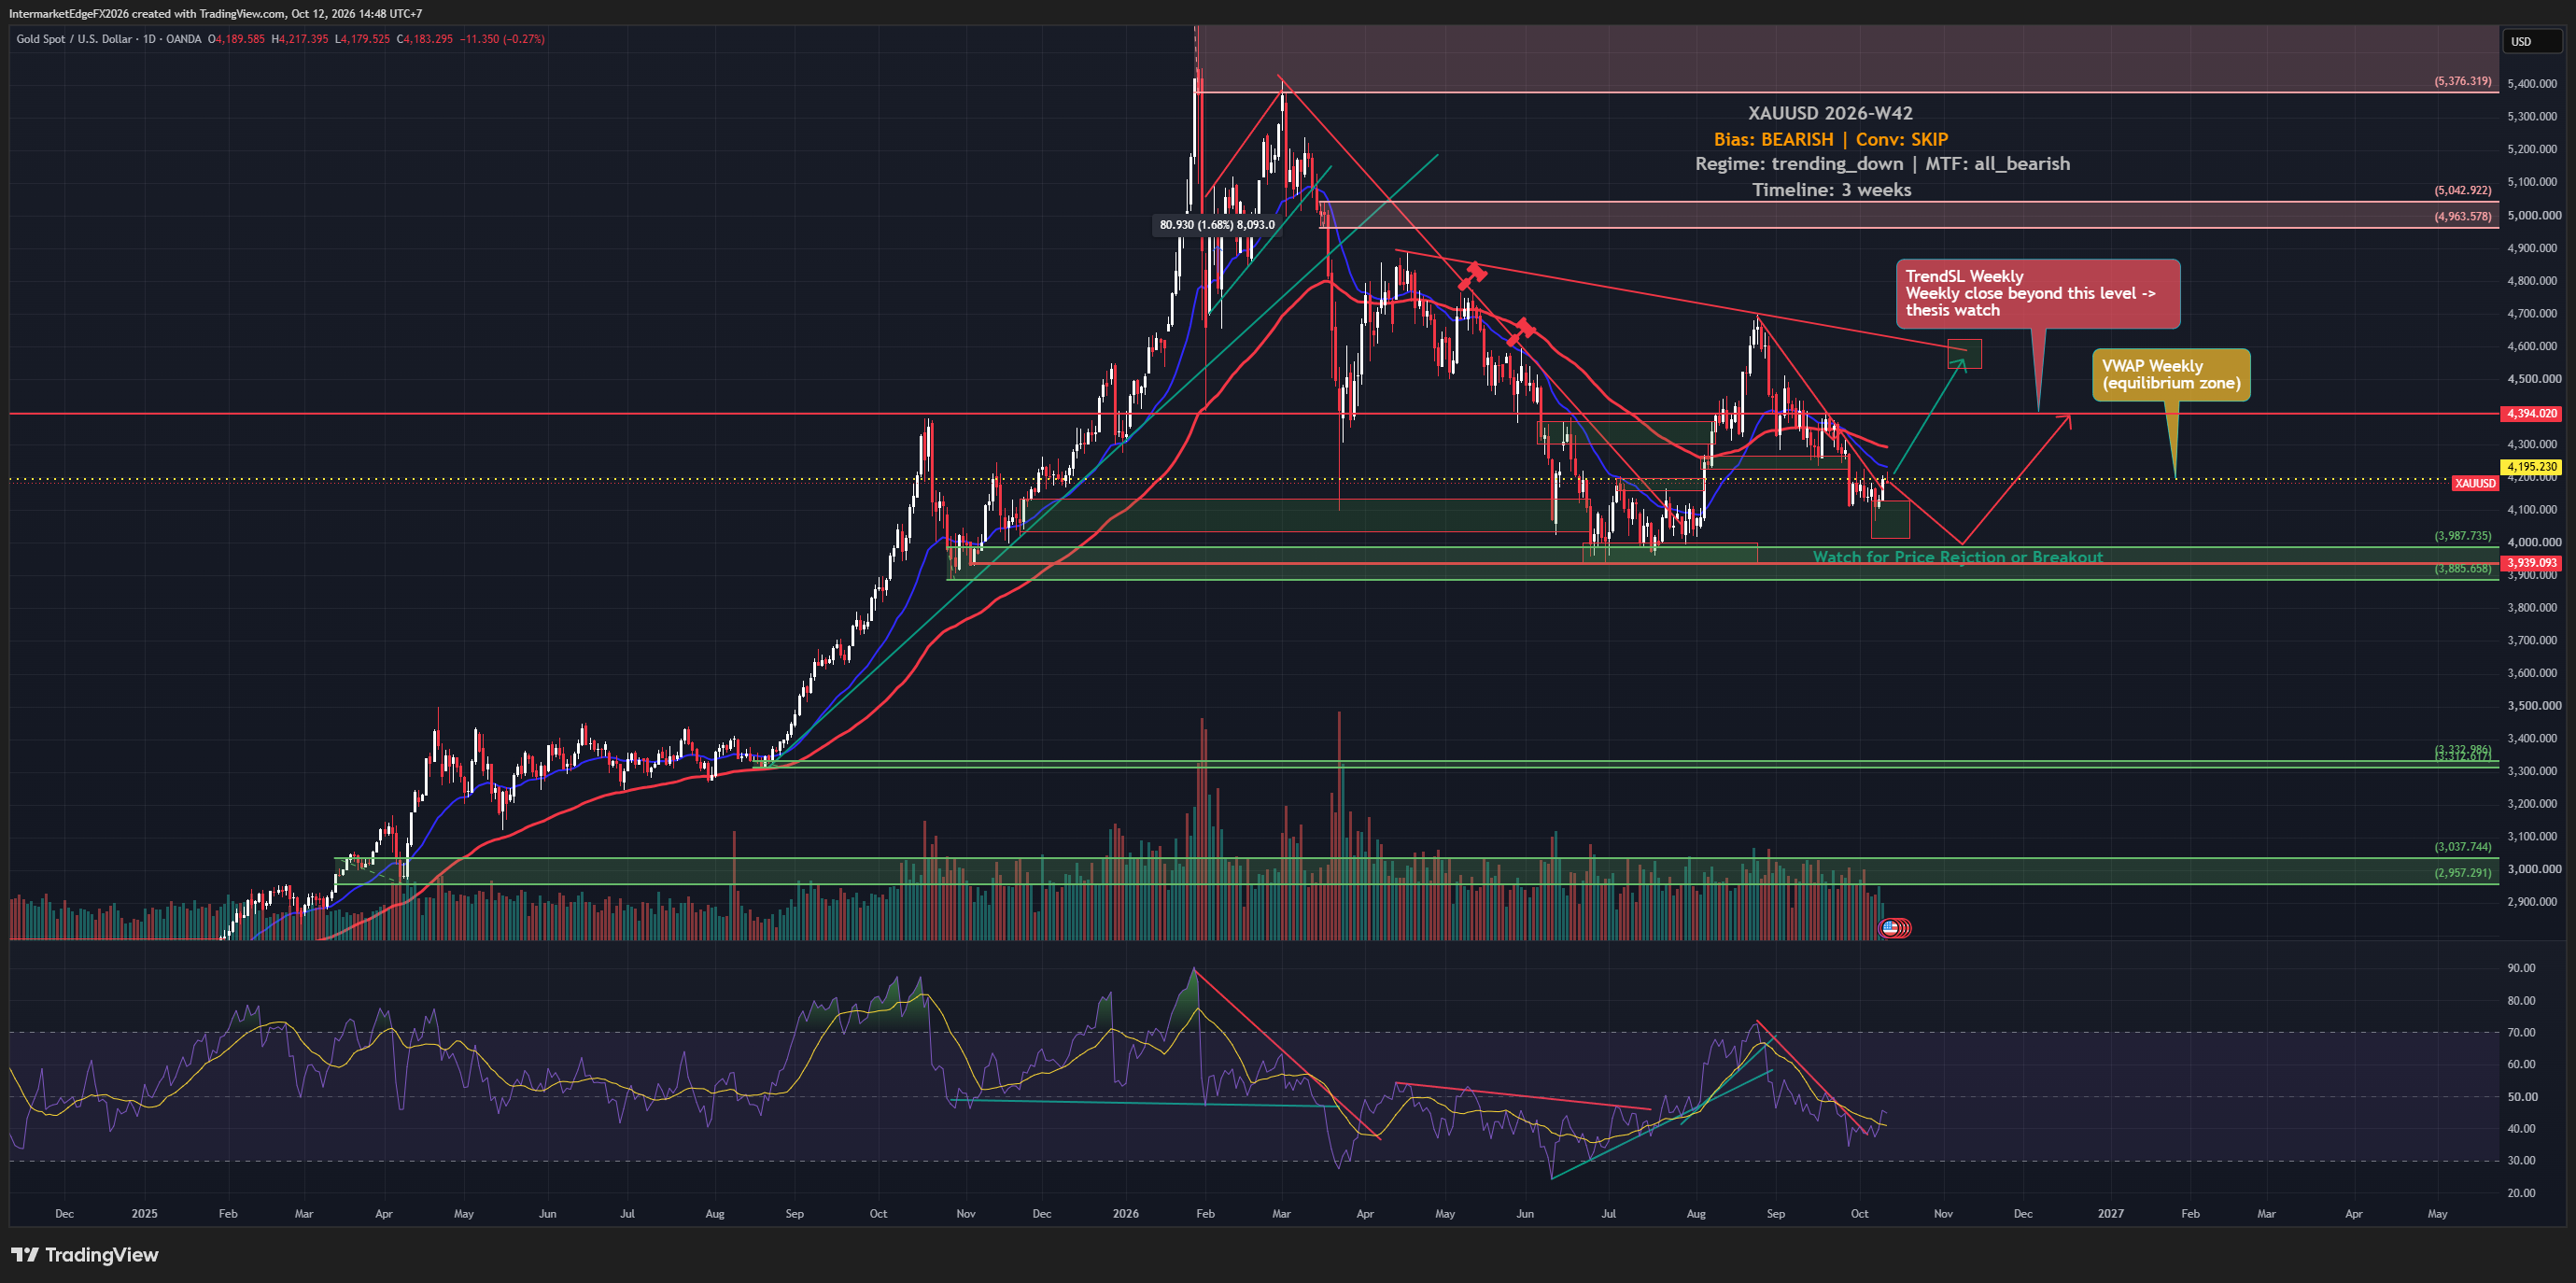
**XAUUSD | Weekly Outlook - May 19, 2026** Gold at $4,553 is not a speculative bubble price. It is a regime price - and understanding that distinction is the entire thesis of this analysis. Six months ago, $4,500 gold was a tail-risk scenario in institutional forecasting models. Today it is the base. The forces that drove it here - central bank accumulation running since 2022, the Hormuz geopolitical premium keeping Brent above $110, Warsh uncertainty creating a genuine unknown about the real yield path, and a structural de-dollarization bid from EM central banks and sovereign wealth funds - have not reversed. They are still active, still measurable, and still doing heavy lifting that the yield math alone cannot explain. What makes this regime unusual is that gold is holding all-time highs despite positive real yields. Classical monetary theory says this should not be happening. The fact that it is tells you the geopolitical and reserve asset restructuring layers are overriding the standard yield-gold relationship. This week, the directional catalyst is singular: FOMC Member Waller speaks Tuesday May 19. If he signals hikes are genuinely on the table for 2026, gold faces -$100 to -$150 intraday risk as the market reprices the real yield assumption embedded in current prices. If he maintains ambiguity, the $4,650-$4,700 upside target remains in play. Key support at $4,420. Invalidation on daily close below that level. Conviction: Medium-High. Structure favors the long side. Timing is Tuesday.

InterMarketEdge

© 2026 InterMarketEdge. Financial intelligence for inter-market traders.