Instrument Deep Dive SLUG — InterMarketEdge

Instrument Deep Dive SLUG

Full L0–L8 structural analysis on a single instrument — conviction, invalidation, and time horizon

USDCAD: Canadian Dollar Hits Six-Week Low as USMCA Headline Risk Grows - USDCAD at the Crossroads of Oil Decompression and Dollar Structural Bid

USDCAD: Canadian Dollar Hits Six-Week Low as USMCA Headline Risk Grows - USDCAD at the Crossroads of Oil Decompression and Dollar Structural Bid

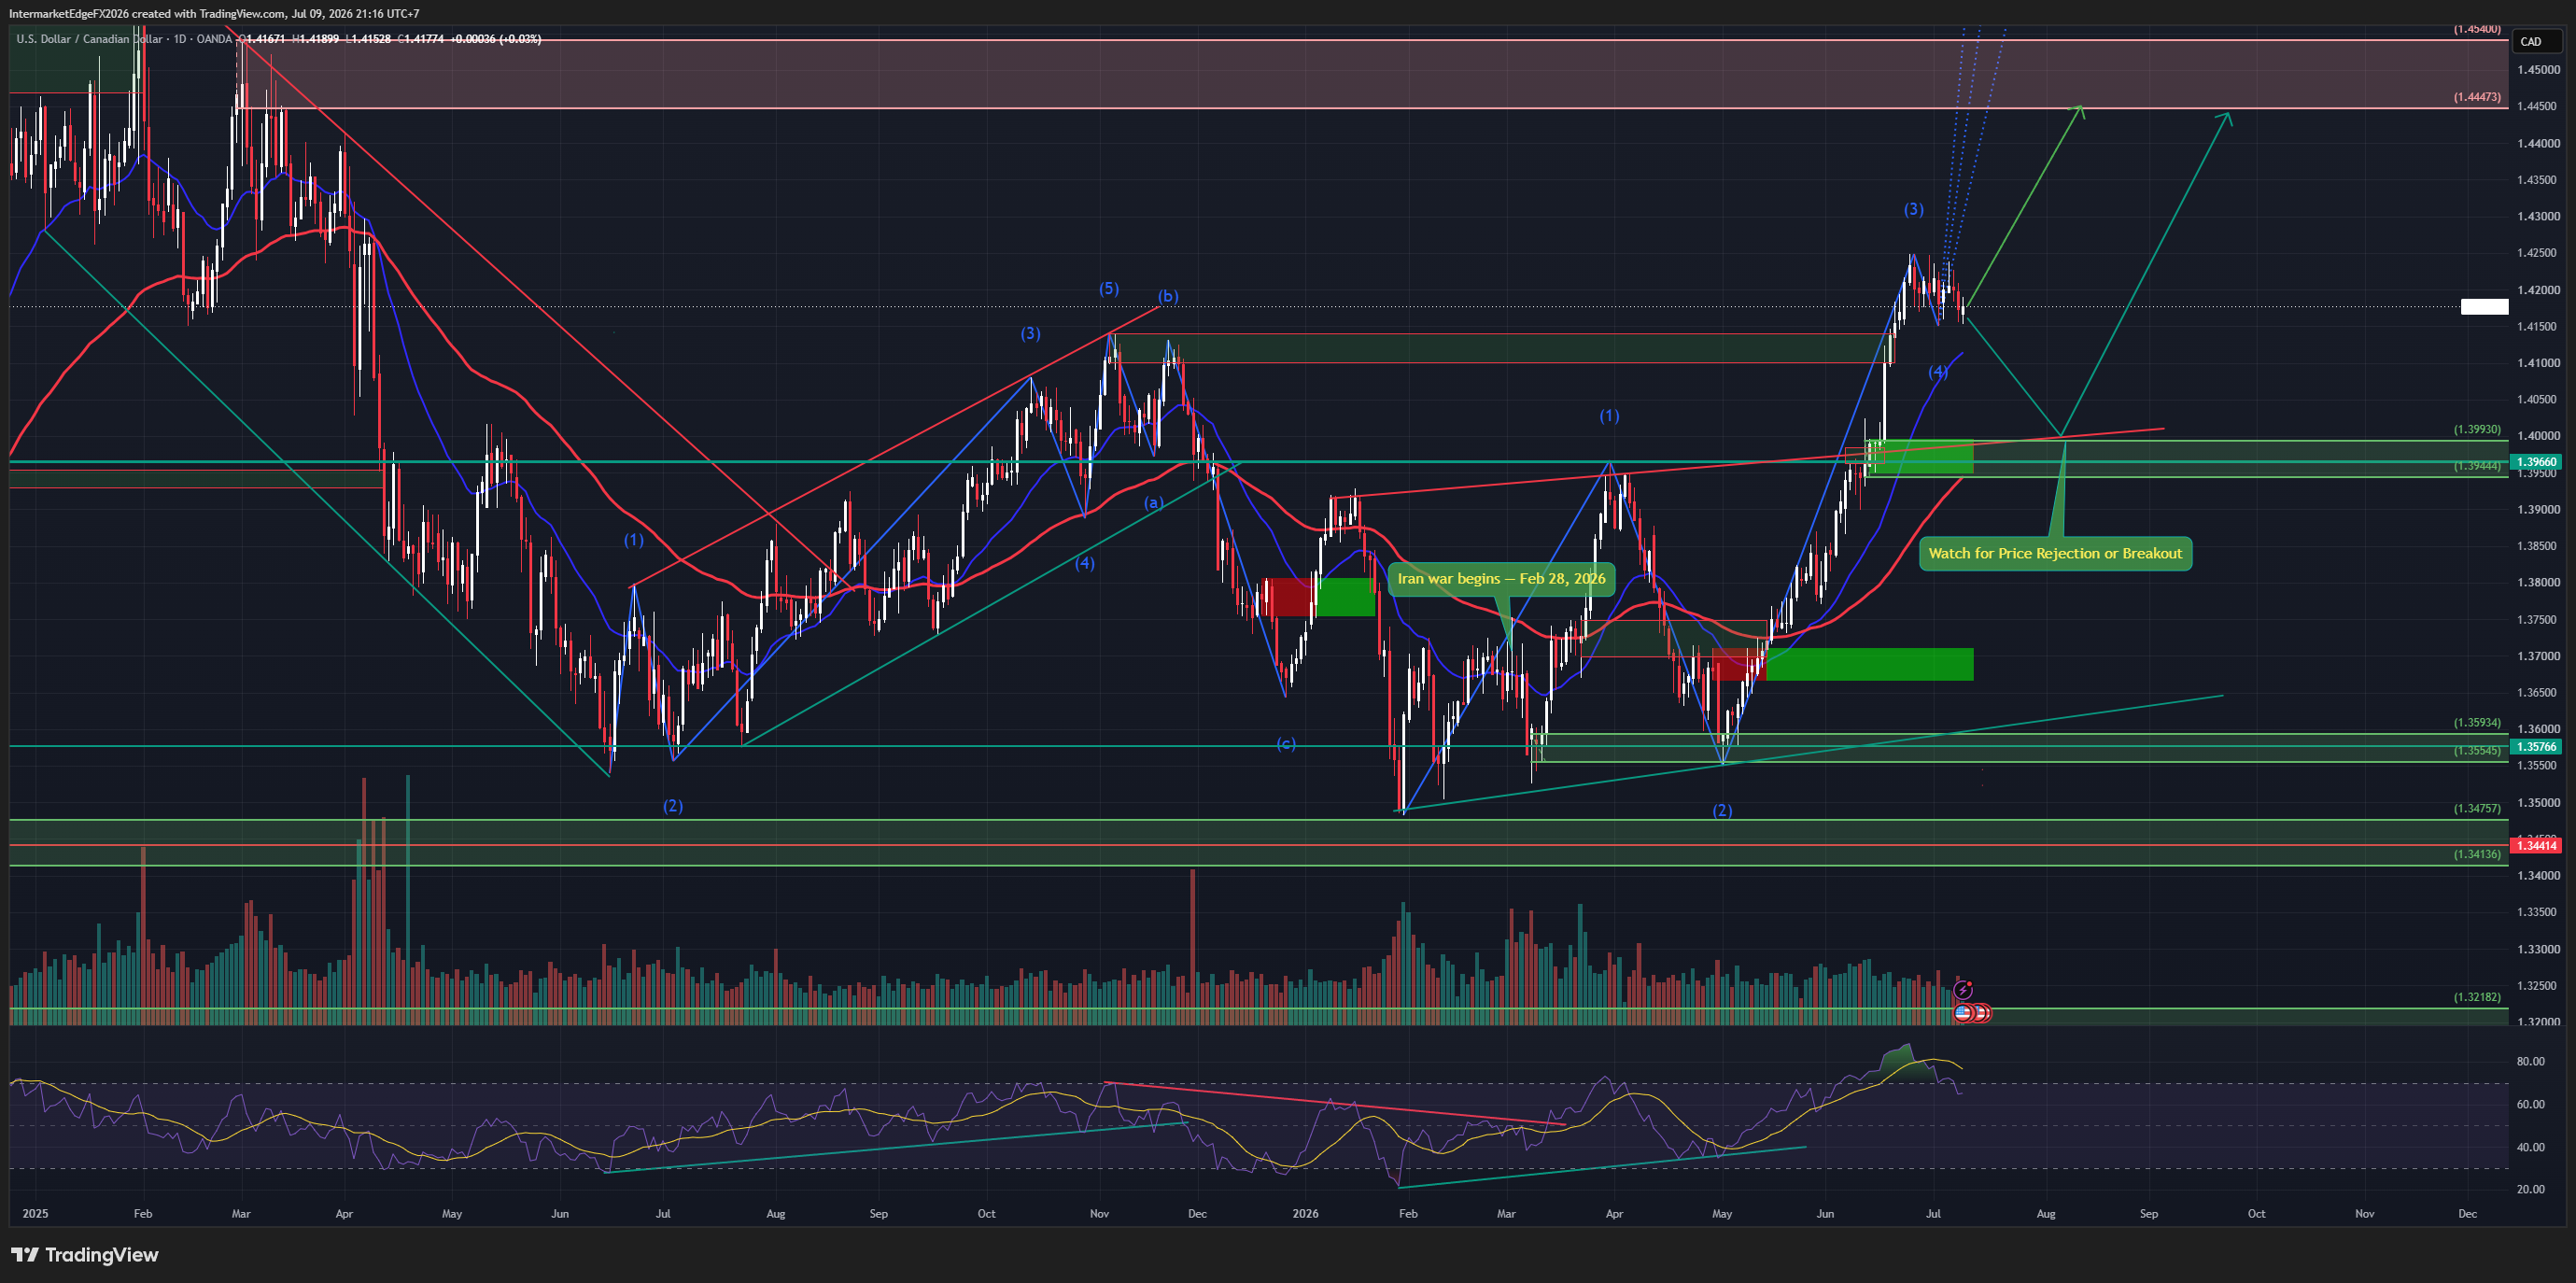
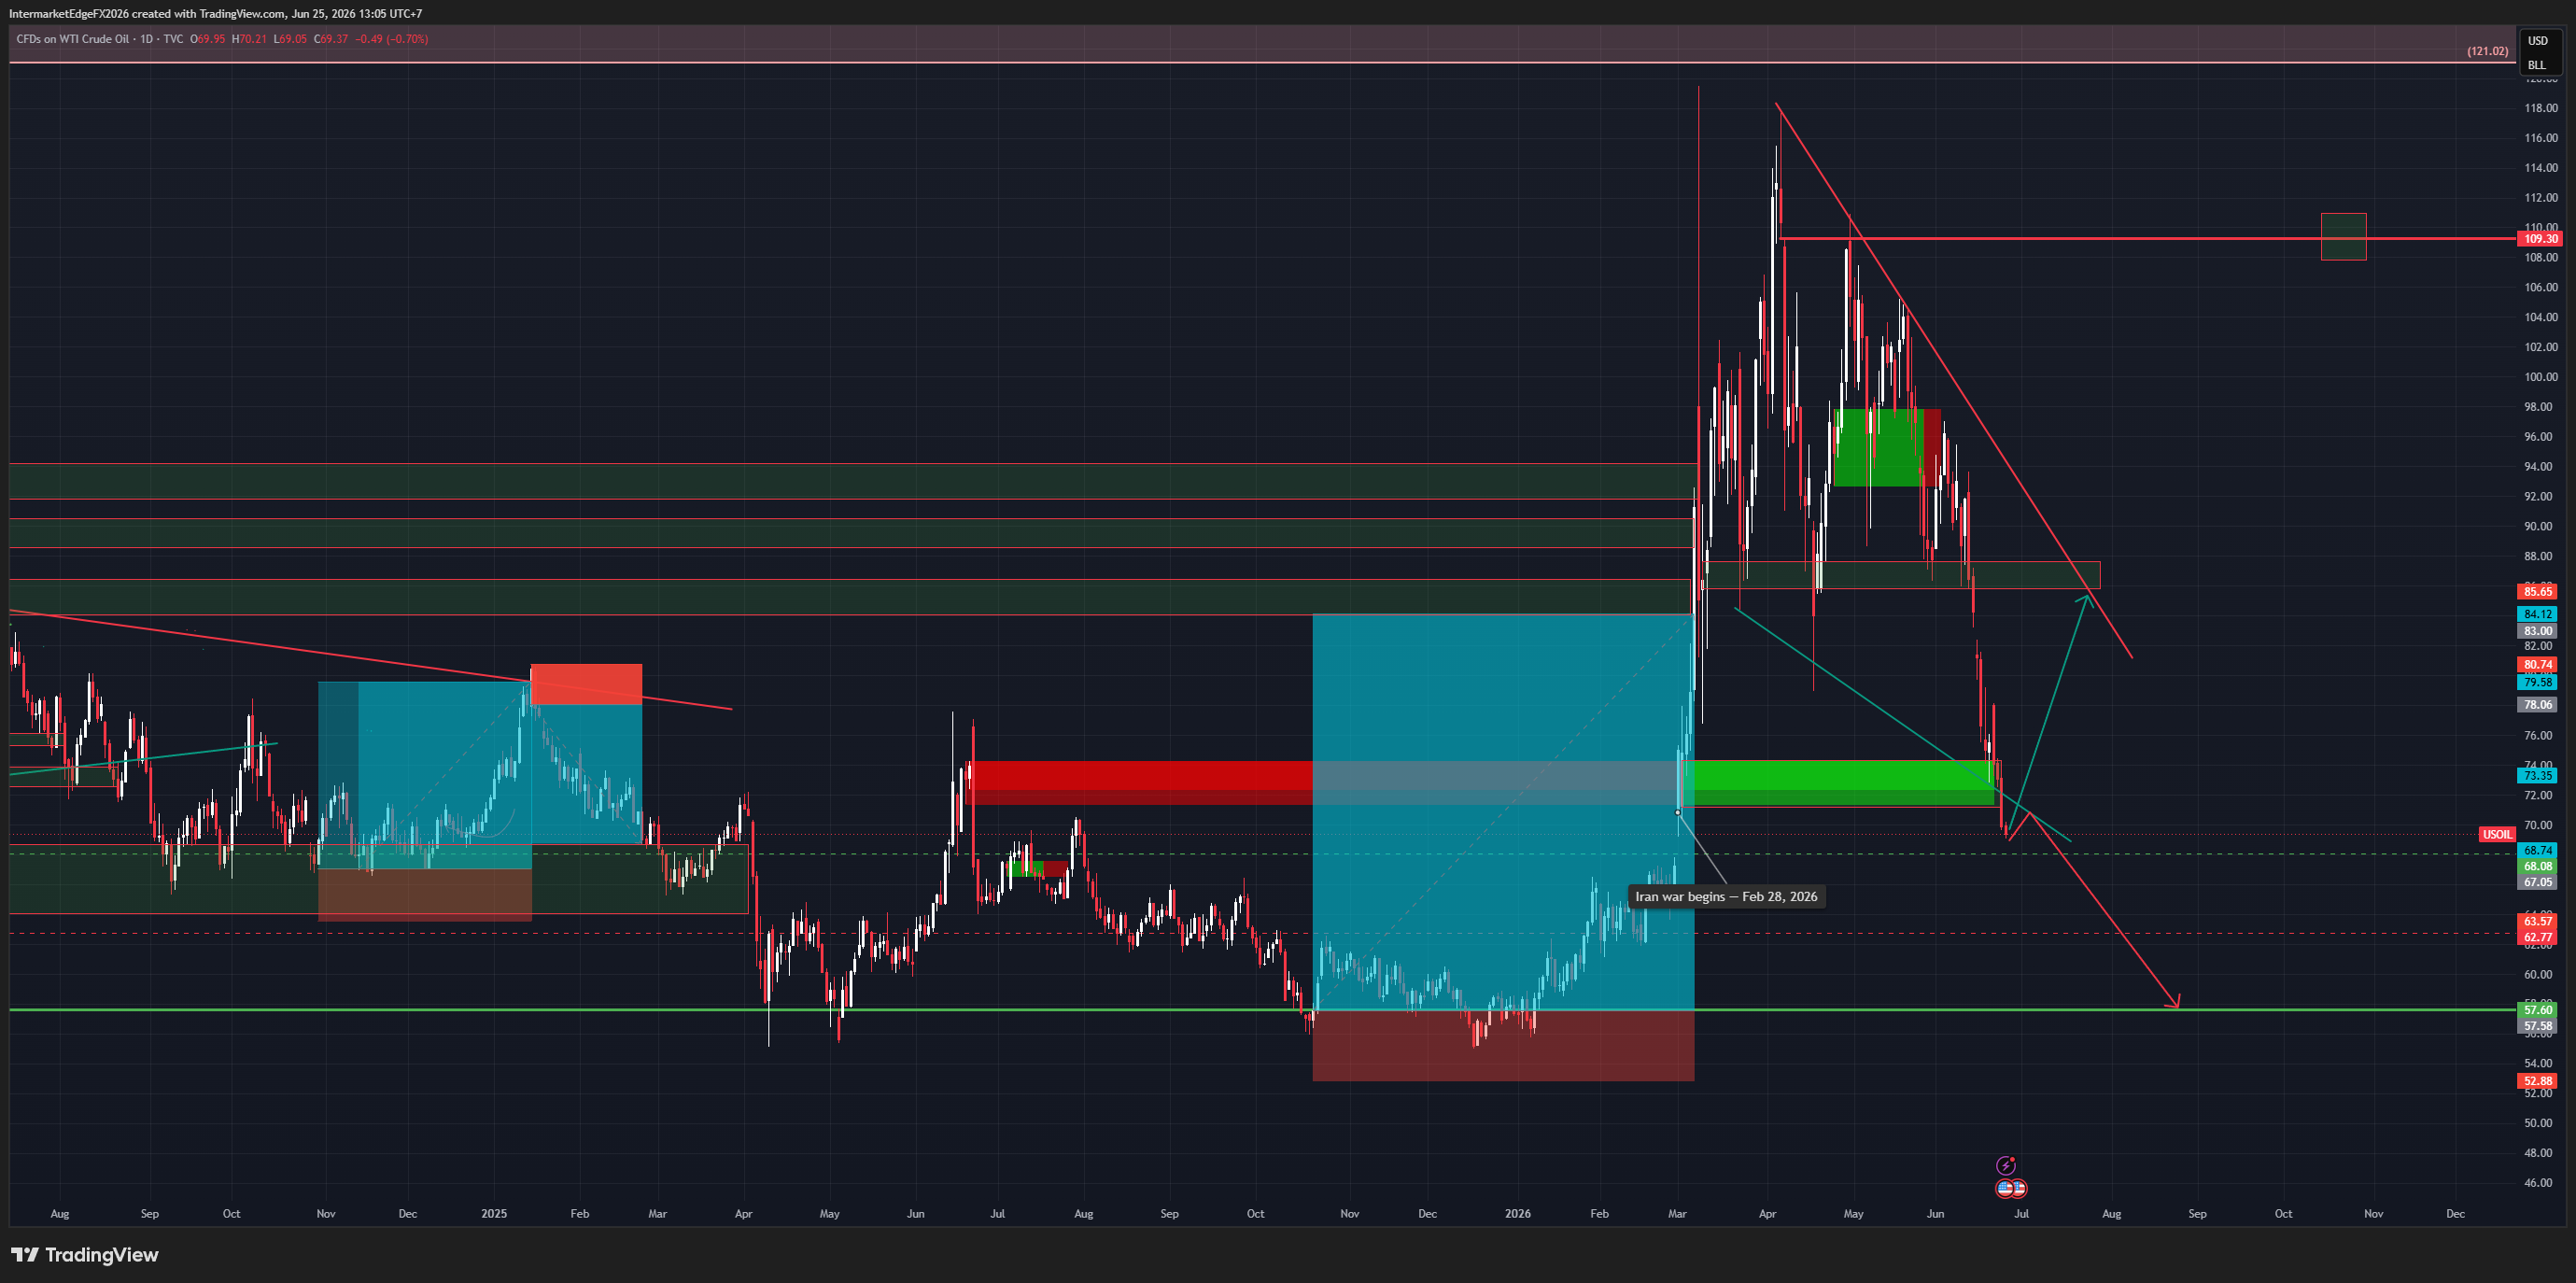
**The Canadian dollar just hit a six-week low. And the reason is not oil.** Everyone watching CAD is focused on the Iran deal decompression and WTI direction. They are missing the more important driver that appeared in today's headline: USMCA headline risk. USMCA is the backbone of Canada-US trade. Approximately 75% of Canadian exports go to the US market. Any renegotiation signal, tariff threat, or deterioration in USMCA terms is a structural CAD negative that operates entirely independently of oil price. CAD can weaken even when oil is rising. That is what is happening right now. The proof is in AUDCAD. AUD is a commodity currency similar to CAD but without USMCA exposure. AUDCAD is sitting at 0.9864, below 1.000. CAD is underperforming AUD. That is not a commodity story. That is a Canada-specific story. USDCAD is now navigating three independent forces simultaneously: USMCA risk - Canada-specific, unrelated to oil, unscheduled catalyst Iran deal oil decompression - WTI bear thesis toward $74-71, structurally bearish CAD Fed-BoC differential - if BoC cuts before Fed on Canada slowdown, rate divergence accelerates USDCAD higher DXY below 100 and the EIA crude draw of 7.9M bbl (from earlier today's analysis) are the counterforces keeping USDCAD flat rather than spiking. The chart shows two competing Elliott Wave counts converging at 1.3842. Both point toward the 1.4099-1.4139 resistance zone as the next major target if bullish drivers align. The wave (b) demand zone at 1.3540-1.3593 is the floor if USMCA reassurance materializes. Two tells to watch: AUDCAD continuing below 0.9864 toward 0.97 = USMCA risk is real, USDCAD rallies AUDCAD bouncing back above 1.00 = USMCA risk fading, USDCAD pulls back The most dangerous scenario: USMCA risk escalates at the same time the Iran deal is signed. Oil drops (bearish CAD) while trade risk increases (also bearish CAD). USDCAD would test 1.42+ with very little resistance. Conviction: Medium. Bias: Mildly bullish USDCA

USDJPY | May 21, 2026  - The Pair That Just Hit Two Walls Simultaneously - Iran Deal Optimism Meets BoJ Hawkish Signal

USDJPY | May 21, 2026 - The Pair That Just Hit Two Walls Simultaneously - Iran Deal Optimism Meets BoJ Hawkish Signal

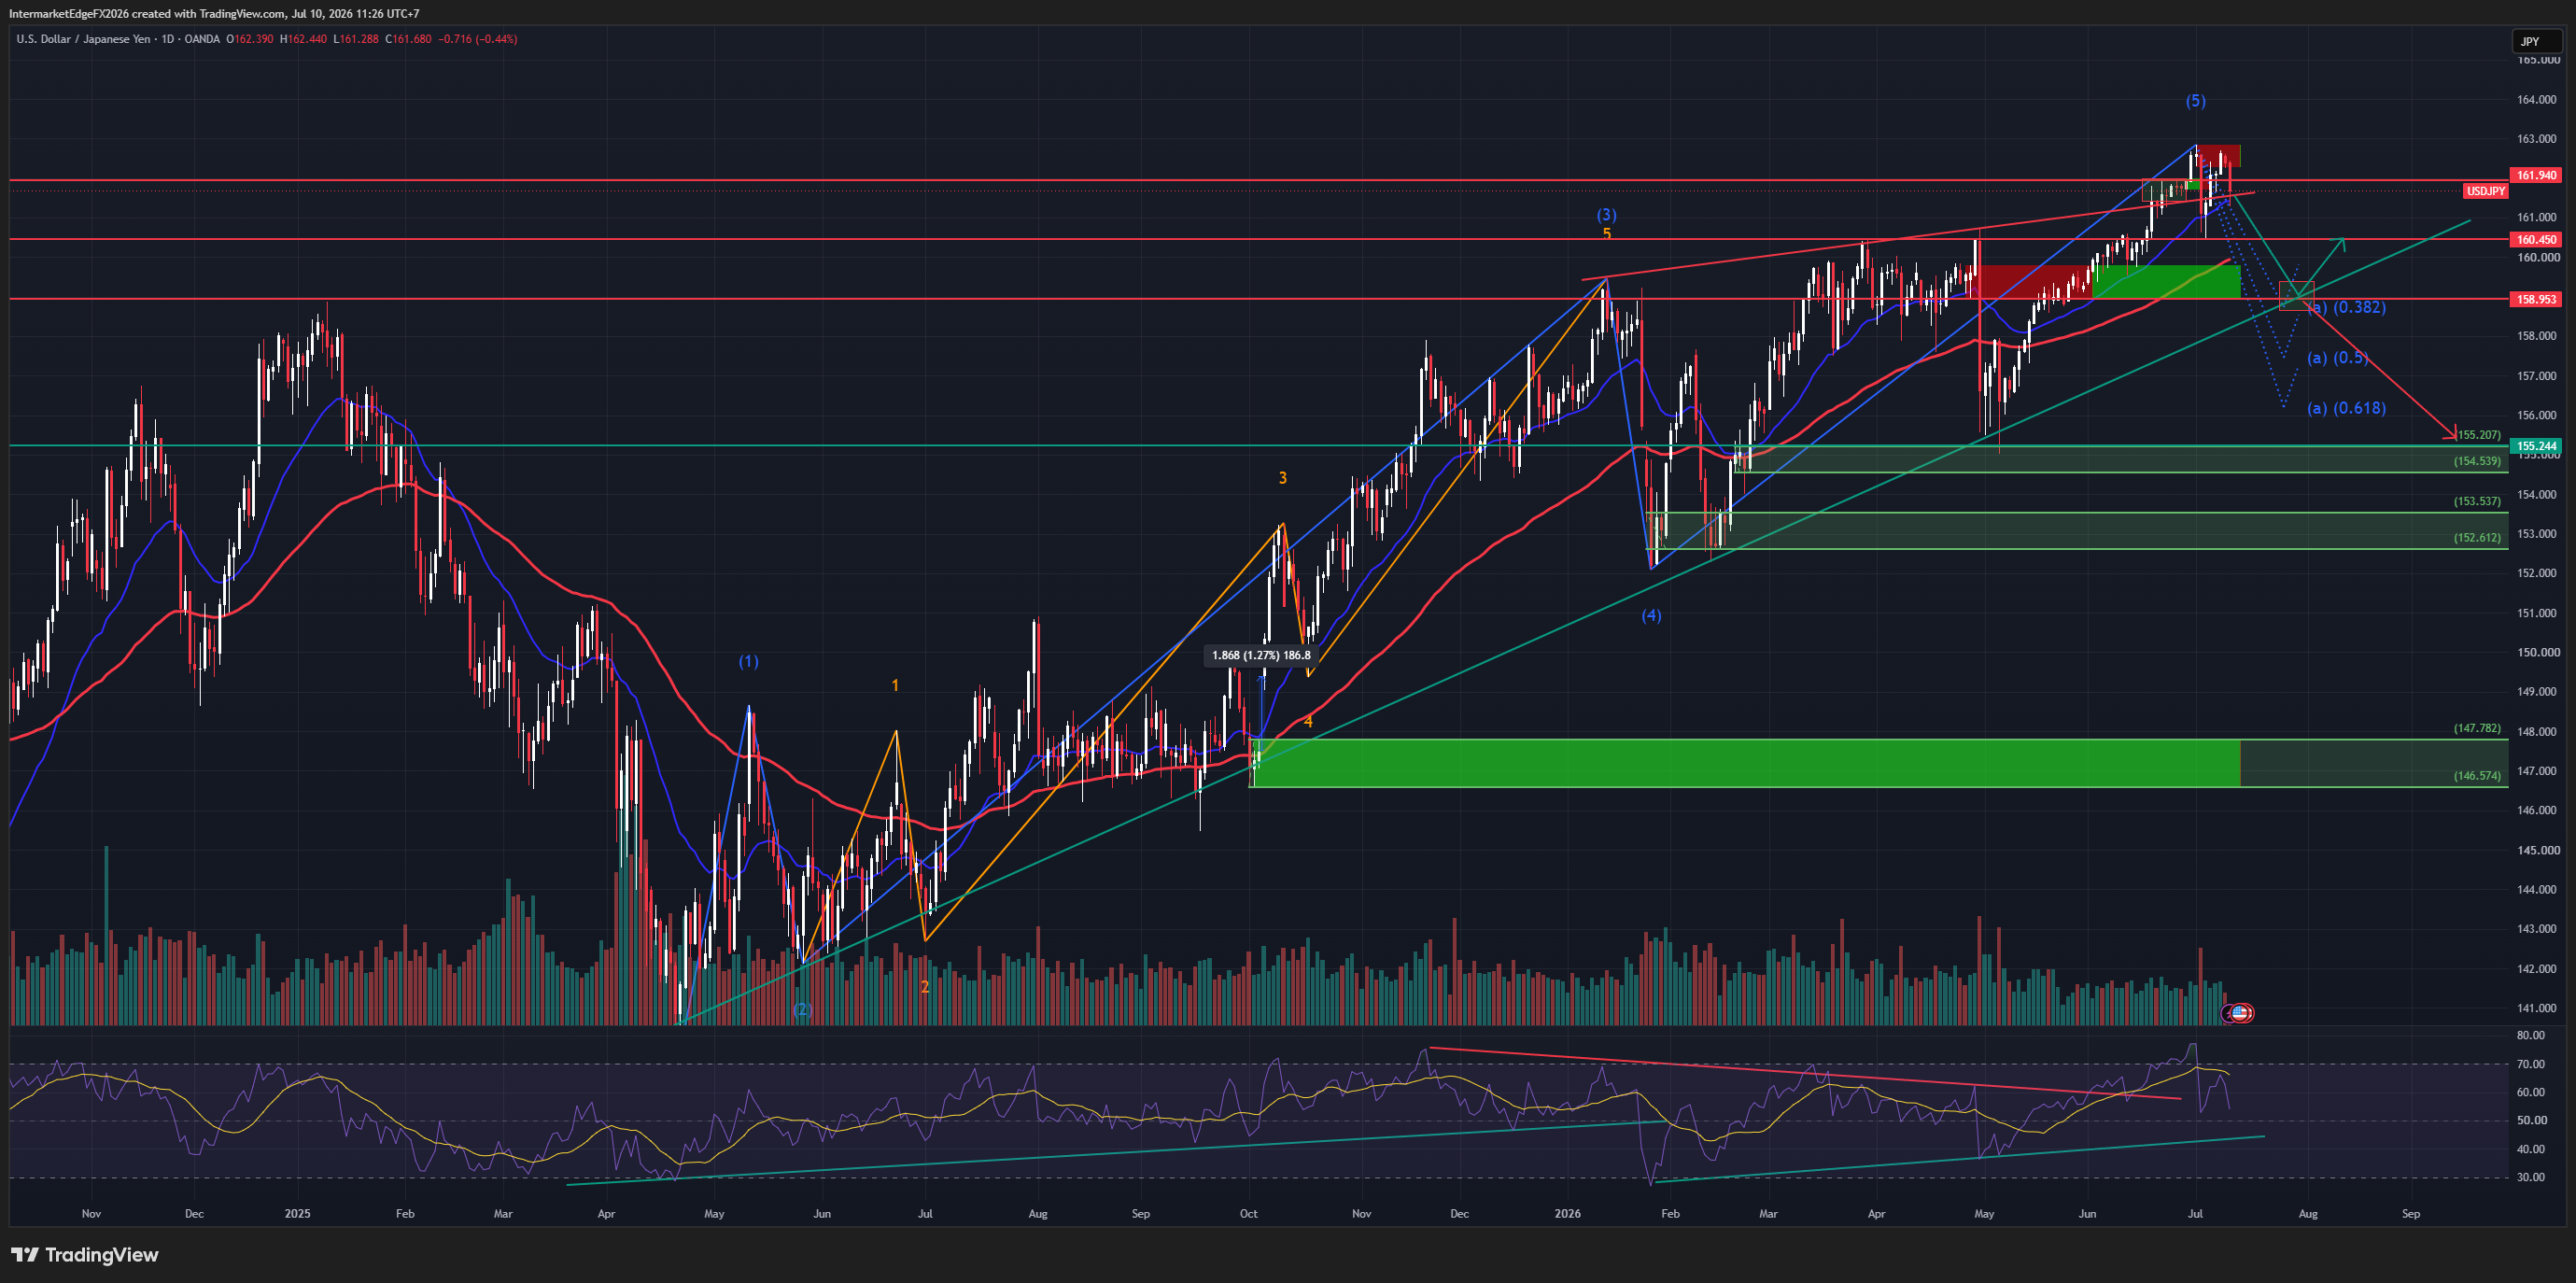
USDJPY | May 21, 2026 USDJPY hit 160 on Wednesday. It has already rejected from that level. And the forces now aligned against the dollar-yen carry trade are the strongest combination seen in this week's entire analysis series. Two things happened simultaneously in the last 24 hours. Trump said Iran negotiations are in the "final stages," causing the dollar to fall against the yen for the first time in eight consecutive sessions as safe-haven USD flows reversed. And BoJ board member Junko Koeda delivered an explicit hawkish signal, stating the central bank needs to continue raising rates with underlying inflation already around the 2% target. Both forces are USDJPY-negative. Neither is ambiguous. The Brent crude sequence this week captures the macro shift in a single column of numbers. From $111.27 on May 18 to $106.09 today - a $5 decline in three trading days. The Hormuz geopolitical premium is decompressing in real time. For Japan specifically, this creates a double tailwind: the safe-haven USD bid falls as geopolitical risk eases, and energy import cost pressure reduces as oil softens. JPY benefits from both sides of the Iran de-escalation trade simultaneously. The 160 level is not just technical resistance. It is the intervention threshold. Japan's Ministry of Finance has acted at this level before. This creates an asymmetric risk profile: upside is hard-capped at 160 by intervention threat, downside is structurally open toward 155-152 and potentially 147-148 if Brent breaks below $100. Three drivers aligned bearish for the first time this week: Iran de-escalation removes safe-haven USD premium, BoJ normalization compresses the carry spread, and the intervention zone eliminates meaningful upside. The one counter-force - the US-JP yield spread at approximately 3.10% - is compressing but not yet broken. Conviction: Medium-High. Watch 160. Watch Brent.

GBPUSD | May 19, 2026 Sterling at 1.3412 - Holding the Line While the Dollar Searches for Direction

GBPUSD | May 19, 2026 Sterling at 1.3412 - Holding the Line While the Dollar Searches for Direction

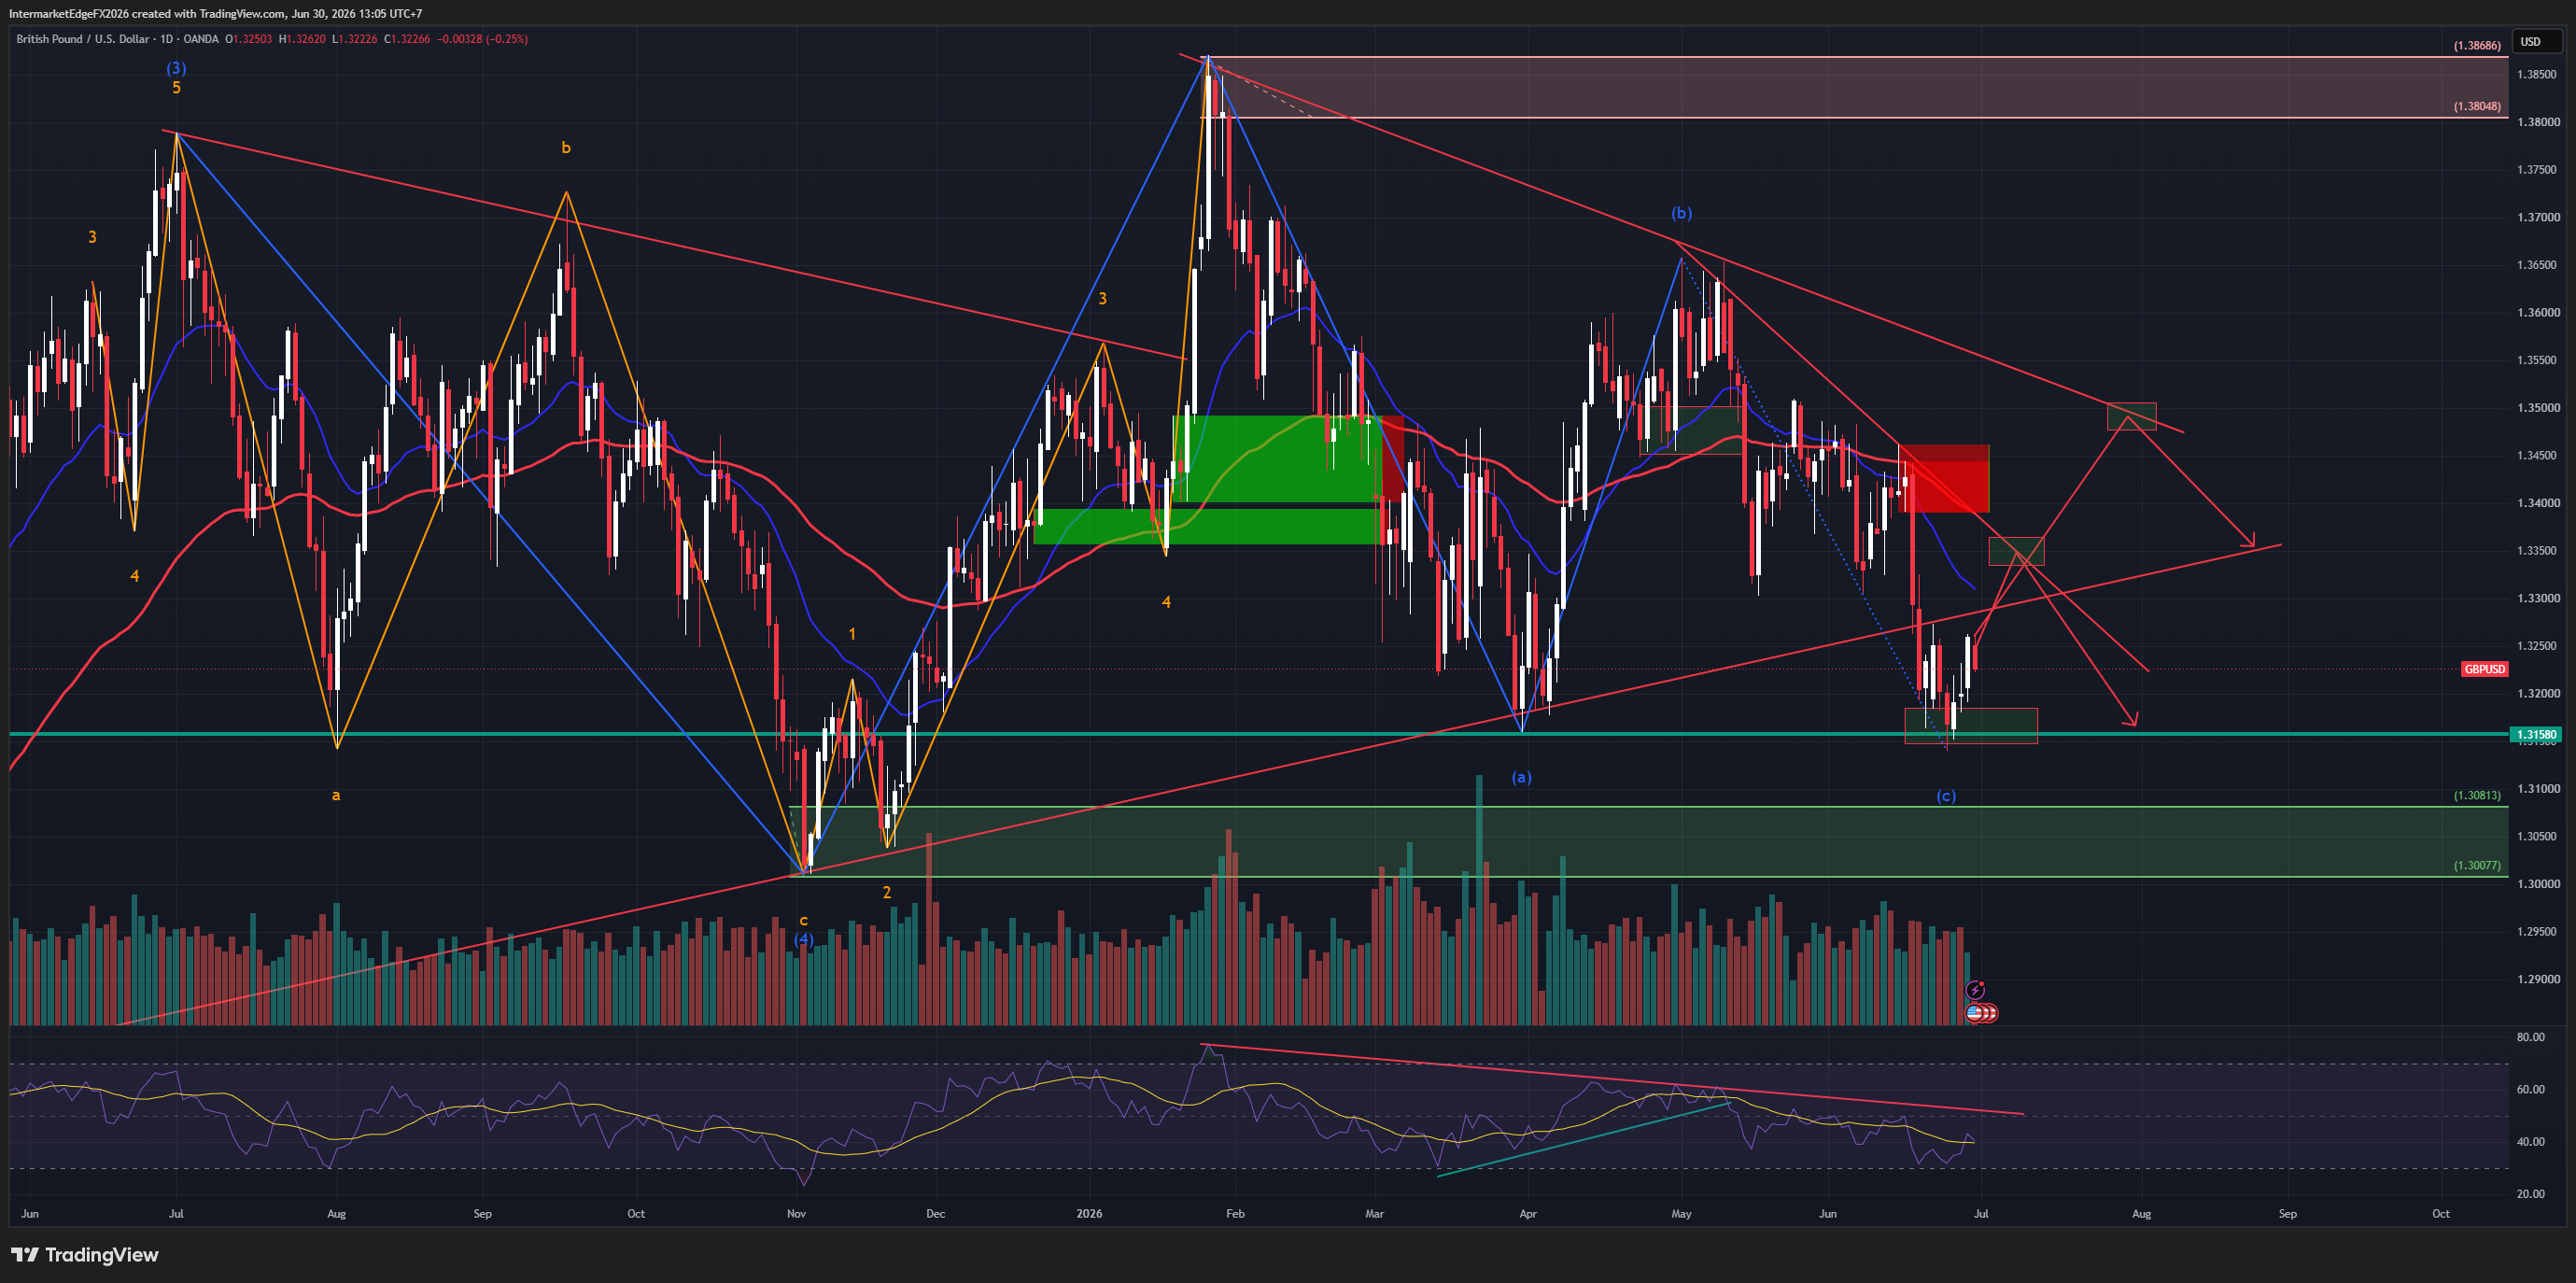
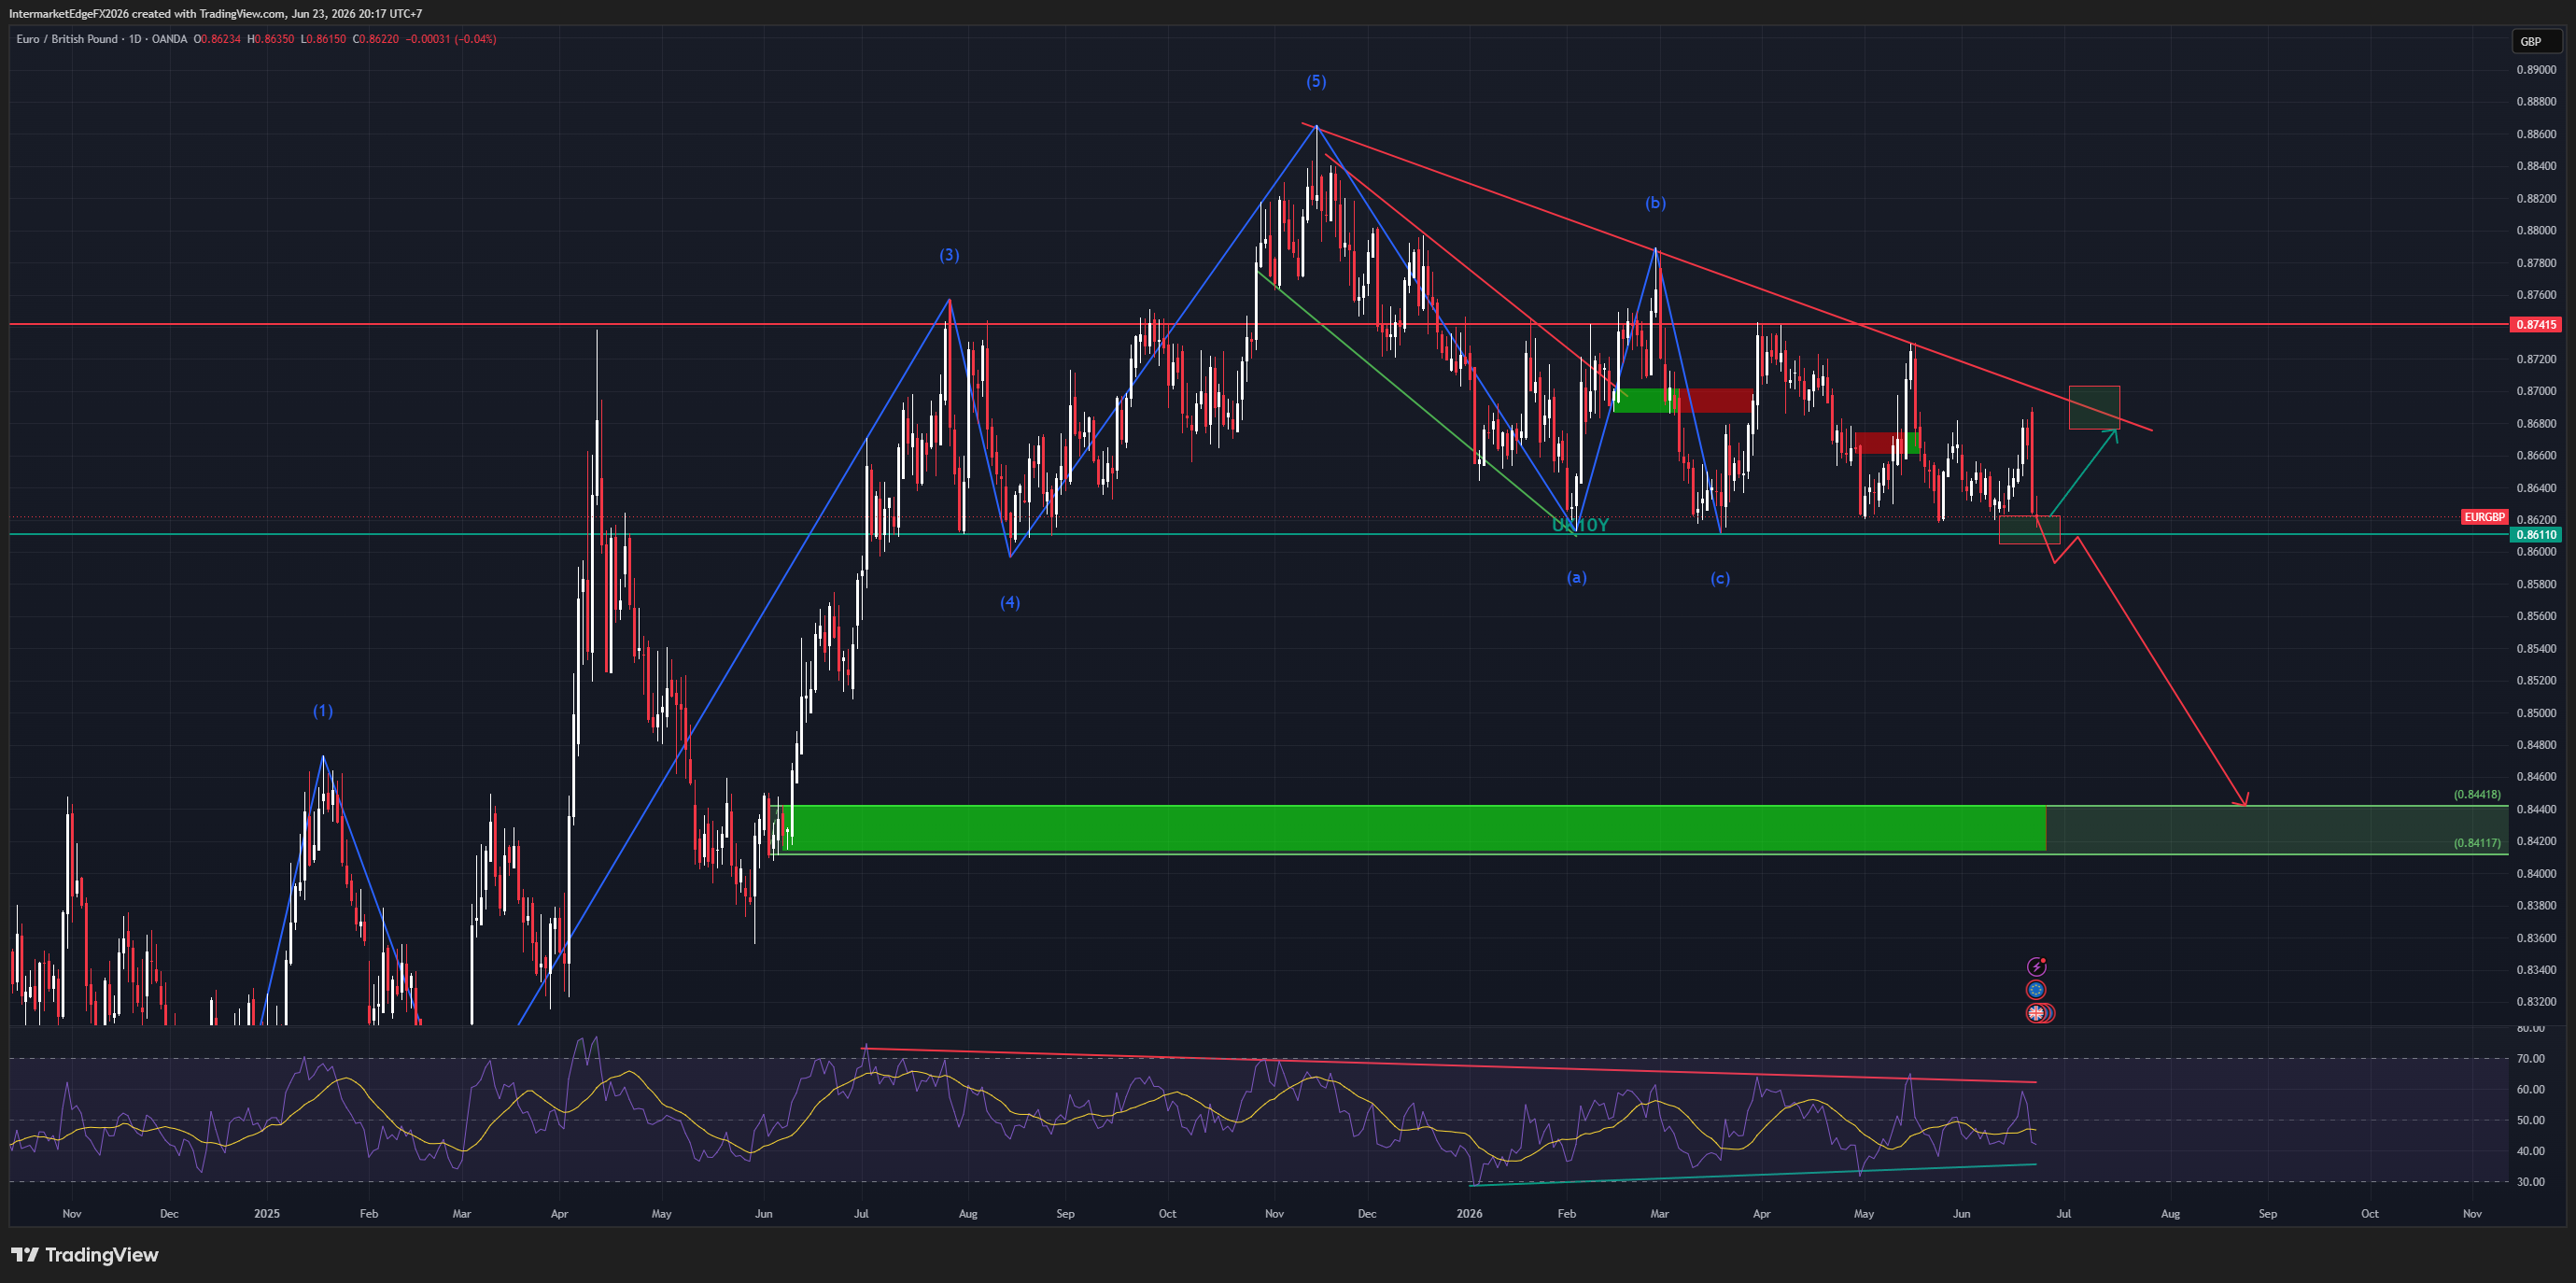
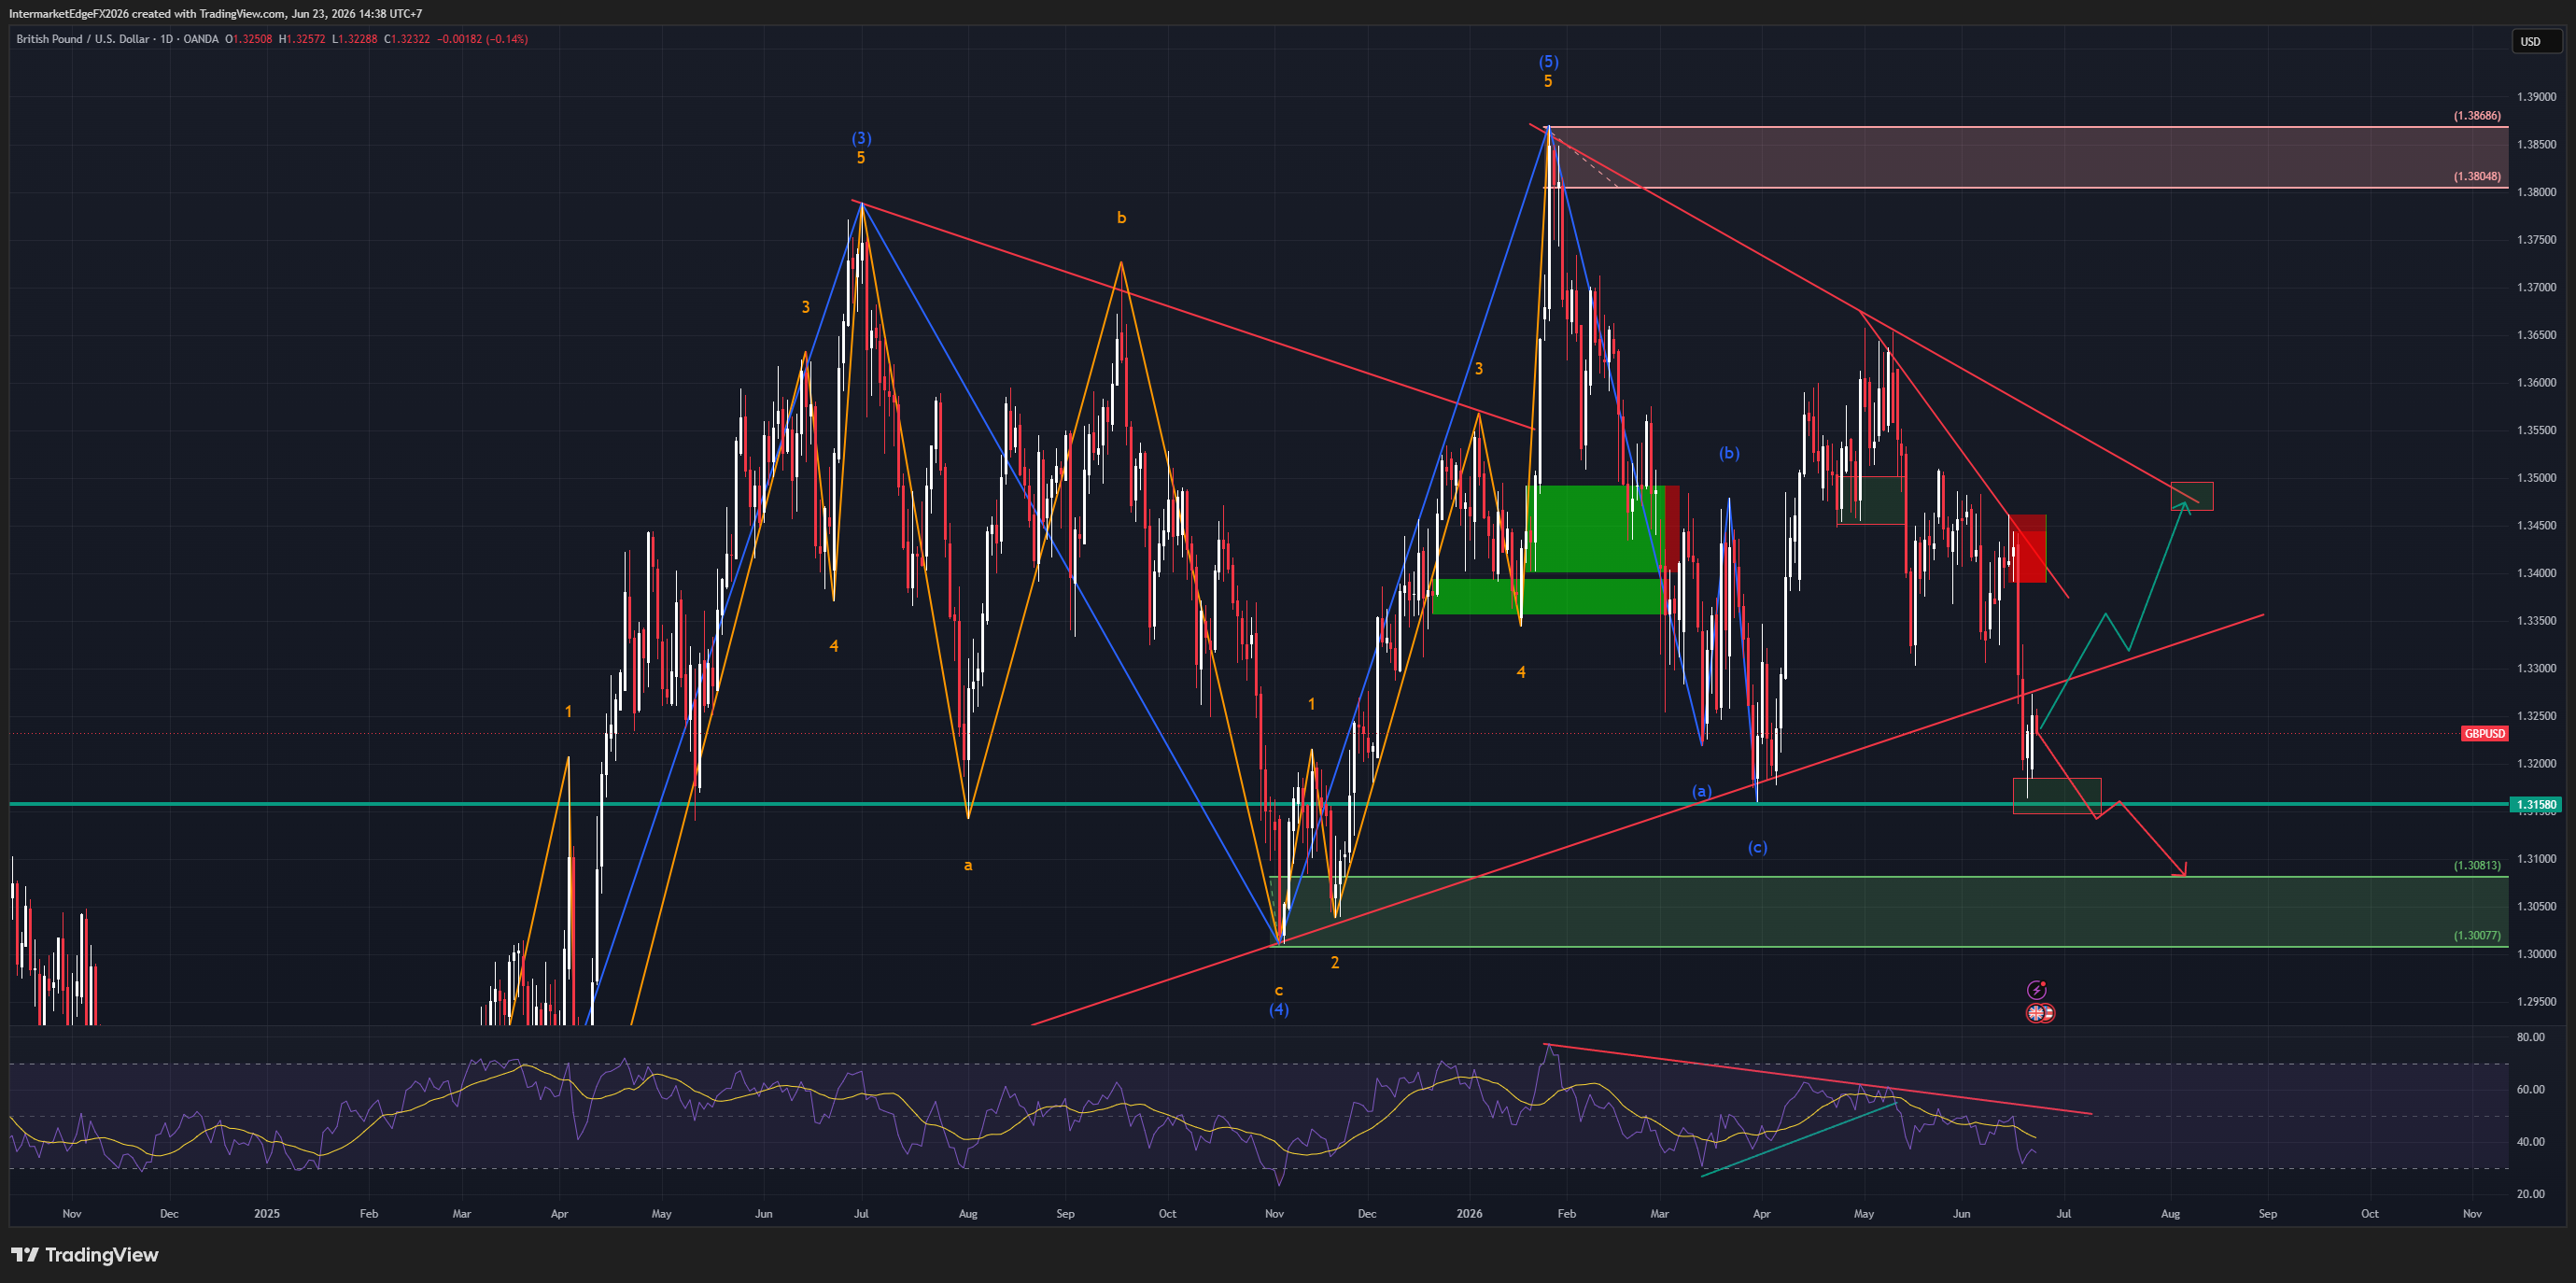
GBPUSD is trading around 1.3412 within a descending wedge structure that has been developing since the January 2026 highs. The pair is now approaching a key compression point, with UK labor market data on May 19 likely to determine the next breakout direction. From a macro perspective, the USD remains trapped in a “stagflationary ambiguity” regime: inflation is still elevated while growth is slowing, leaving the Fed without a clear path forward. Despite higher US yields, DXY remains capped below 100 due to EUR strength and broader de-dollarization flows, indirectly supporting GBPUSD. On the UK side, the economy faces its own stagflation pressures. Inflation remains sticky, growth is weak, and the BoE is stuck in a difficult position — unable to tighten aggressively but not ready to ease either. EURGBP at 0.8682 confirms that GBP has been underperforming EUR, meaning GBPUSD resilience has been driven more by USD weakness than genuine sterling strength. Three major drivers are shaping GBPUSD this week: 1. UK labor data (Claimant Count & Unemployment Rate) Weak data would pressure GBP lower, while stable employment and strong wages could support an upside breakout. 2. USD direction via Fed communication and DXY A move above DXY 100 would create renewed downside pressure on GBPUSD. 3. The wedge compression structure itself The market is nearing the wedge apex, suggesting a significant breakout is likely within 1–2 weeks. Key technical levels: * Resistance: 1.3500 → 1.3727 → 1.3800 * Support: 1.3308 → 1.3196 → 1.2700 Bullish scenario: * UK labor data remains firm and DXY stays below 100 → GBPUSD could break higher toward 1.3500 and potentially 1.3727. Bearish scenario: * UK labor data deteriorates while DXY breaks above 100.48 → GBPUSD could fall below 1.3308 and reopen the path toward the 1.28 region. Overall, the technical structure remains moderately bullish, but the fundamental outlook is still heavily dependent on UK labor data and the bro

InterMarketEdge

© 2026 InterMarketEdge. Financial intelligence for inter-market traders.