Articles — InterMarketEdge

Articles

Financial intelligence, macro research, and inter-market analysis.

USOIL Week W34-2026: Hormuz Standoff Lifts Price Above 84.95, But Three Straight Inventory Builds Tell a Different Stor

USOIL Week W34-2026: Hormuz Standoff Lifts Price Above 84.95, But Three Straight Inventory Builds Tell a Different Stor

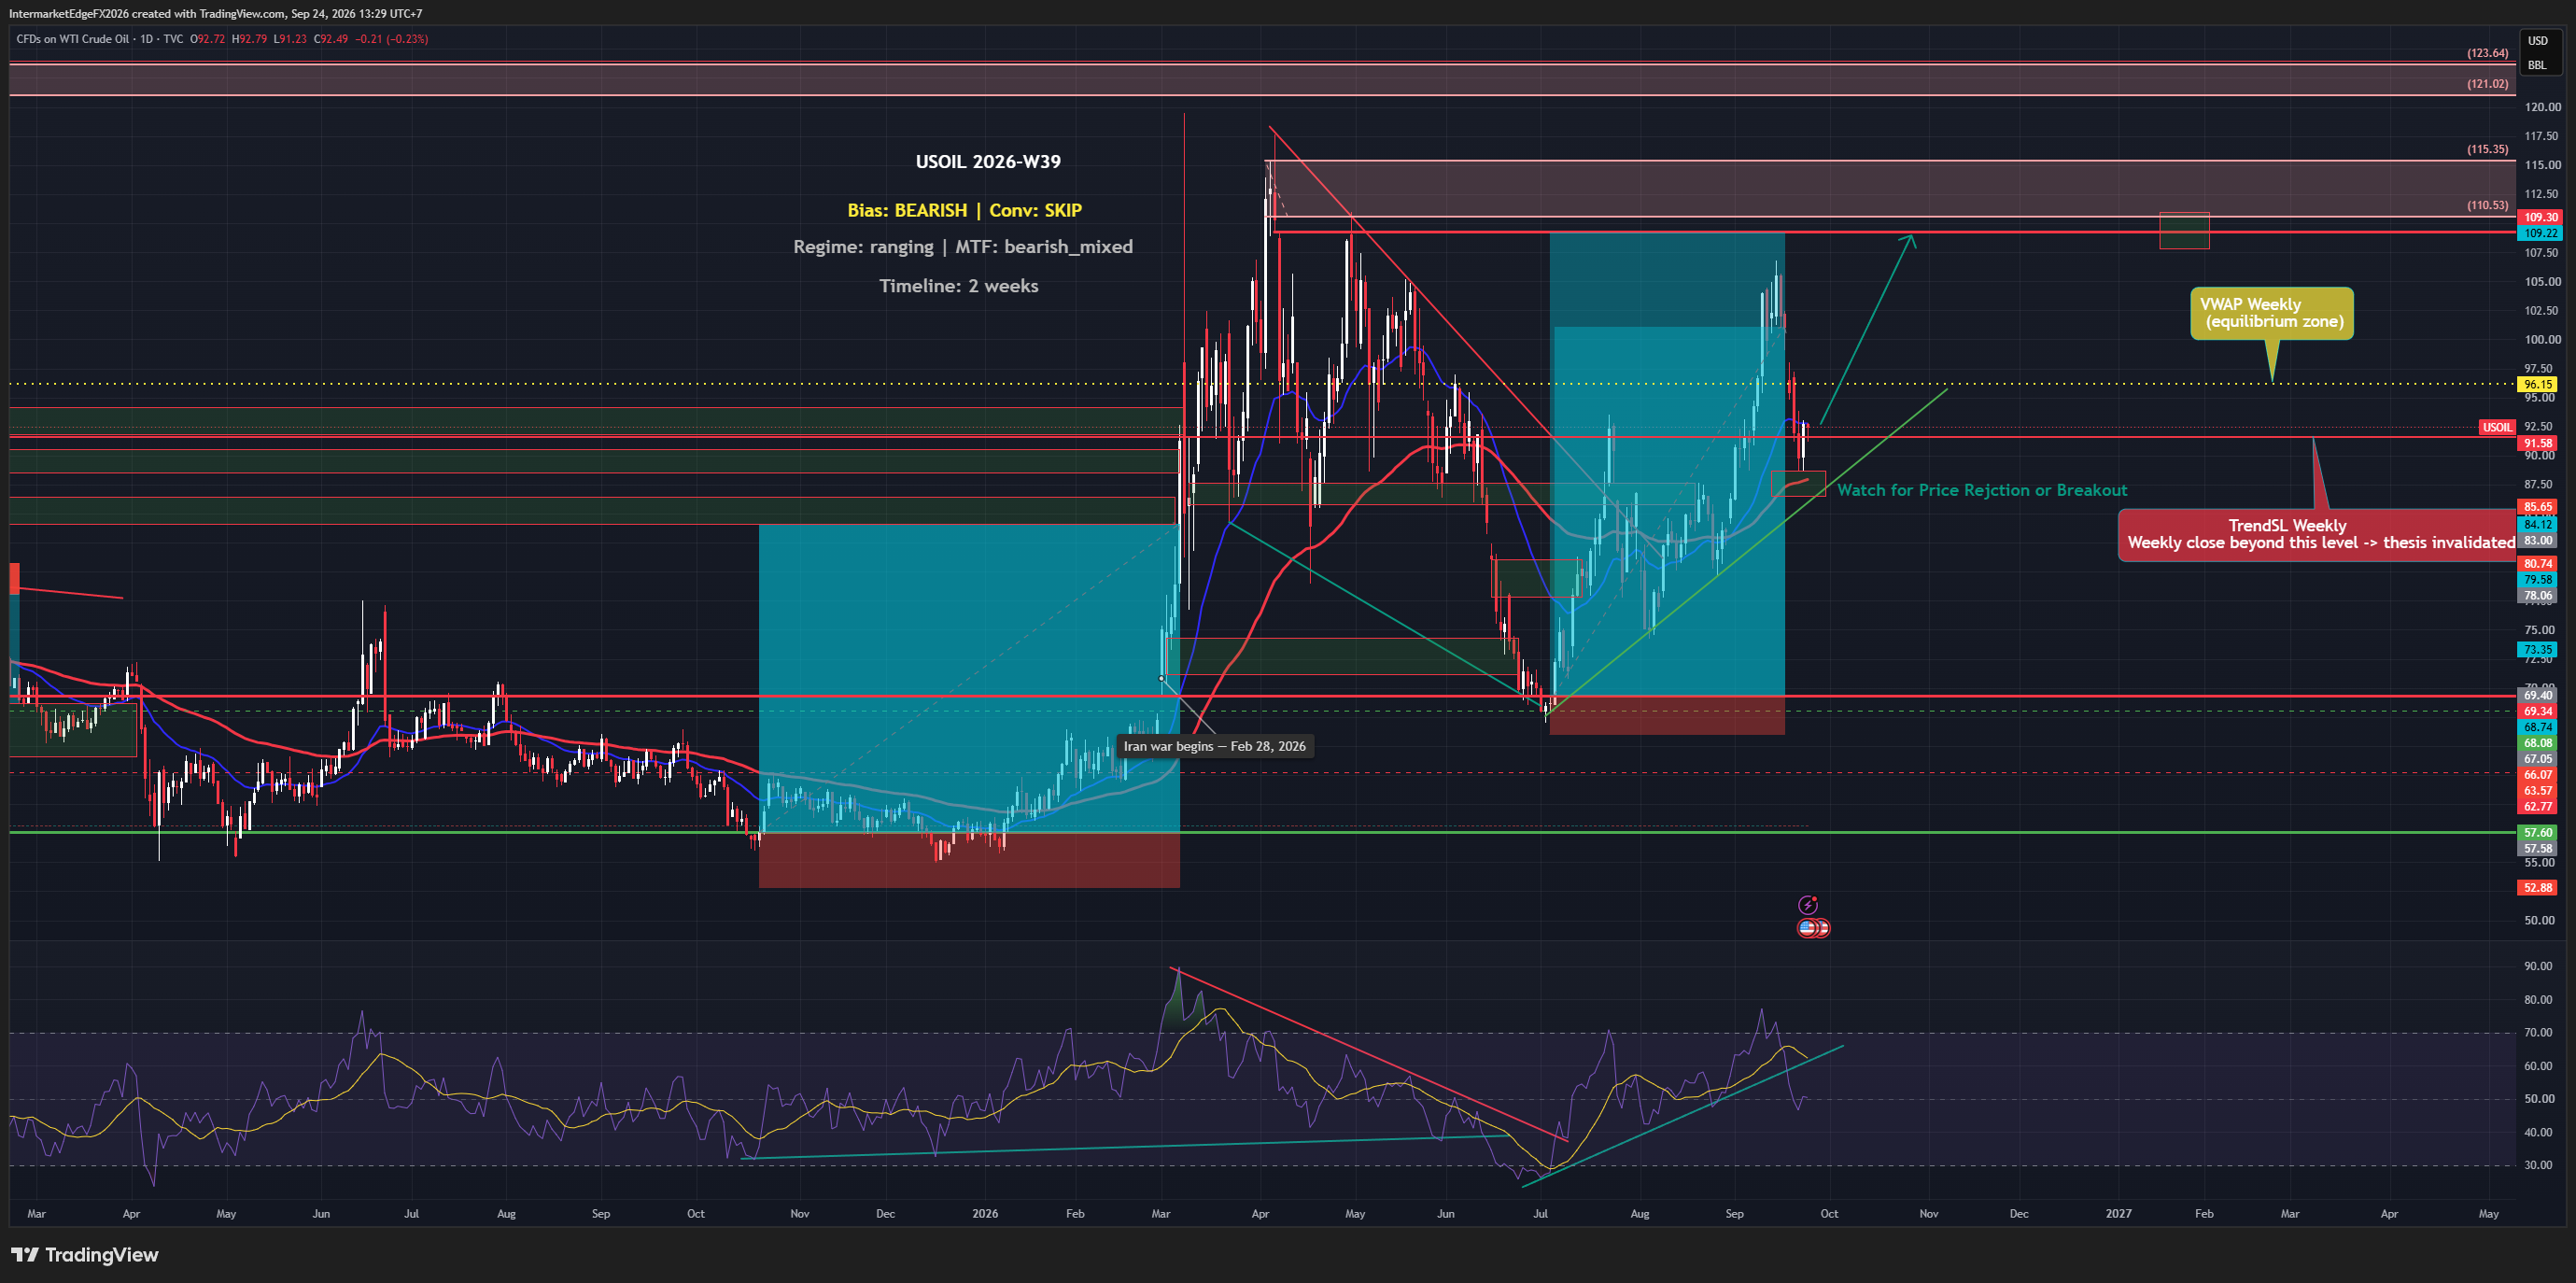
US crude oil is sitting at 85.34 on Thursday, 20 August 2026, trading above its weekly VWAP at 84.95, and that single fact already runs against the week's bearish lean. Three consecutive EIA inventory builds have added genuine supply-side pressure, yet the Hormuz standoff keeps a geopolitical floor under price. The macro and positioning signals are actually bullish, which makes the overall bearish bias here a deliberate, conflict-aware call, not a clean directional read. The overall lean for USOIL this week is bearish, but it is important to understand that this is a conflict-driven bias, not a consensus one. All three active market signals, price action, COT positioning, and the macro backdrop, are individually registering on the bullish side. COT data, which tracks futures positioning reported to regulators and should be read as directional evidence rather than a standalone citable figure since the exact report week and net-position totals are not specified here, shows notable bullish lean from large speculators. Price is above its weekly VWAP. Macro sub-signals, while mixed at the aggregate level, include a geopolitical risk premium that is actively supporting bids. The framework's output of a bearish bias exists precisely because the structural forces sitting behind those near-term signals, rising real yields, a liquidity drain from TGA refill activity, and a sustained inventory build cycle, are likely to reassert once the geopolitical noise fades or the risk premium gets priced out. This kind of internal signal conflict, where the directional call runs against most of the active sub-signals, is exactly the condition that calls for staying aside rather than forcing a position. The conviction here does not reach a threshold where the evidence is convincing enough to size into a directional trade. -- Intermarket Edge

EURUSD W34: A Bearish Thesis Without Technical Confirmation

EURUSD W34: A Bearish Thesis Without Technical Confirmation

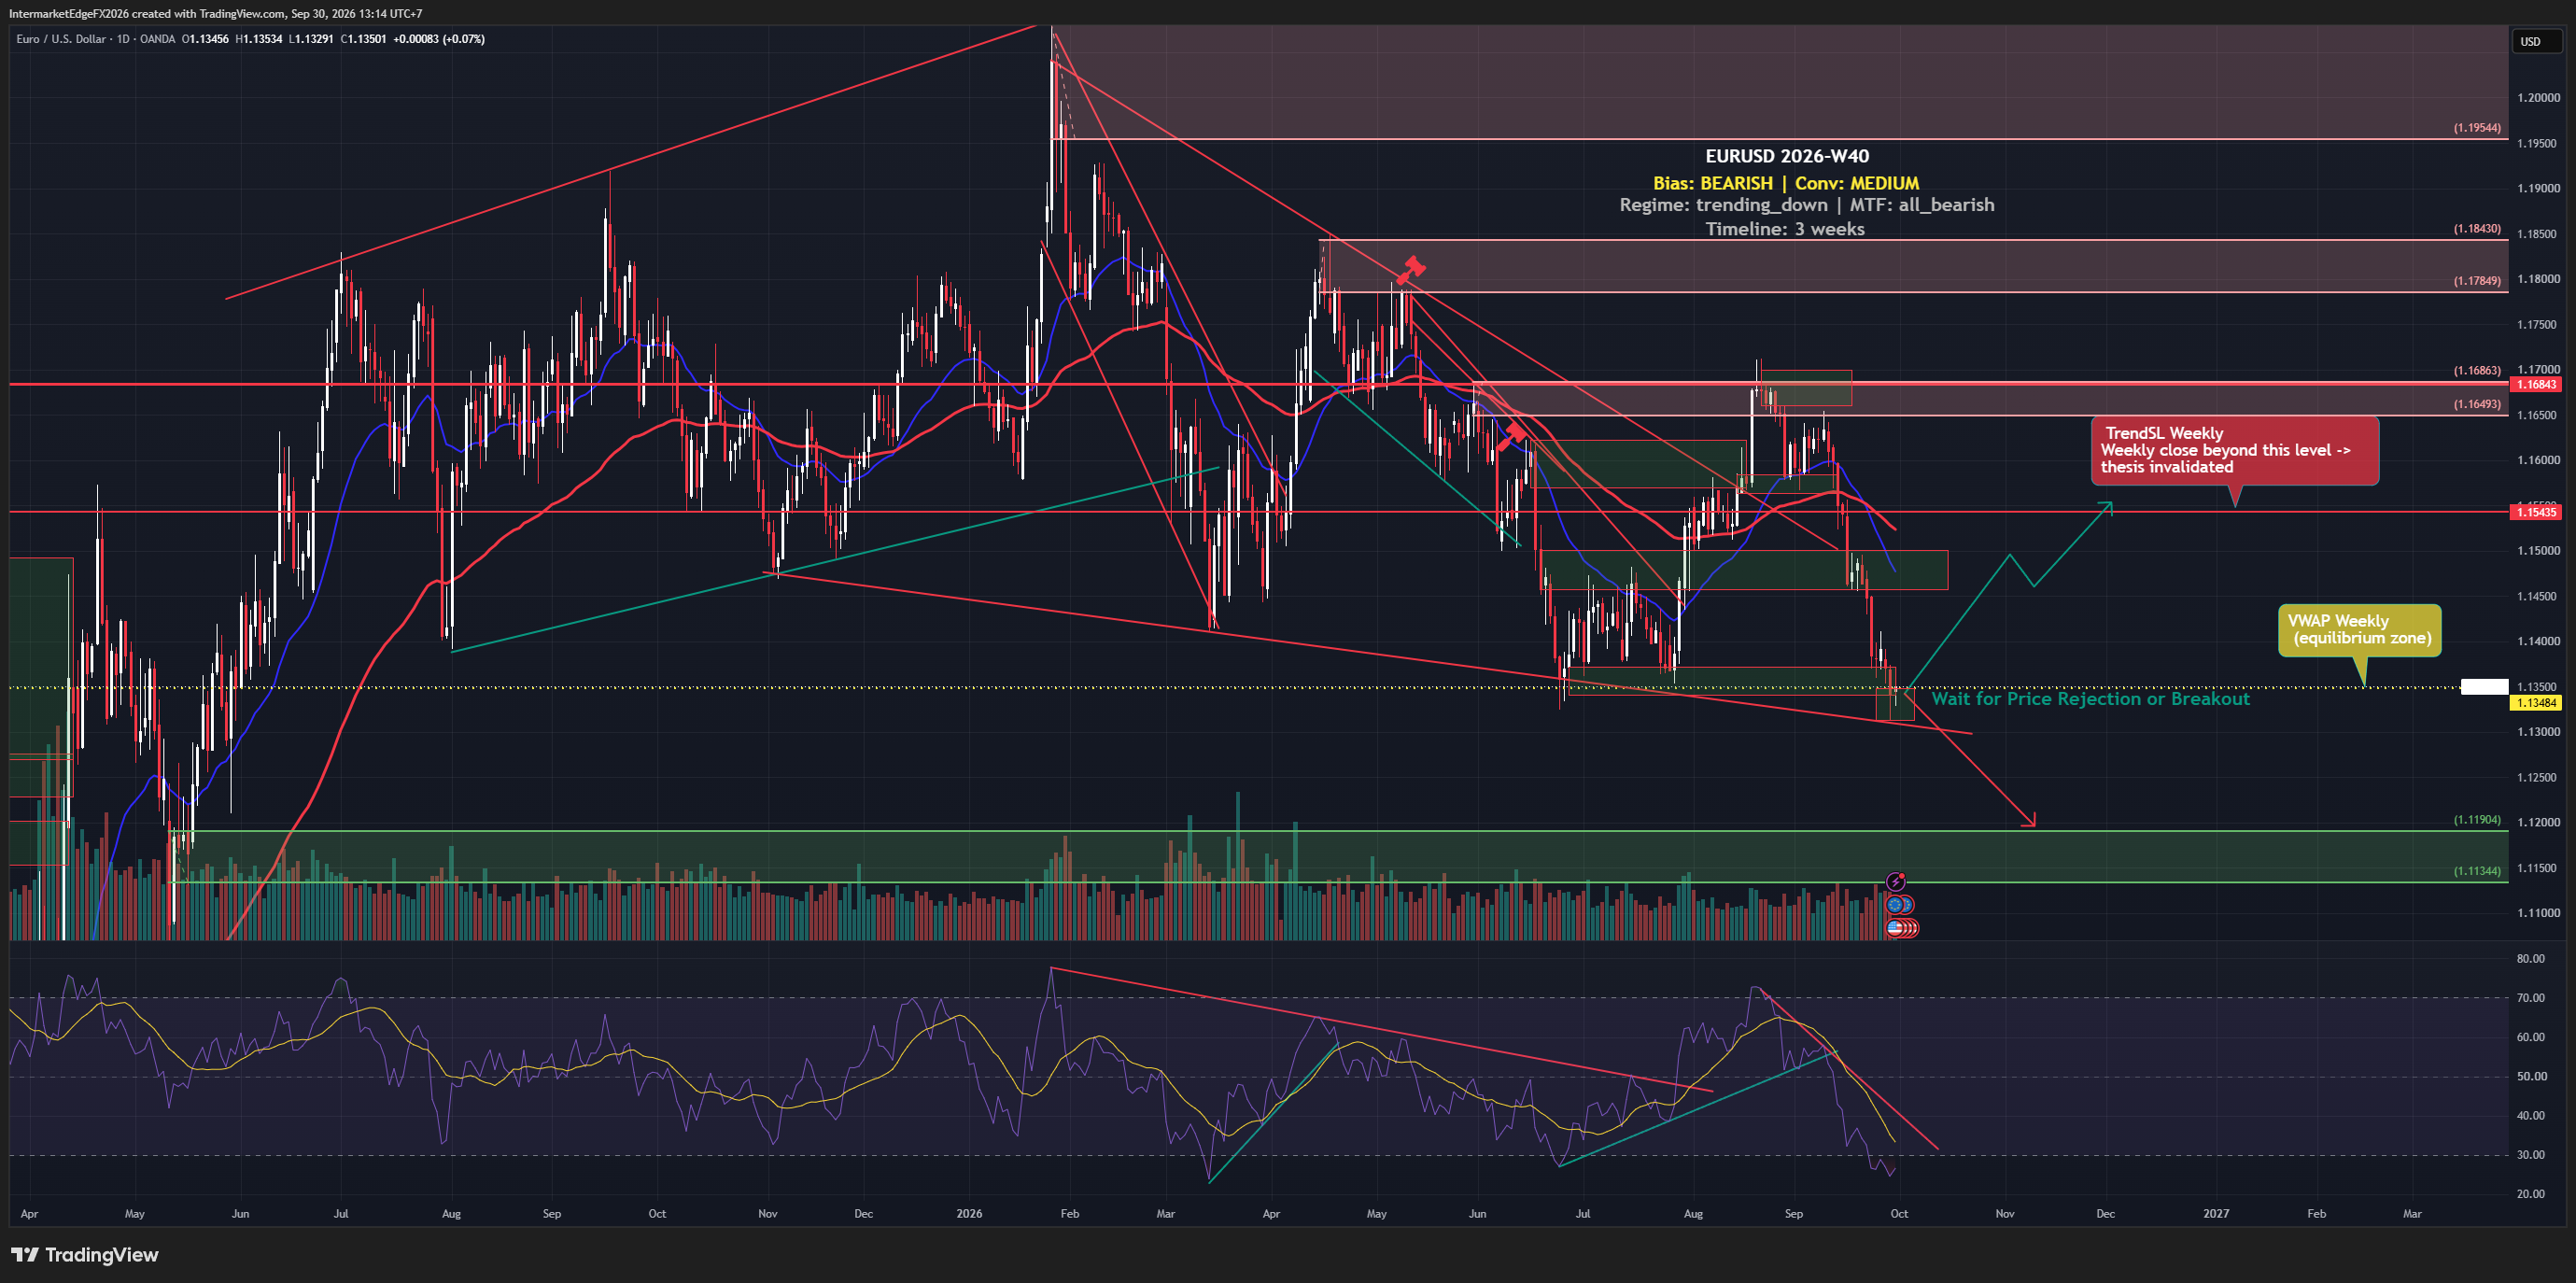
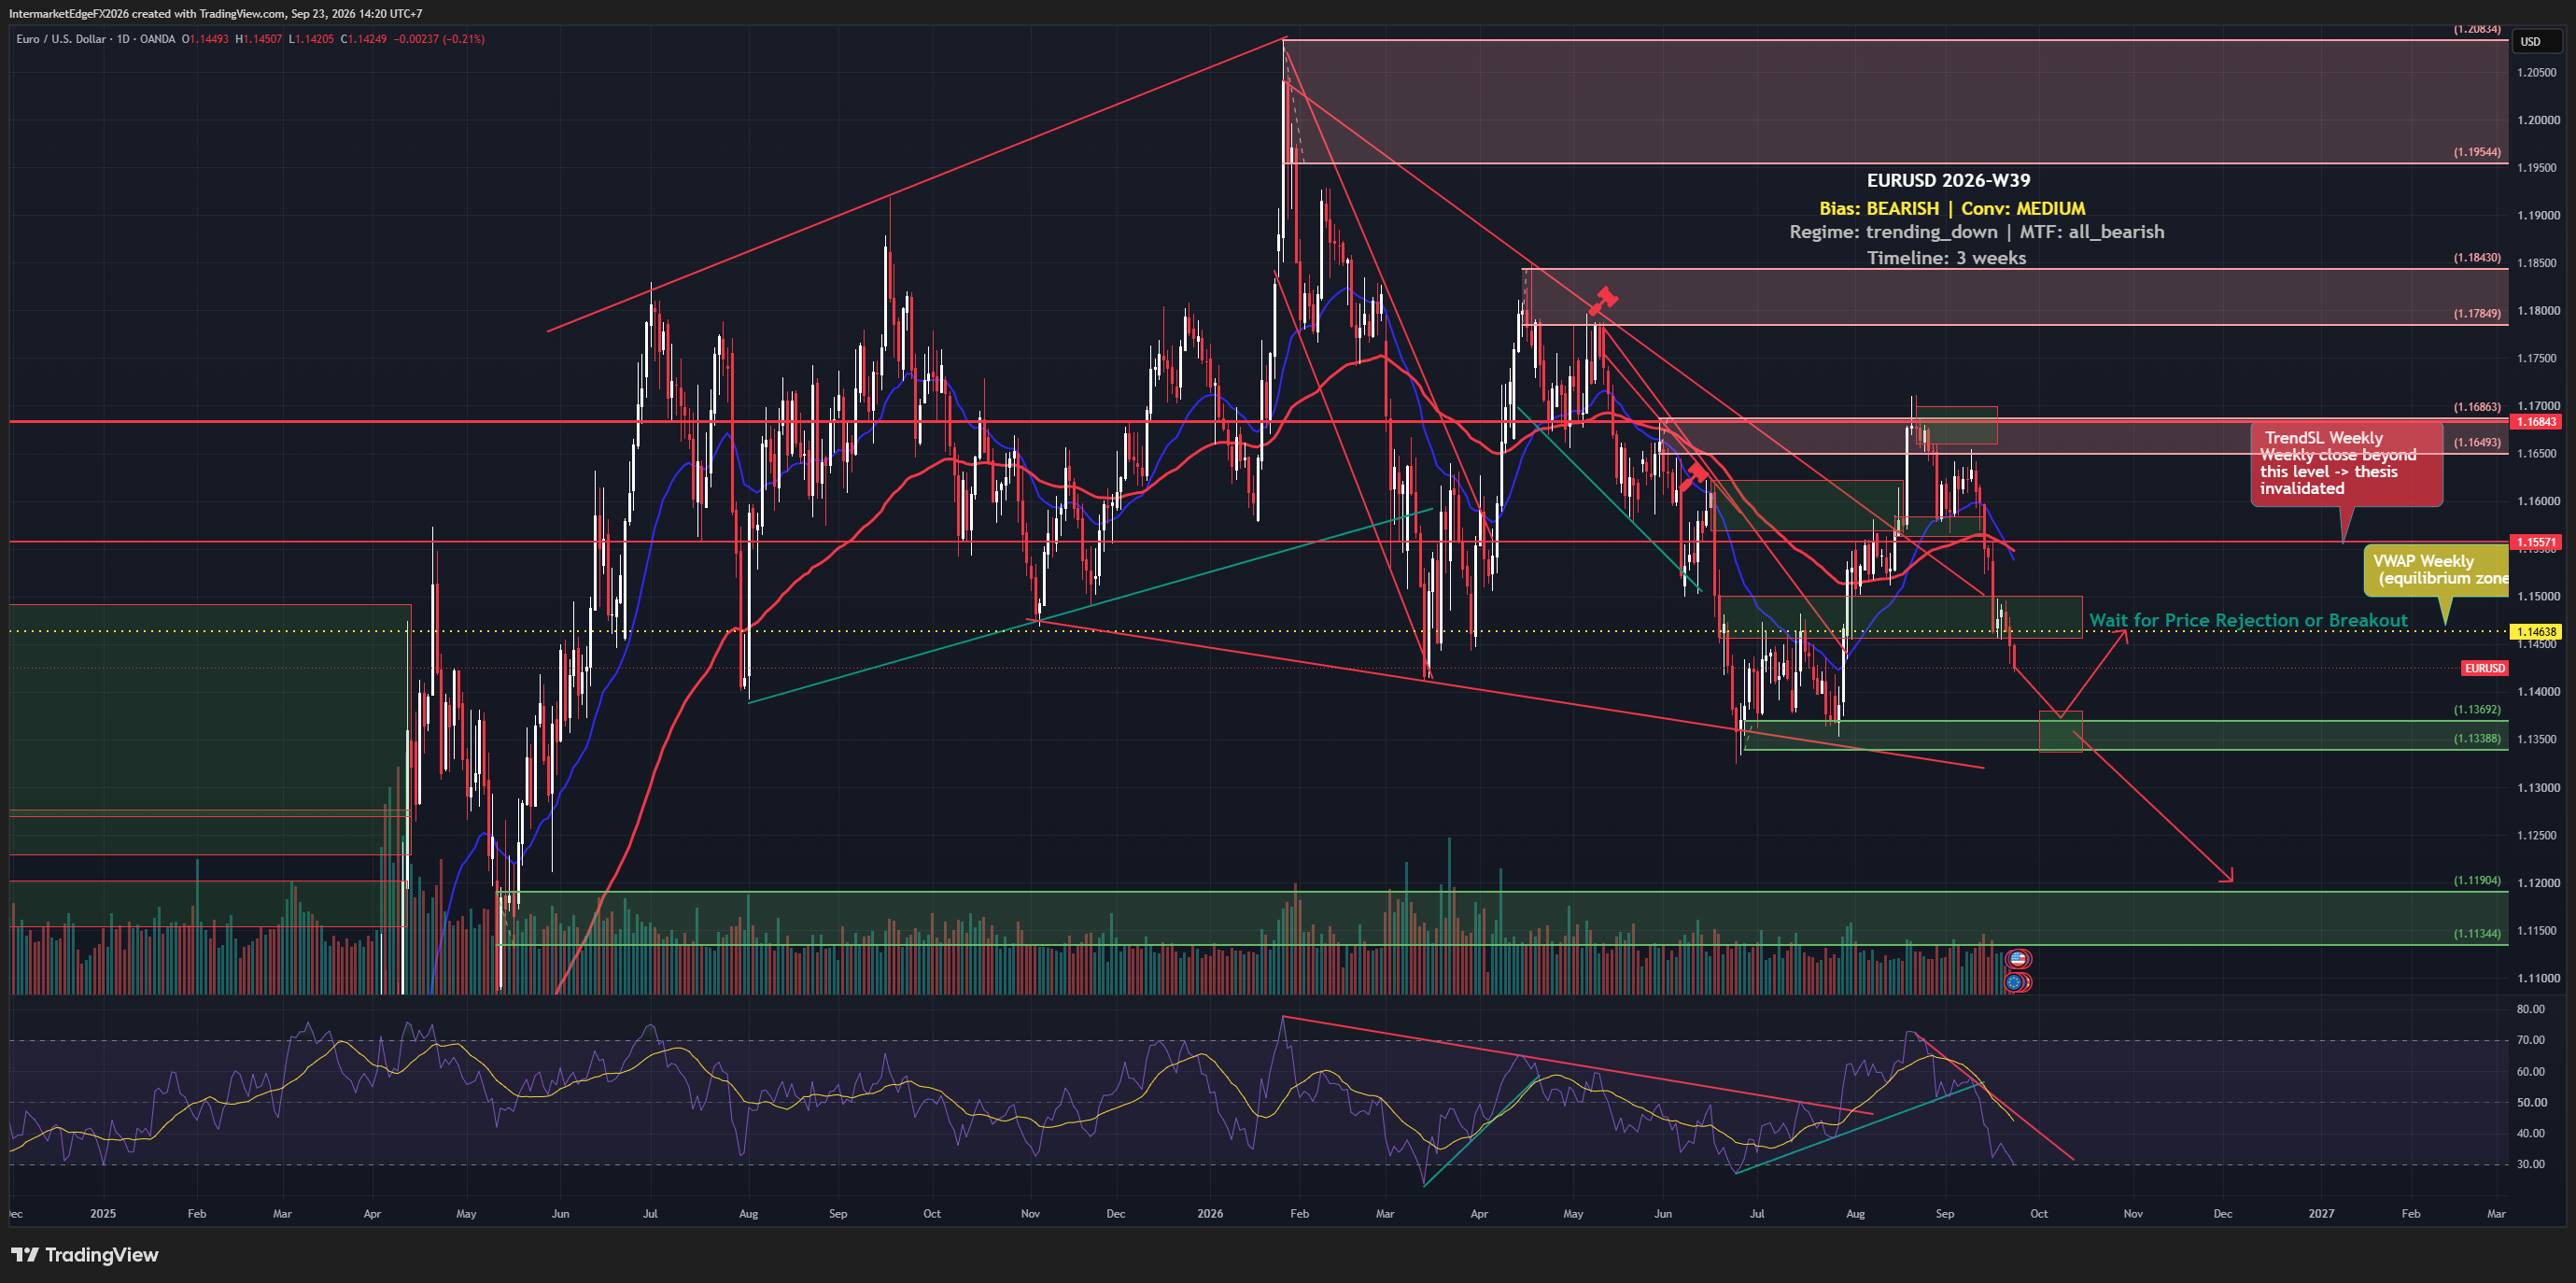
EURUSD is trading at 1.15824 as of Wednesday, 19 August 2026, sitting directly on the weekly VWAP zone at 1.15821. Markets are pricing a dovish Fed pivot while US 10-year real yields simultaneously sit at 2.44%, a level that historically pulls capital into USD. When price, COT positioning, and every timeframe chart point one direction but the macro structural case points the other, one of those signals is about to be proven wrong. The framework's structural conclusion for EURUSD this week is bearish, driven primarily by the ECB versus Fed rate differential, meaning the gap between what the European Central Bank pays relative to the Federal Reserve makes the euro a lower-yielding, less attractive carry currency, which mechanically pushes EUR/USD lower as capital allocates toward the higher-yielding dollar side. Rising US real yields at 2.44% reinforce this causal chain with significant weight: real yield advantage attracts foreign capital into Treasuries, which requires buying USD first, compressing EUR/USD in the process. Here is where the analysis becomes genuinely uncomfortable, and honest about it: the conviction sits at medium rather than high precisely because every other signal currently contradicts that structural conclusion. Price itself is constructive. Commitment of Traders positioning, which tracks what different categories of market participants are reporting, though the specific report week and net-position figures are not confirmed in this brief, so treat this as directional evidence rather than a precise statistic, shows leveraged funds at extreme short positioning even as price trends higher. -- Intermarket Edge

EURGBP Week W34-2026: Sterling Dips on Labour Data but Holds Above 0.85519, Leaving Bulls Without a Technical Foundation

EURGBP Week W34-2026: Sterling Dips on Labour Data but Holds Above 0.85519, Leaving Bulls Without a Technical Foundation

EURGBP is sitting in a narrow corridor this week, above its weekly VWAP at 0.85519 but still pinned below the TrendSL at 0.85973, a gap of roughly 40 pips that tells two different stories. UK labour market data has cooled, sterling dipped in response, yet better-than-expected GDP for Q2 has given the pound enough footing to post a weekly gain. The pair's direction is technically labeled bullish, but the evidence behind that label is thin enough that standing aside is the deliberate call right now. The framework arrives at a bullish bias on EURGBP for the week of W34-2026, but it is important to understand what is actually driving that label before treating it as actionable. The sole active input is price-based, the positioning of price relative to key levels nudges the score marginally positive. Every other source that the analysis monitors, positioning data, macro rule sets, liquidity conditions, and sentiment, contributed nothing this week. That near-total absence of corroborating evidence is the defining characteristic of this setup, and it is why the deliberate decision here is to stand aside rather than size a position. A bullish label supported by only one weak input, with structural bias sitting at neutral, is not a setup, it is an unresolved question. The ECB versus BOE rate differential is named as the primary driver of the thesis. Rate differential is the interest rate gap between two central banks; in practical terms it determines the cost or benefit of holding one currency over the other, and when it shifts it tends to be the dominant force on a cross like EURGBP over a multi-week horizon. The conflict is that no macro rule actually fired this week despite that driver being identified, the named catalyst has not translated into a quantified signal. -- Intermarket Edge

GBPUSD Week W34-2026: Pound Climbs Toward $1.36 as UK Inflation Test Looms, but Crowded Longs Warn of a Trap

GBPUSD Week W34-2026: Pound Climbs Toward $1.36 as UK Inflation Test Looms, but Crowded Longs Warn of a Trap

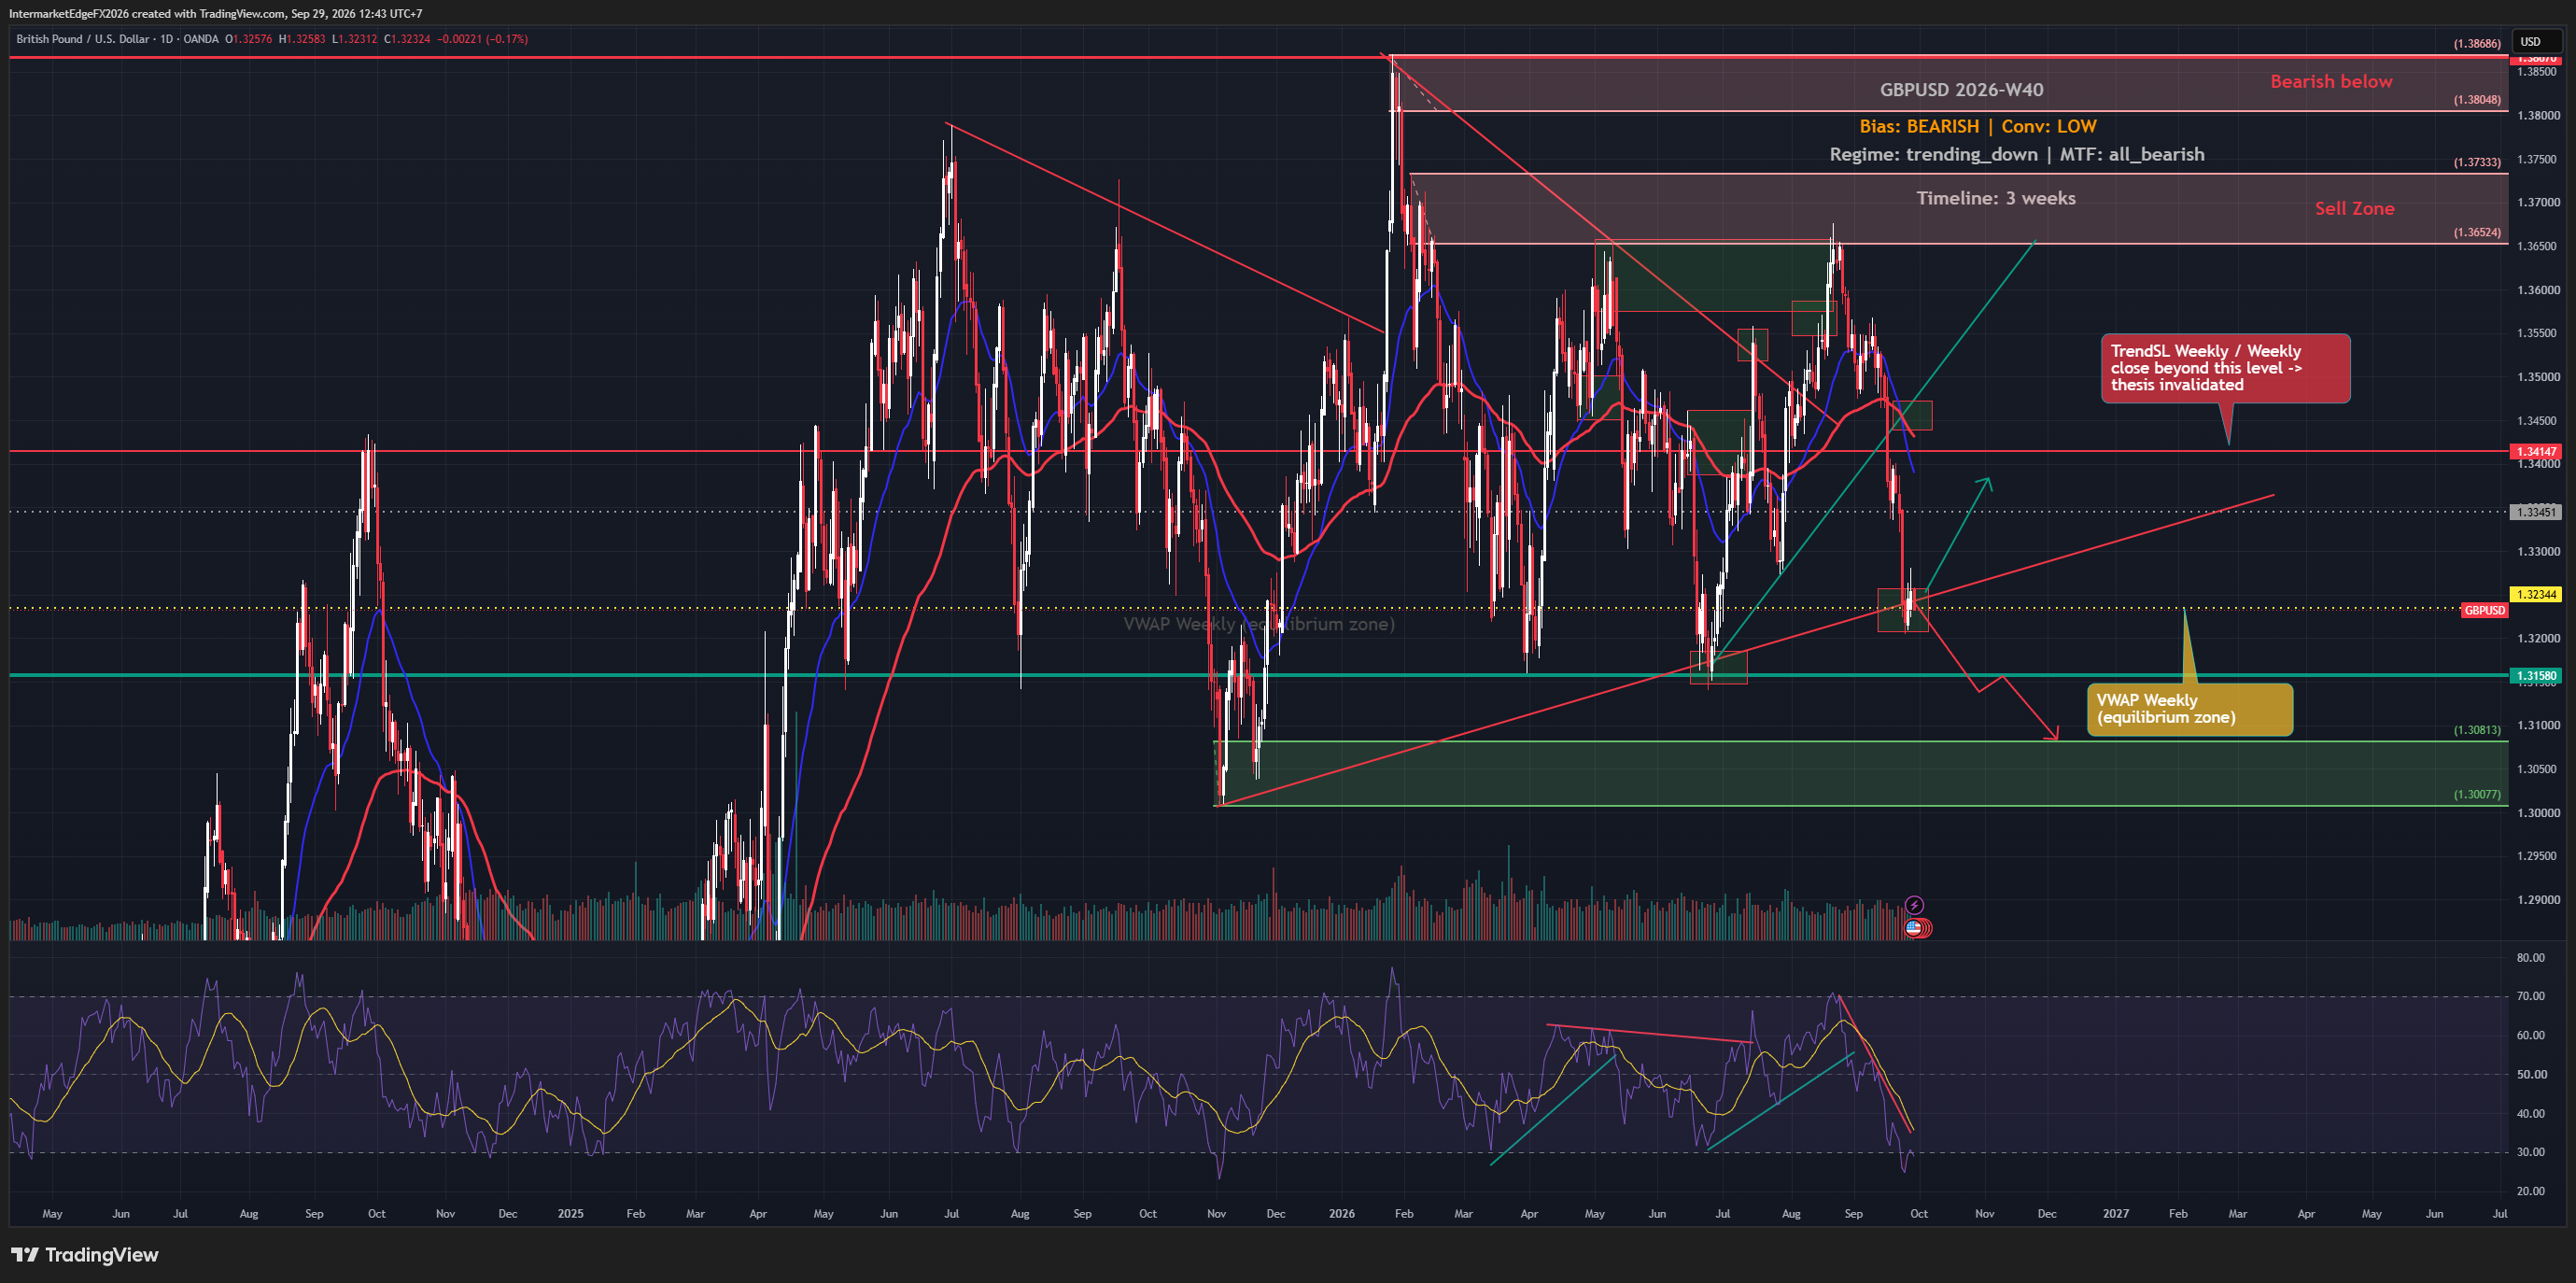
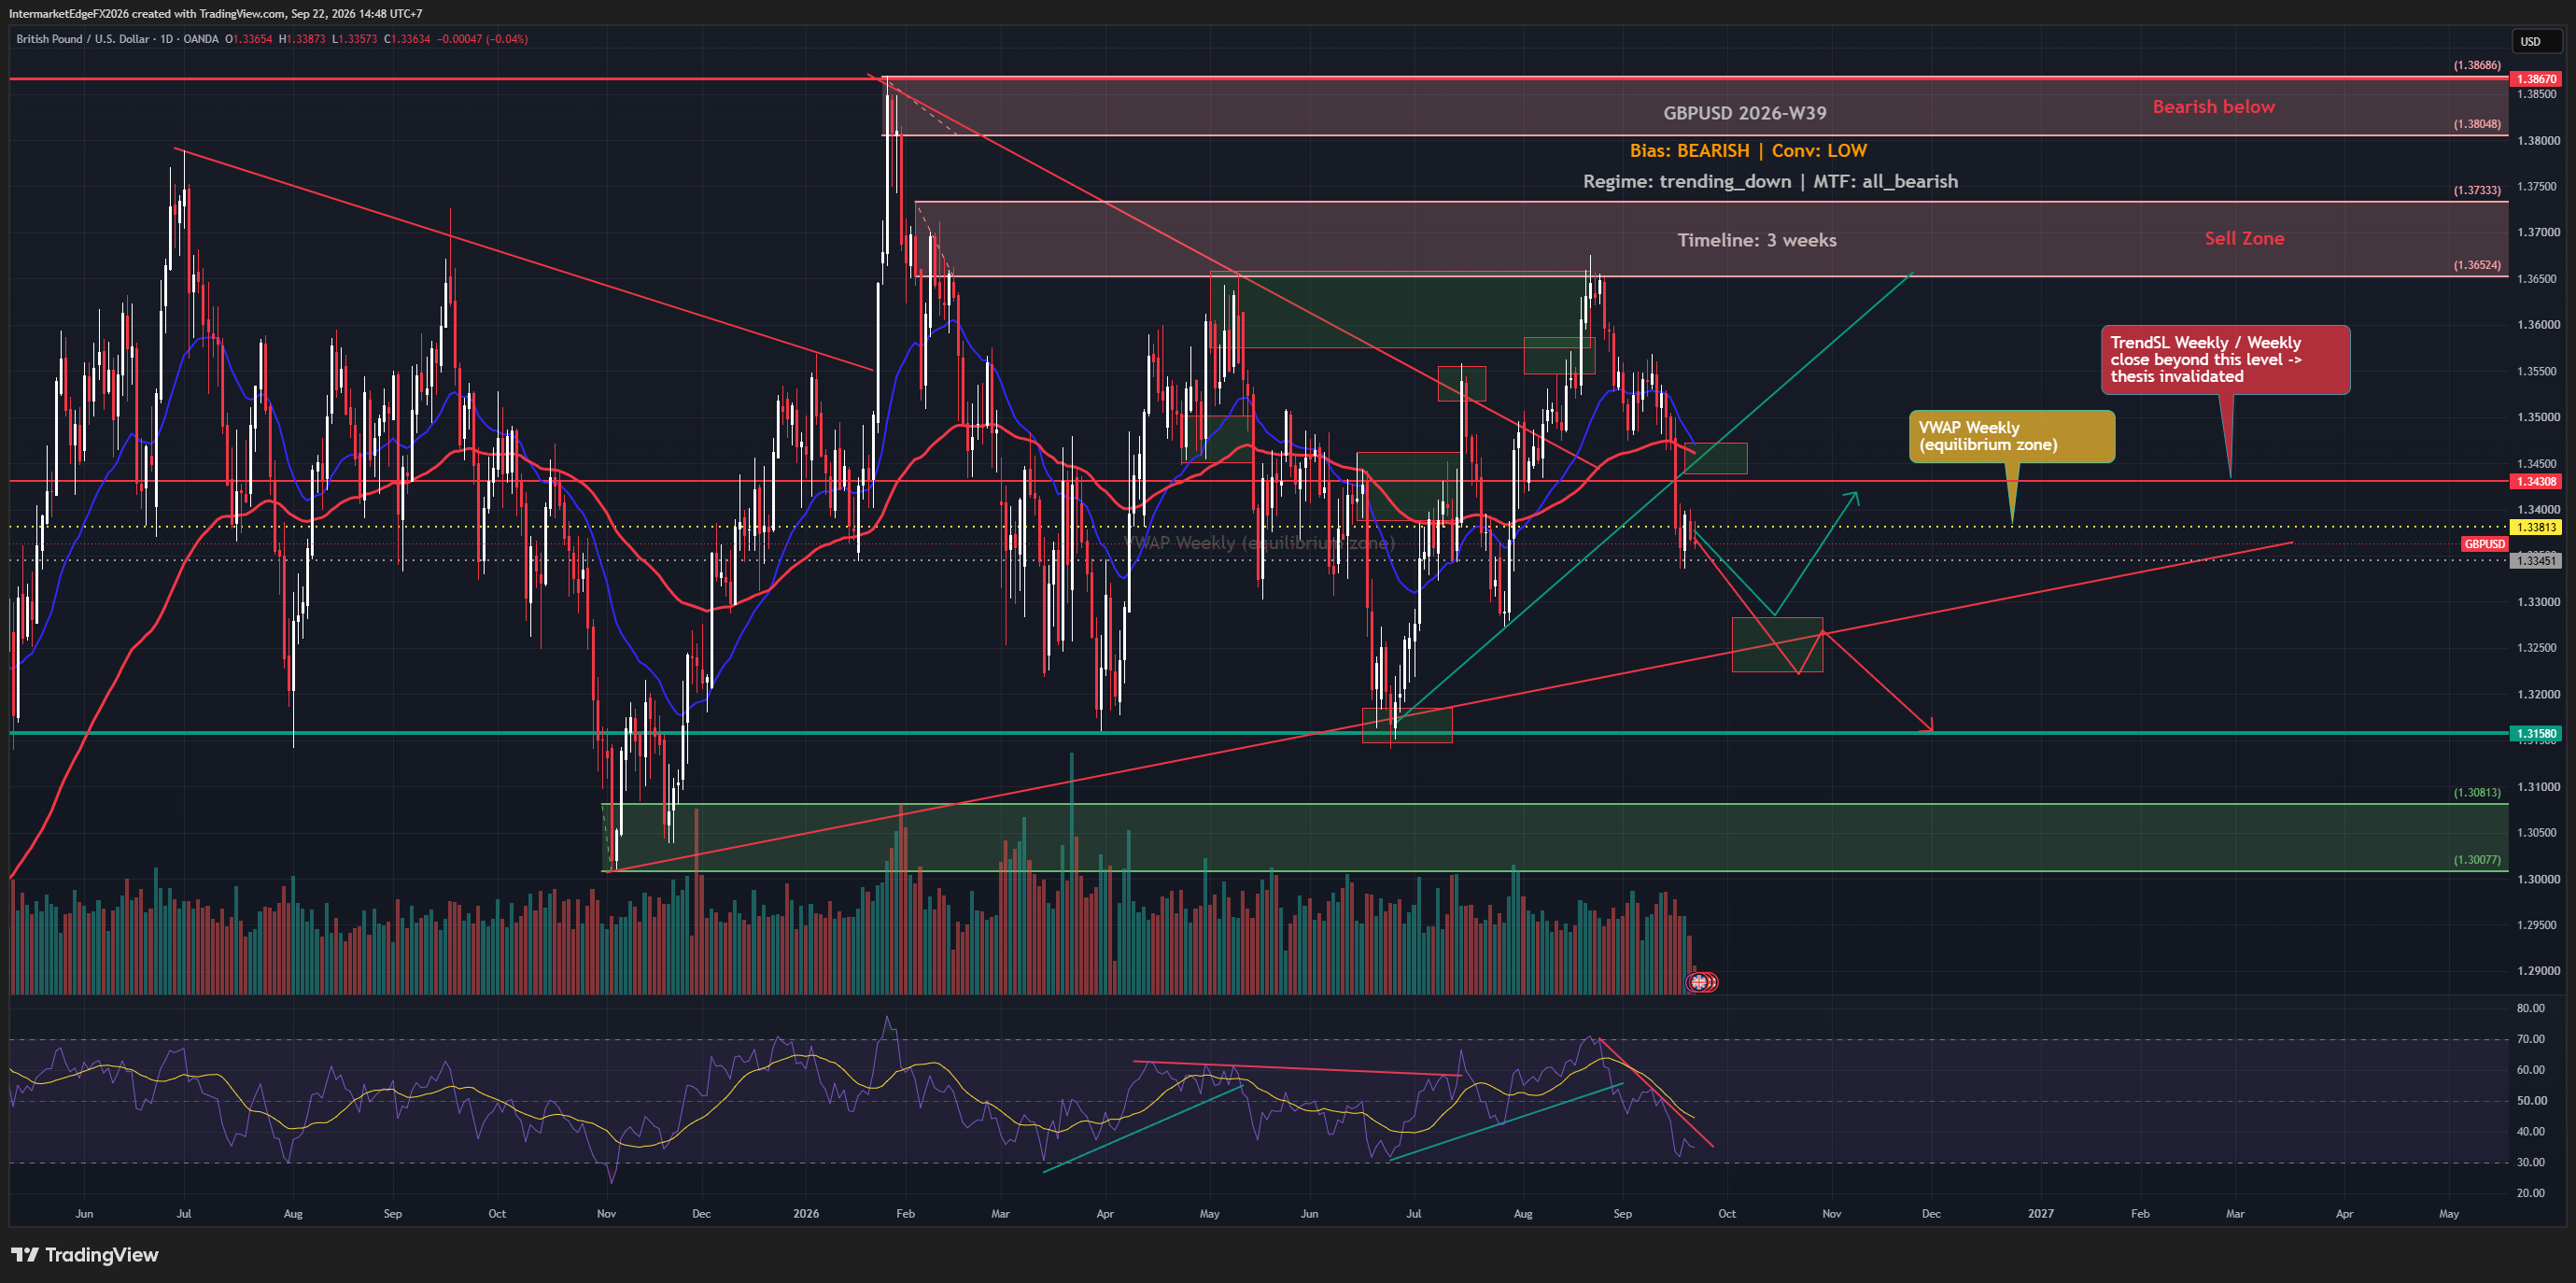
GBPUSD is trading at 1.35421 as of Tuesday, 18 August 2026, 06:14 UTC, trading below the weekly VWAP at 1.35532 while remaining above weekly TrendSL at 1.33774. The broader technical structure remains bullish, but price has lost the weekly VWAP in the short term. The available COT summary points to crowded long positioning, but it lacks the report week, release date, and exact net-position figure. Treat it as a directional risk flag, not standalone proof. The macro headwind from Fed real yields at 2.39% hasn't gone away. The framework carries a bearish bias on GBPUSD for the next three weeks, but the evidence supporting that bearish label is not currently strong enough to act on, and that distinction matters enormously. The primary bearish driver is the BOE-versus-Fed rate differential, where rising US real yields at 2.39% create structural pressure on GBPUSD by making dollar-denominated assets more attractive on a return-adjusted basis. A hawkish Fed, one that keeps real yields elevated even as nominal rate hike bets fluctuate, sustains that pressure without needing an outright rate increase. Layered on top is a qualified COT crowding risk: the available summary leans toward heavy sterling longs, but missing provenance prevents treating that description as a standalone statistic. When everyone is already long, the fuel for the next leg higher is thin, and any negative catalyst, a hot CPI that reprices UK rate cuts, or FOMC Minutes more hawkish than expected, can trigger a carry unwind, where traders exit leveraged long positions simultaneously, accelerating the move down far faster than fundamentals alone would justify. However, the higher-timeframe structure remains aligned bullish. Price remains above weekly TrendSL at 1.33774, but it has slipped below weekly VWAP at 1.35532. Short-term momentum now supports the bearish warning while the broader trend still conflicts with it. That technical structure directly contradicts the bearish label. -- Intermarket Edge (

XAUUSD Week W34-2026: Fed-Hike Bets Collapse and Gold Climbs, But the Structural Ceiling at 4438 Remains Unbroken

XAUUSD Week W34-2026: Fed-Hike Bets Collapse and Gold Climbs, But the Structural Ceiling at 4438 Remains Unbroken

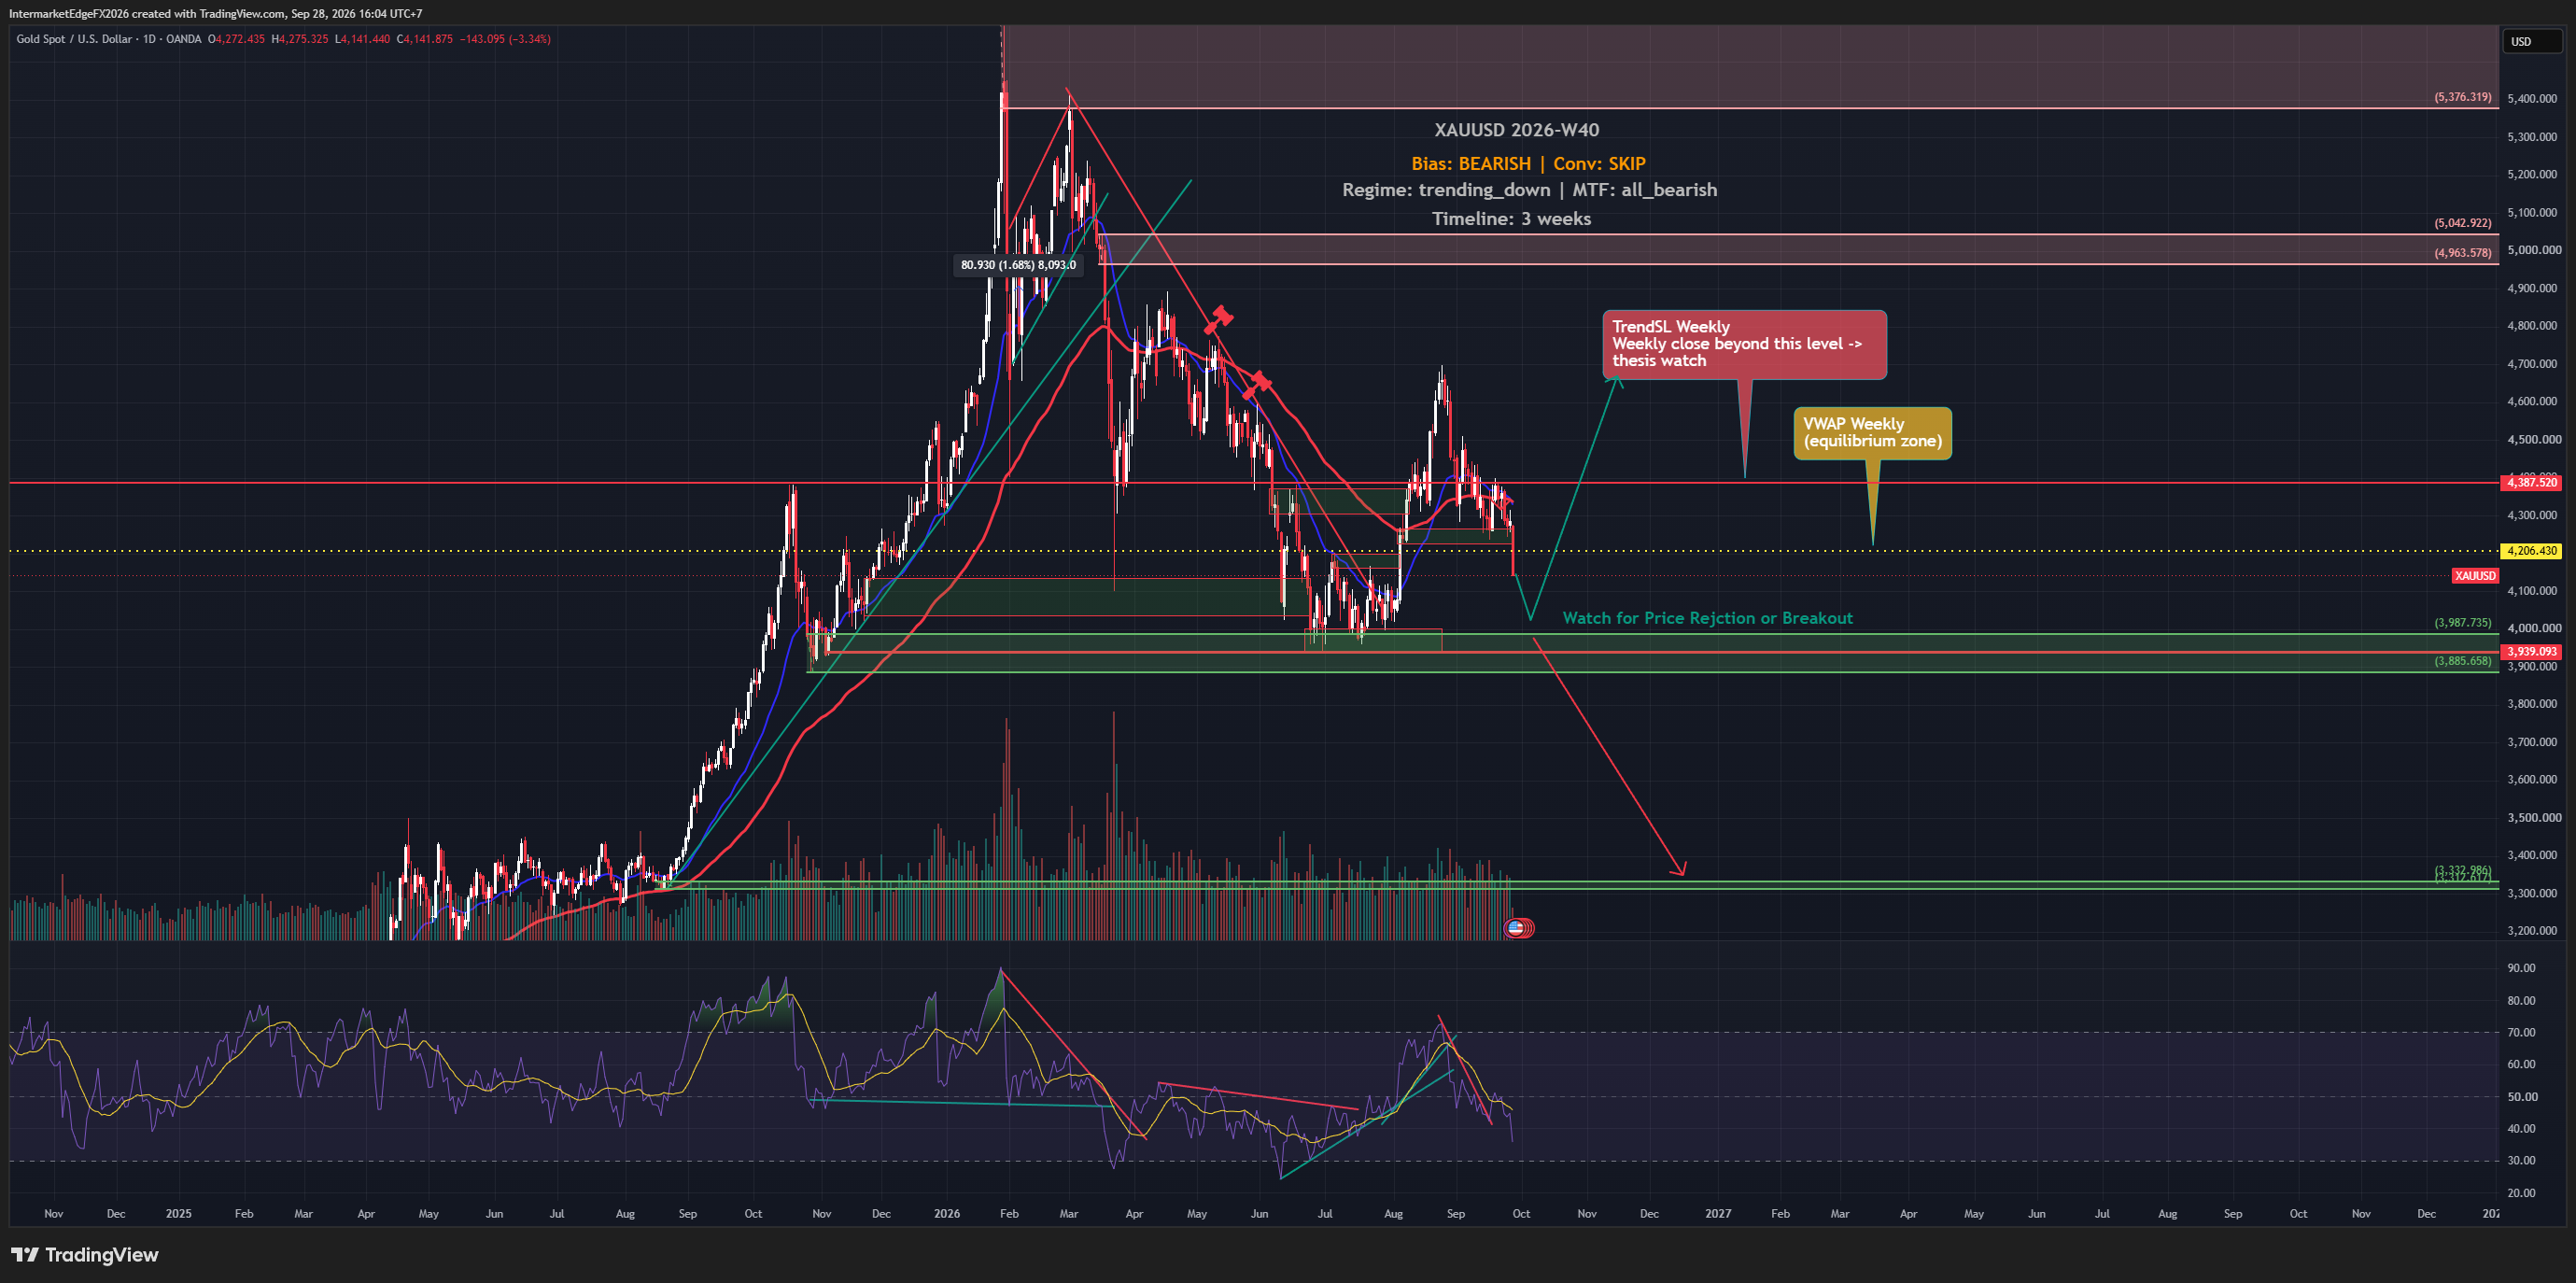
Gold is climbing toward $4,400 as Fed rate-hike bets collapse and the dollar softens, yet the bullish structure is not yet confirmed. Price on Monday, 17 August 2026 sits at 4394.5, marginally above the weekly VWAP but still well below the key trend structure level at 4438.43. The driver that was supposed to cap gold, Fed hawkishness, has been largely invalidated by the market itself, flipping the conventional bearish narrative on its head. The framework's bias for XAUUSD this week is bullish, but that label requires immediate qualification: conviction is low, and the structural picture at the time of thesis generation actually argues against the bullish call rather than supporting it. The reference close price of 4397.83 was already sitting below the weekly trend structure level at 4438.43 when the thesis was set, which means the bullish label is a directional lean, driven primarily by price action and COT positioning, not a technically confirmed trend. That distinction matters because it changes how much weight any given piece of confirming evidence should carry. The two active pillars supporting the bullish case are price behavior and COT positioning. On the COT side, commercial and speculative positioning in Comex gold futures and options as of the August 14 report leans bullish, but the specific net-position figure and the precise breakdown between commercial hedgers and large speculators are not available here, so this should be read as directional evidence, not a citable standalone number. On price, the multi-timeframe alignment is described as bullish-mixed: some shorter timeframes confirm the directional lean, others do not. Cutting across both pillars is a live Fed-hawkish causal chain that argues the opposite direction, rising real yields reducing gold's appeal, and these forces are partially offsetting each other right now. -- Intermarket Edge (Note: COT (Commitment of Traders) data is released weekly by the CFTC with a reporting-period lag -- it is no

DXY Week W34-2026: Retail Sales Shock Sends Dollar Testing 99.485 VWAP, But a Crowded Short Could Flip the Move

DXY Week W34-2026: Retail Sales Shock Sends Dollar Testing 99.485 VWAP, But a Crowded Short Could Flip the Move

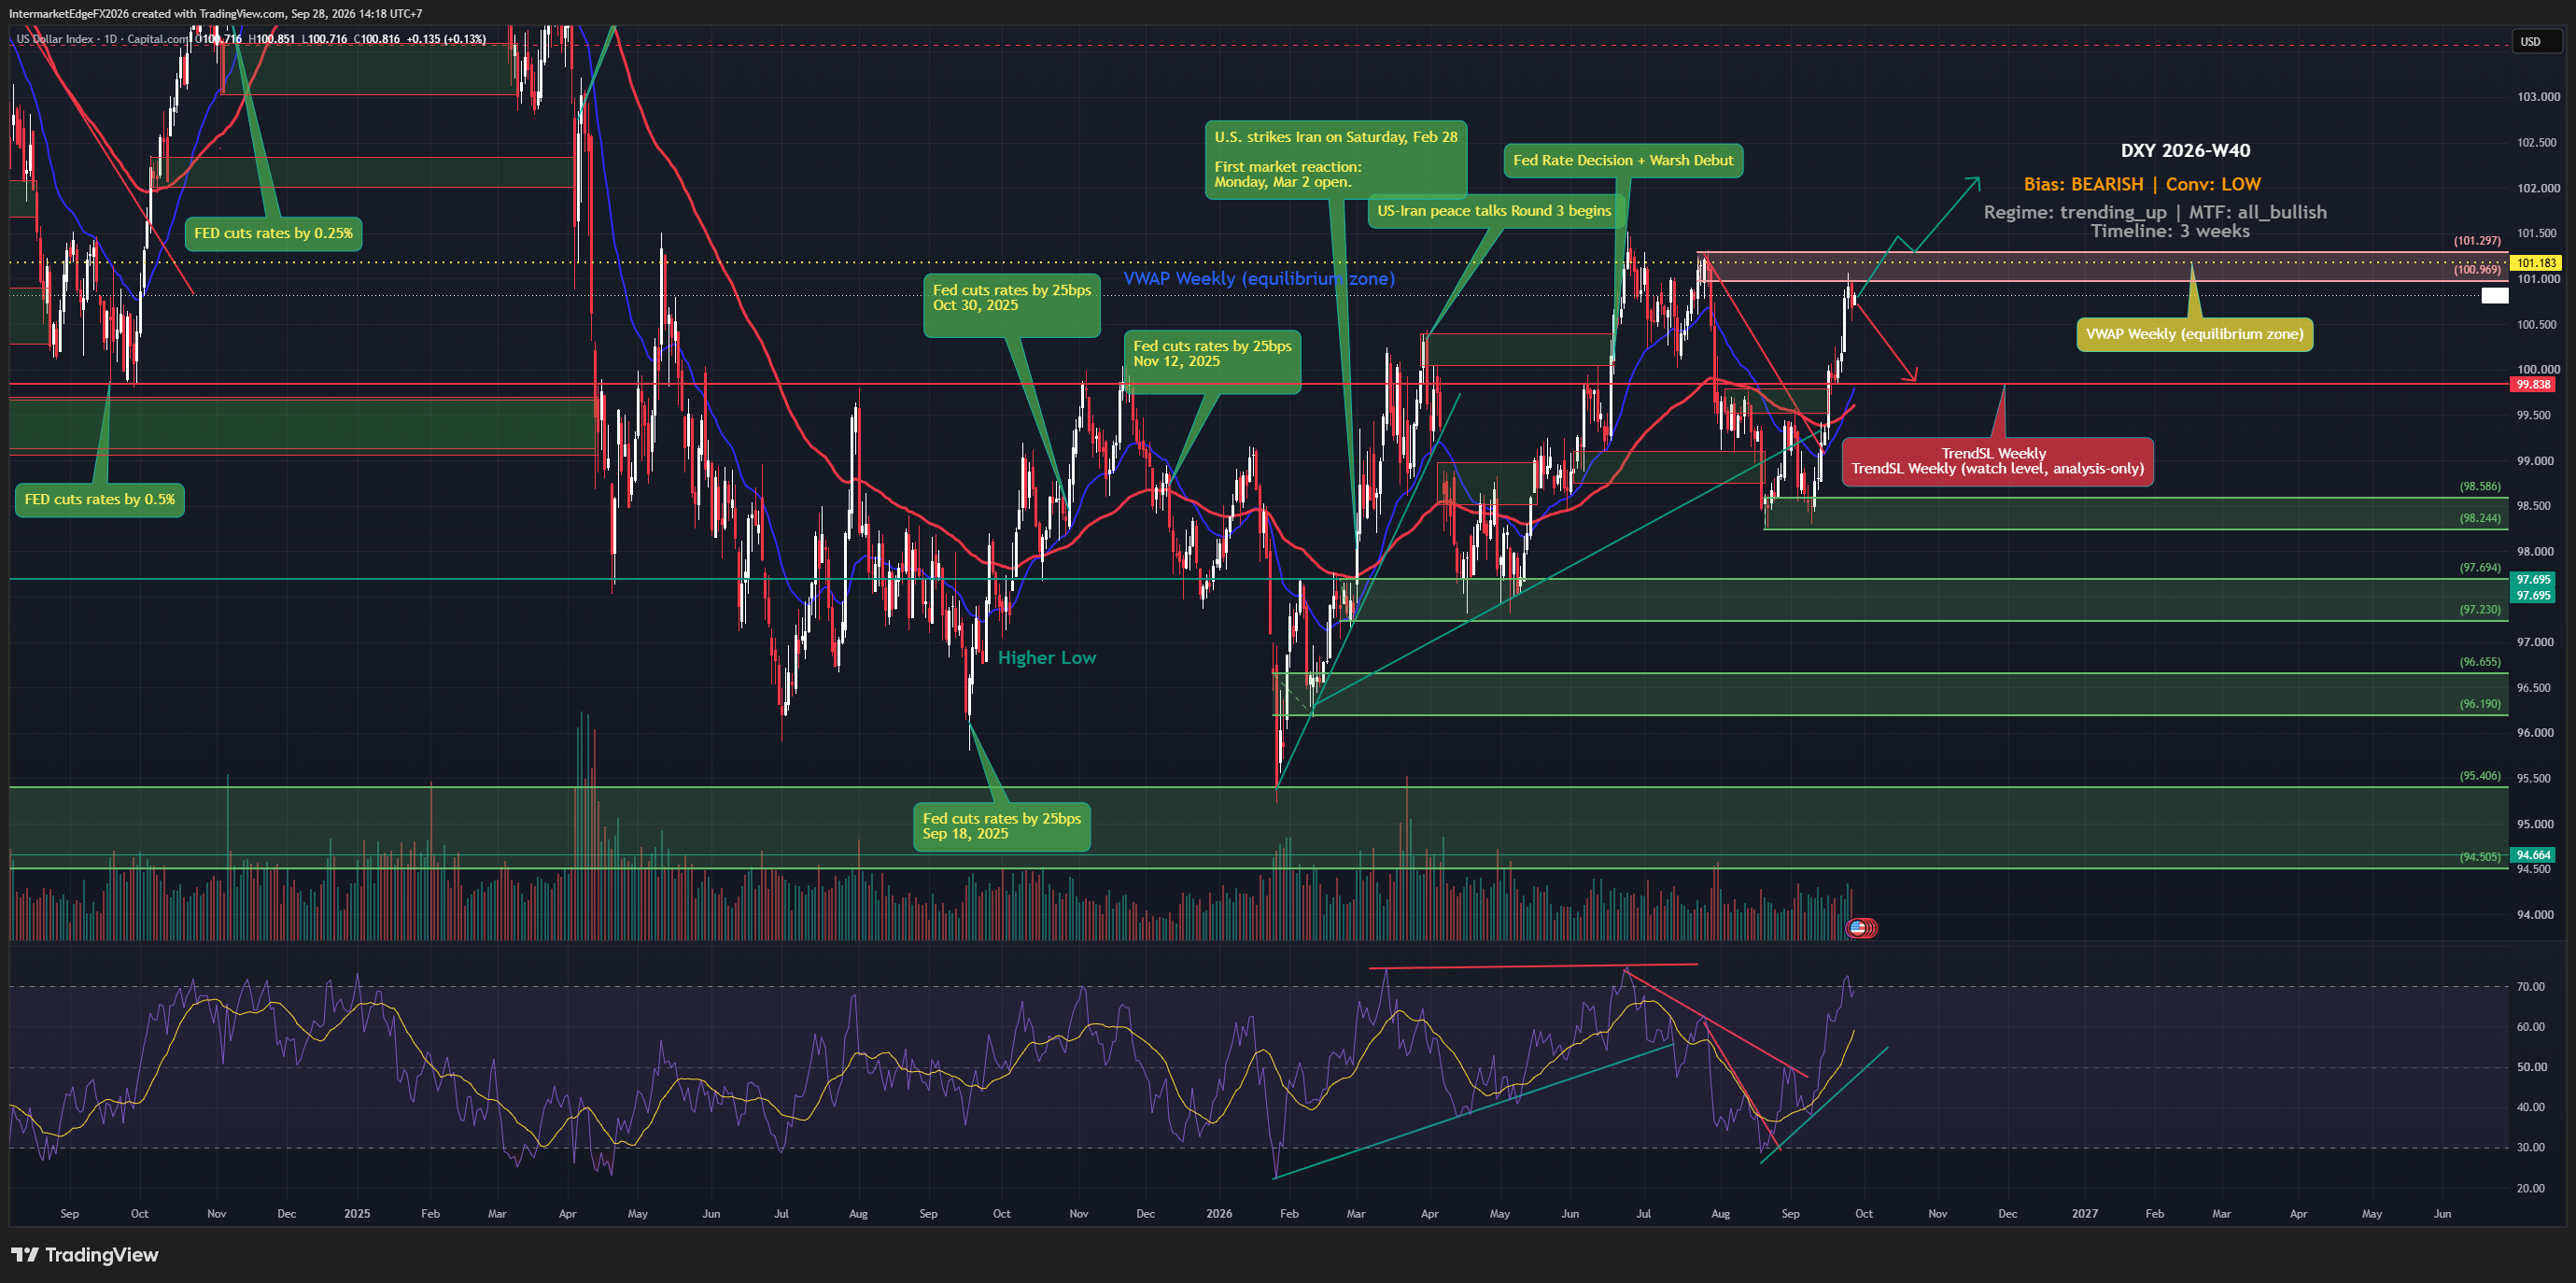
The dollar is under quiet but persistent pressure this week, with DXY trading at 99.479 as of Monday 17 August 2026, just a fraction below its weekly VWAP at 99.485, testing from underneath. A surprise drop in US retail sales, a consumer sentiment index that collapsed to 51.0 against a 54.2 expectation, and a core CPI print of 0.0% against a 0.2% forecast have combined to erode the fundamental case for a stronger dollar, even as yields stay elevated. The direction leans bearish, but the evidence is not yet convincing enough to size a position. The overall lean for DXY this week is bearish, and the trend regime is clearly downward, but the conviction supporting that bias is deliberately low, and the analysis here reflects a decision to stand aside rather than treat the bearish lean as an actionable entry signal. Here is why that matters: the framework shows a direct conflict between what price has been doing and what institutional positioning implies. Price action has been constructive, technically, the trend has shown some bullish characteristics. But commitments of traders data shows leveraged funds sitting at extreme short positioning. That divergence creates what traders call crowding risk on the short side: if the majority of active participants are already short (note, the COT figures cited here reflect directional scoring from the brief and do not specify the exact report week or net-position count, so treat this as directional evidence rather than a standalone citable statistic), there are fewer fresh sellers left to push the dollar lower, and any positive catalyst can trigger a sharp short-covering rally that has nothing to do with fundamentals changing. -- Intermarket Edge

USDJPY W33: The Uptrend Meets a Yen Intervention Test

USDJPY W33: The Uptrend Meets a Yen Intervention Test

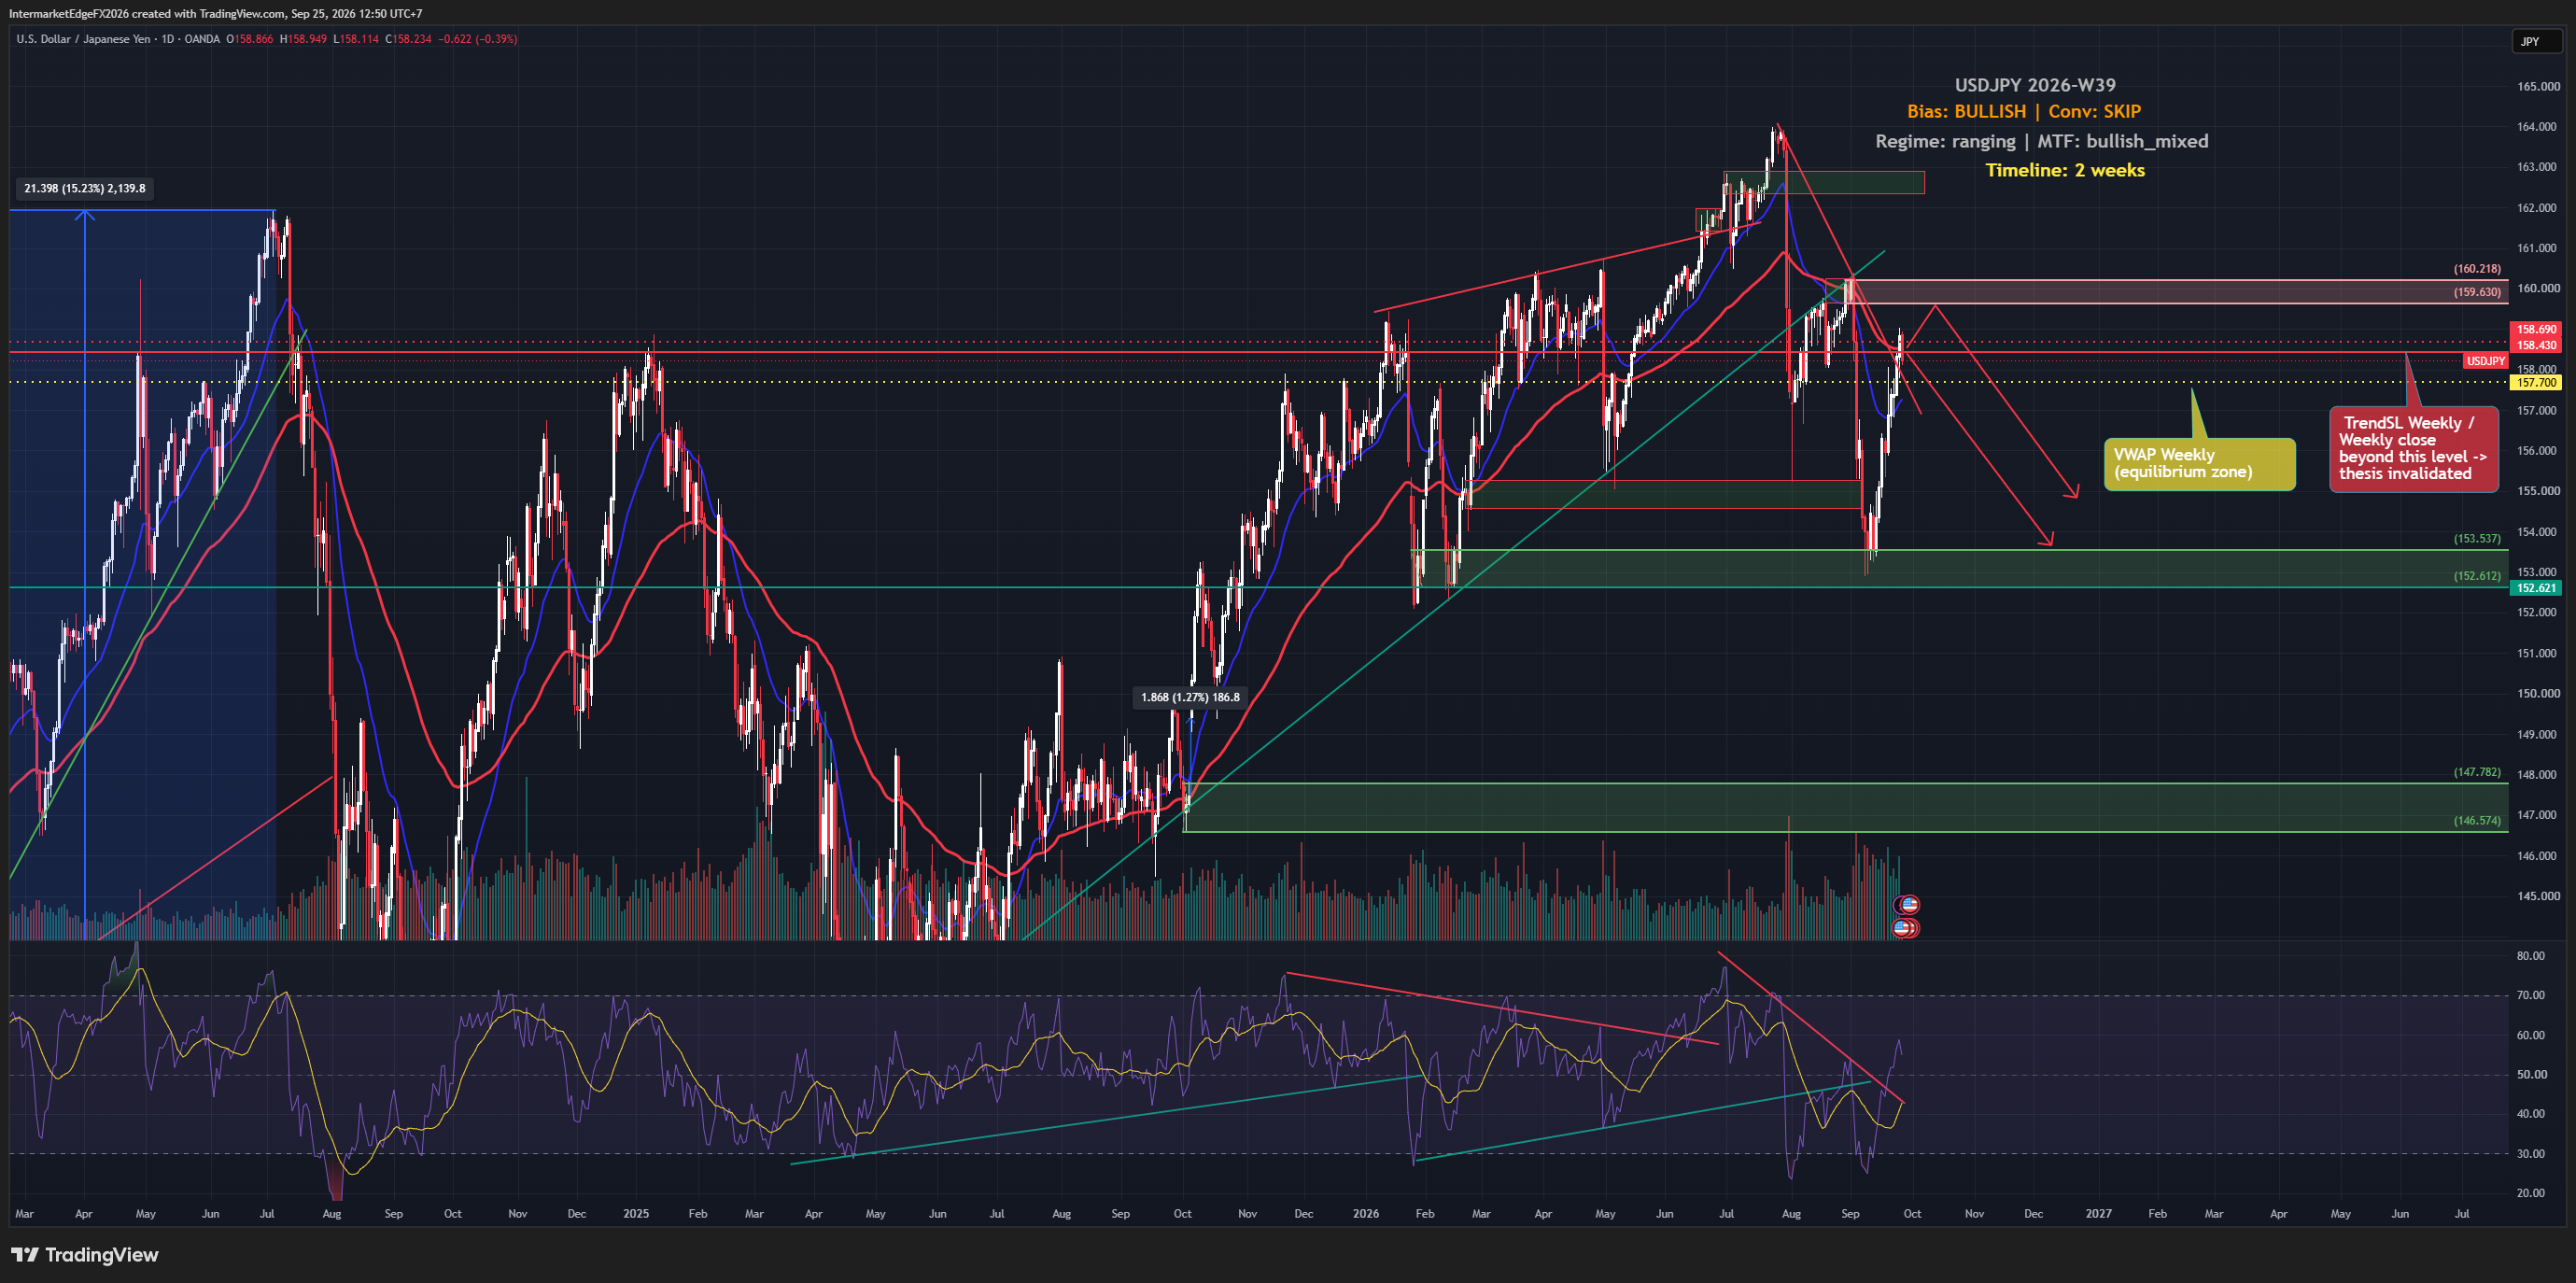
The yen is heading for a weekly loss and Reuters is already reporting bets for another intervention, yet USDJPY is trading below its weekly VWAP at 159.35 as of Friday, 14 August 2026, meaning short-term momentum is running against the very bullish structure that underpins the trend. The Fed-BOJ rate differential remains the most extreme in the G7, but a flat CPI print has cooled rate-hike expectations. The setup is directionally bullish but tactically uncomfortable right now. The directional case for USDJPY remains bullish, but the conviction sitting behind that call is deliberately low, not because the trend is broken, but because the evidence is not yet strong enough to justify sizing a position with confidence. The Fed-BOJ rate differential is the structural anchor: the US 10-year yield at 4.7% against a BOJ that is only beginning to normalize policy creates the widest carry spread in the G7, and COT positioning data, which tracks how large speculative and commercial participants are positioned in futures markets, has been leaning bullish, suggesting the broader market has not abandoned the yen-weakness trade. The caveat is that the COT read here is directional evidence rather than a precise citable statistic, since the brief does not specify the exact report week or net-position figure. What makes the current picture complicated is a direct and acknowledged signal conflict: the Fed's hawkish stance is bullish for USDJPY, while the BOJ's own hawkish pivot is bearish, because a BOJ rate hike erodes the yield advantage that makes holding yen-funded carry trades profitable. Both signals carry equal analytical weight. Add to that a CPI miss that has already begun to cool hike expectations, and the macro pillar of the bullish case is noticeably thinner than it was a week ago. -- Intermarket Edge

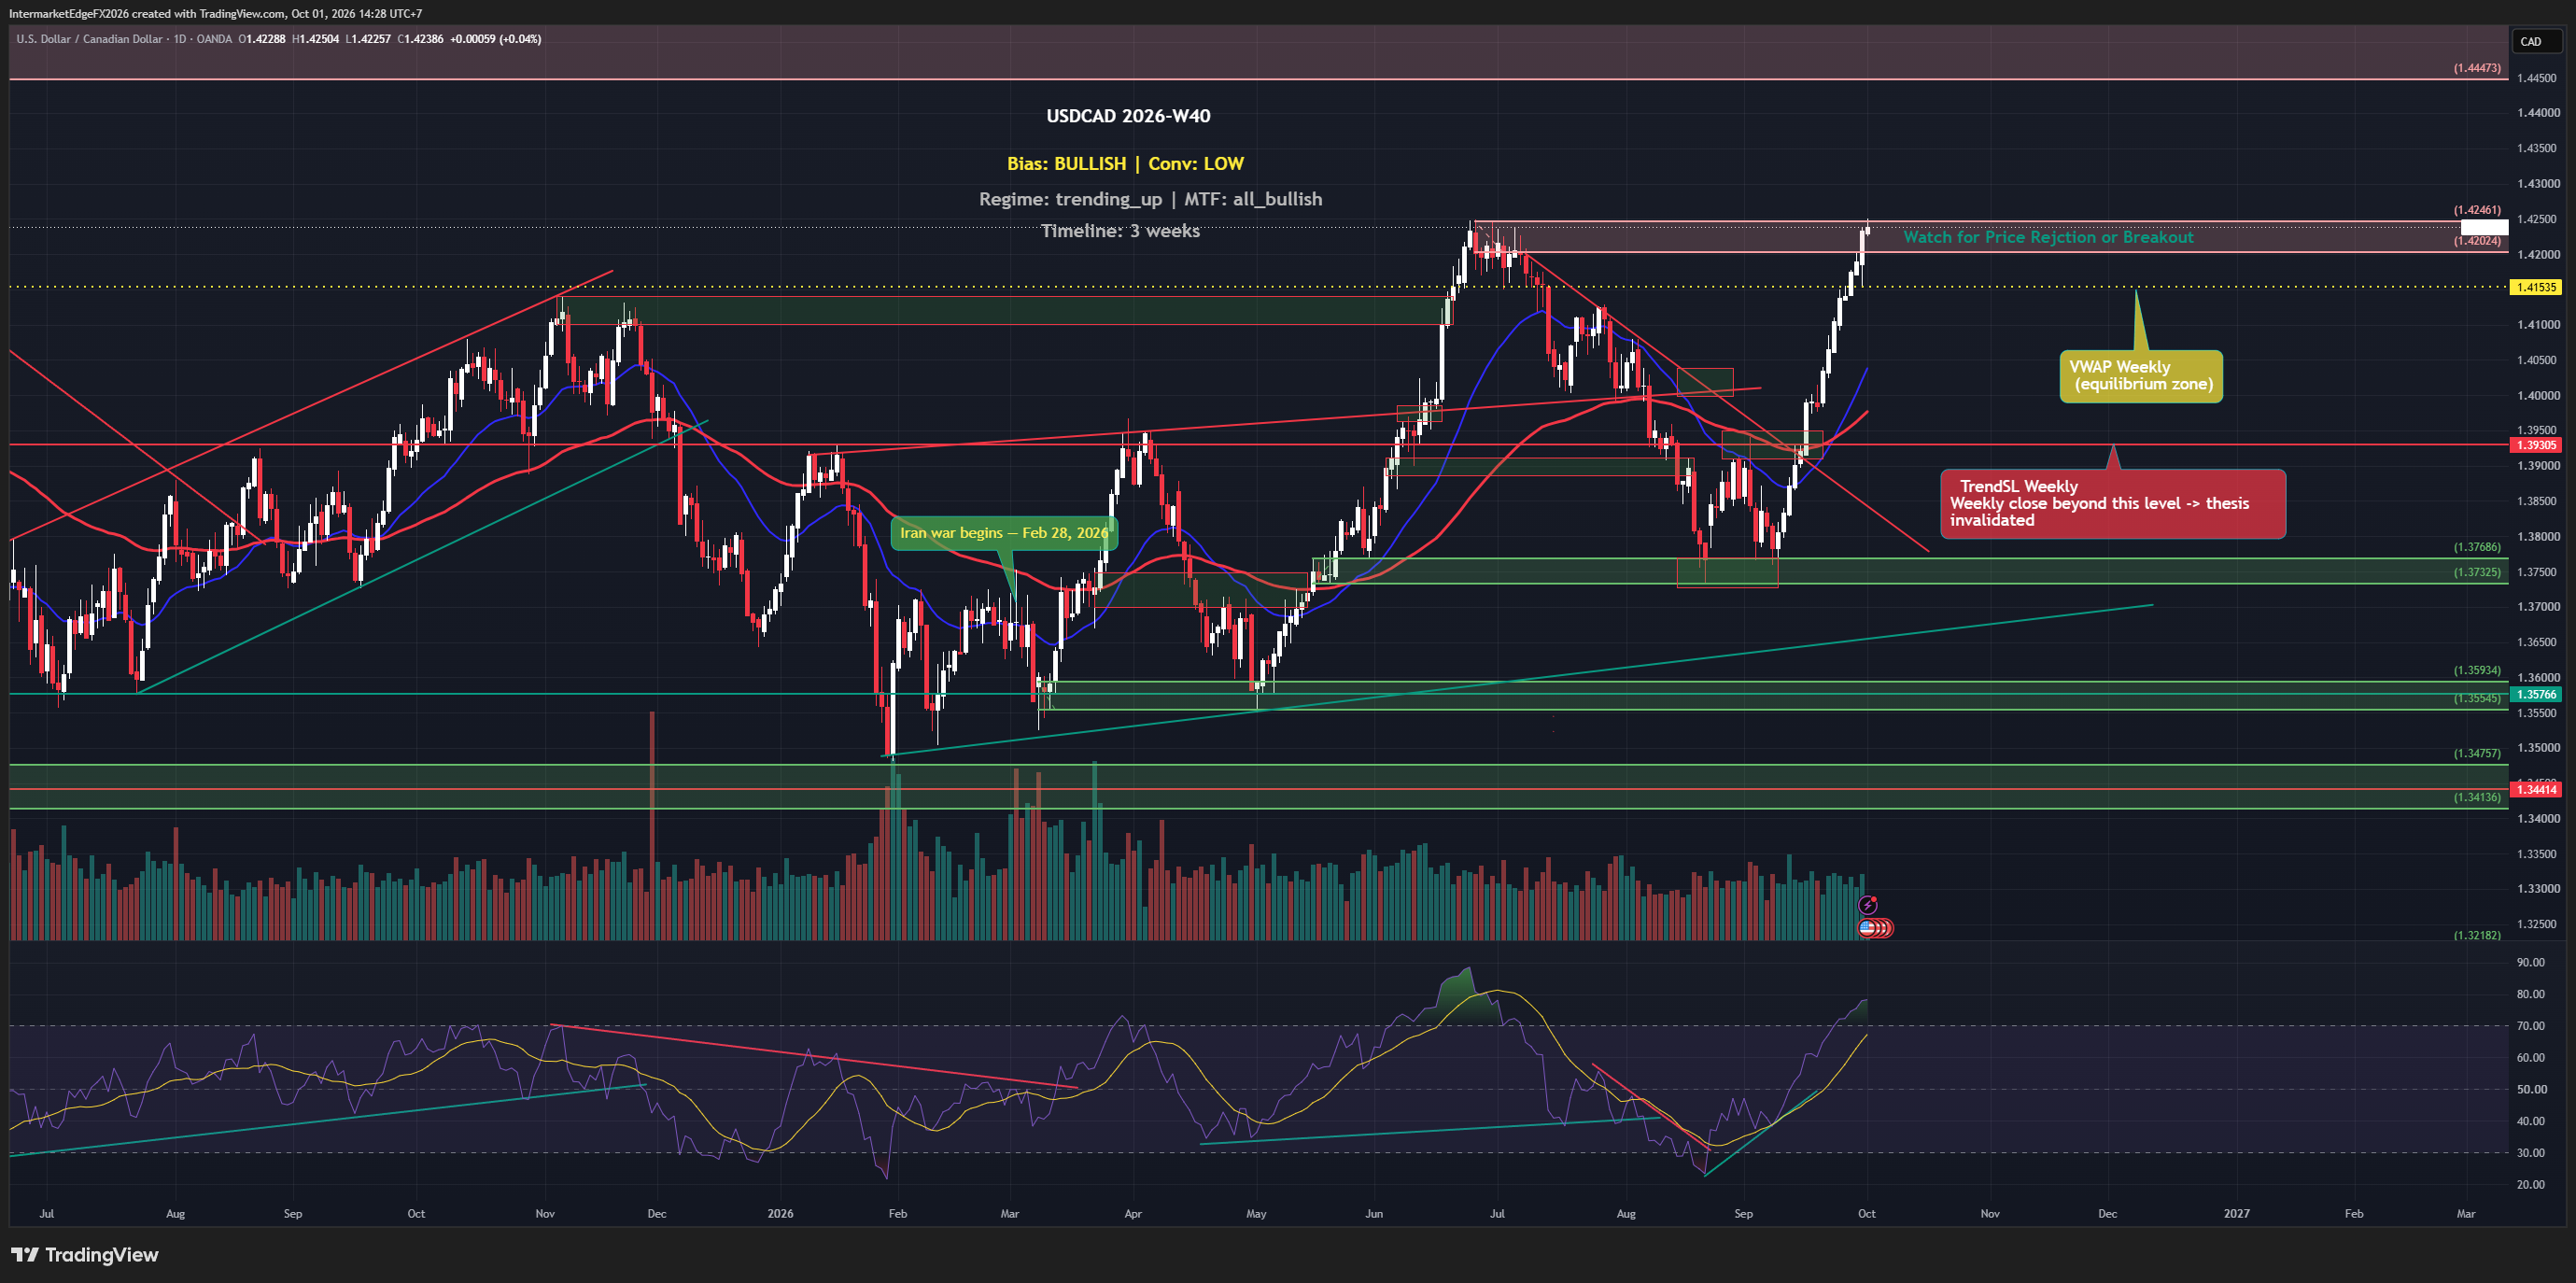
USDCAD W33: The Bullish Thesis Is Still Waiting for Price

USDCAD W33: The Bullish Thesis Is Still Waiting for Price

USDCAD carries a bullish bias into Week W33-2026, yet every timeframe is aligned against that label. A core CPI miss, actual 0.0% versus the 0.2% forecast, has already taken pressure off the Fed narrative, and the Canadian dollar hit a two-month high as oil prices rose. The bullish case is real but structurally unconfirmed, and that gap between label and structure is exactly where traders get hurt. The framework carries a bullish bias on USDCAD for the next three weeks at medium conviction, meaning there is a directional view, but the evidence is not strong enough to treat it as a high-confidence positioning decision. The core argument rests on two pillars: Fed hawkishness anchored by elevated real yields, and a persistent rate differential that historically favours USD over CAD. Those fundamentals have not collapsed; they have simply been pressured by this week's inflation data and Canadian-specific positive news flow. What makes this setup genuinely difficult is a structural contradiction that was present from the moment the thesis was generated: the reference price at thesis time (1.39479) was already sitting below the weekly trend stop level (1.39824). That means the bullish label was issued without technical confirmation behind it, the trend structure was already contradicting the directional call. Traders should treat this as a low-confidence rule-engine override, not a textbook bullish setup. Compounding this, COT data shows speculator positioning is at extreme short levels, a condition called crowding risk, which refers to the danger that when too many traders are on the same side, any reversal can be violent and self-reinforcing as they all exit simultaneously. That crowding raises the probability of a short squeeze (a rapid covering rally driven by stop-loss orders rather than genuine demand) that could temporarily push USDCAD lower even as the fundamental bias points higher. -- Intermarket Edge (Note: COT (Commitment of Traders) data is released weekly

USOIL Week W33-2026: Inventory Builds and Hormuz Uncertainty Leave Oil Caught Between 81.12 and 85.31

USOIL Week W33-2026: Inventory Builds and Hormuz Uncertainty Leave Oil Caught Between 81.12 and 85.31

USOIL is trading at 82.90 on the CL=F futures contract used as proxy, caught between a four-week streak of crude inventory builds averaging above 1.5 million barrels and a COT positioning read that still leans bullish. The macro story, rising real yields, a stronger dollar impulse, and China's structural shift away from gasoline, points lower. But price has not broken down yet, and that gap between the fundamental case and actual price behavior is exactly where traders get into trouble this week. The framework's output for W33-2026 is a bearish bias on USOIL, but the conviction is deliberately low, and that low conviction is not a soft bearish call, it is a signal that the evidence is conflicted enough to warrant real caution before sizing any directional position. Here is why the conflict matters: price, COT positioning, and the technical read all carry bullish signals in isolation. COT data shows a bullish lean among non-commercial participants, though the brief does not specify the exact report week, net-position figure, or sample, so this should be read as directional evidence rather than a precise citable statistic. Price itself is above the weekly VWAP at 82.90, meaning short-term momentum has not rolled over yet. And the multi-timeframe alignment reads as bullish-mixed, not cleanly bearish. What flips the framework's output to bearish despite all that is the macro overlay: the combination of a rising real yield environment creating dollar-bullish pressure, four consecutive weeks of crude inventory accumulation averaging above 1.5 million barrels per the EIA's actual reported figures, and the structural demand erosion from China's accelerating EV adoption together form a weight that the bullish positioning signals have not yet been able to lift price through. -- Intermarket Edge

Stay in the loop

Get notified about new research, macro insights, and market analysis.

InterMarketEdge

© 2026 InterMarketEdge. Financial intelligence for inter-market traders.