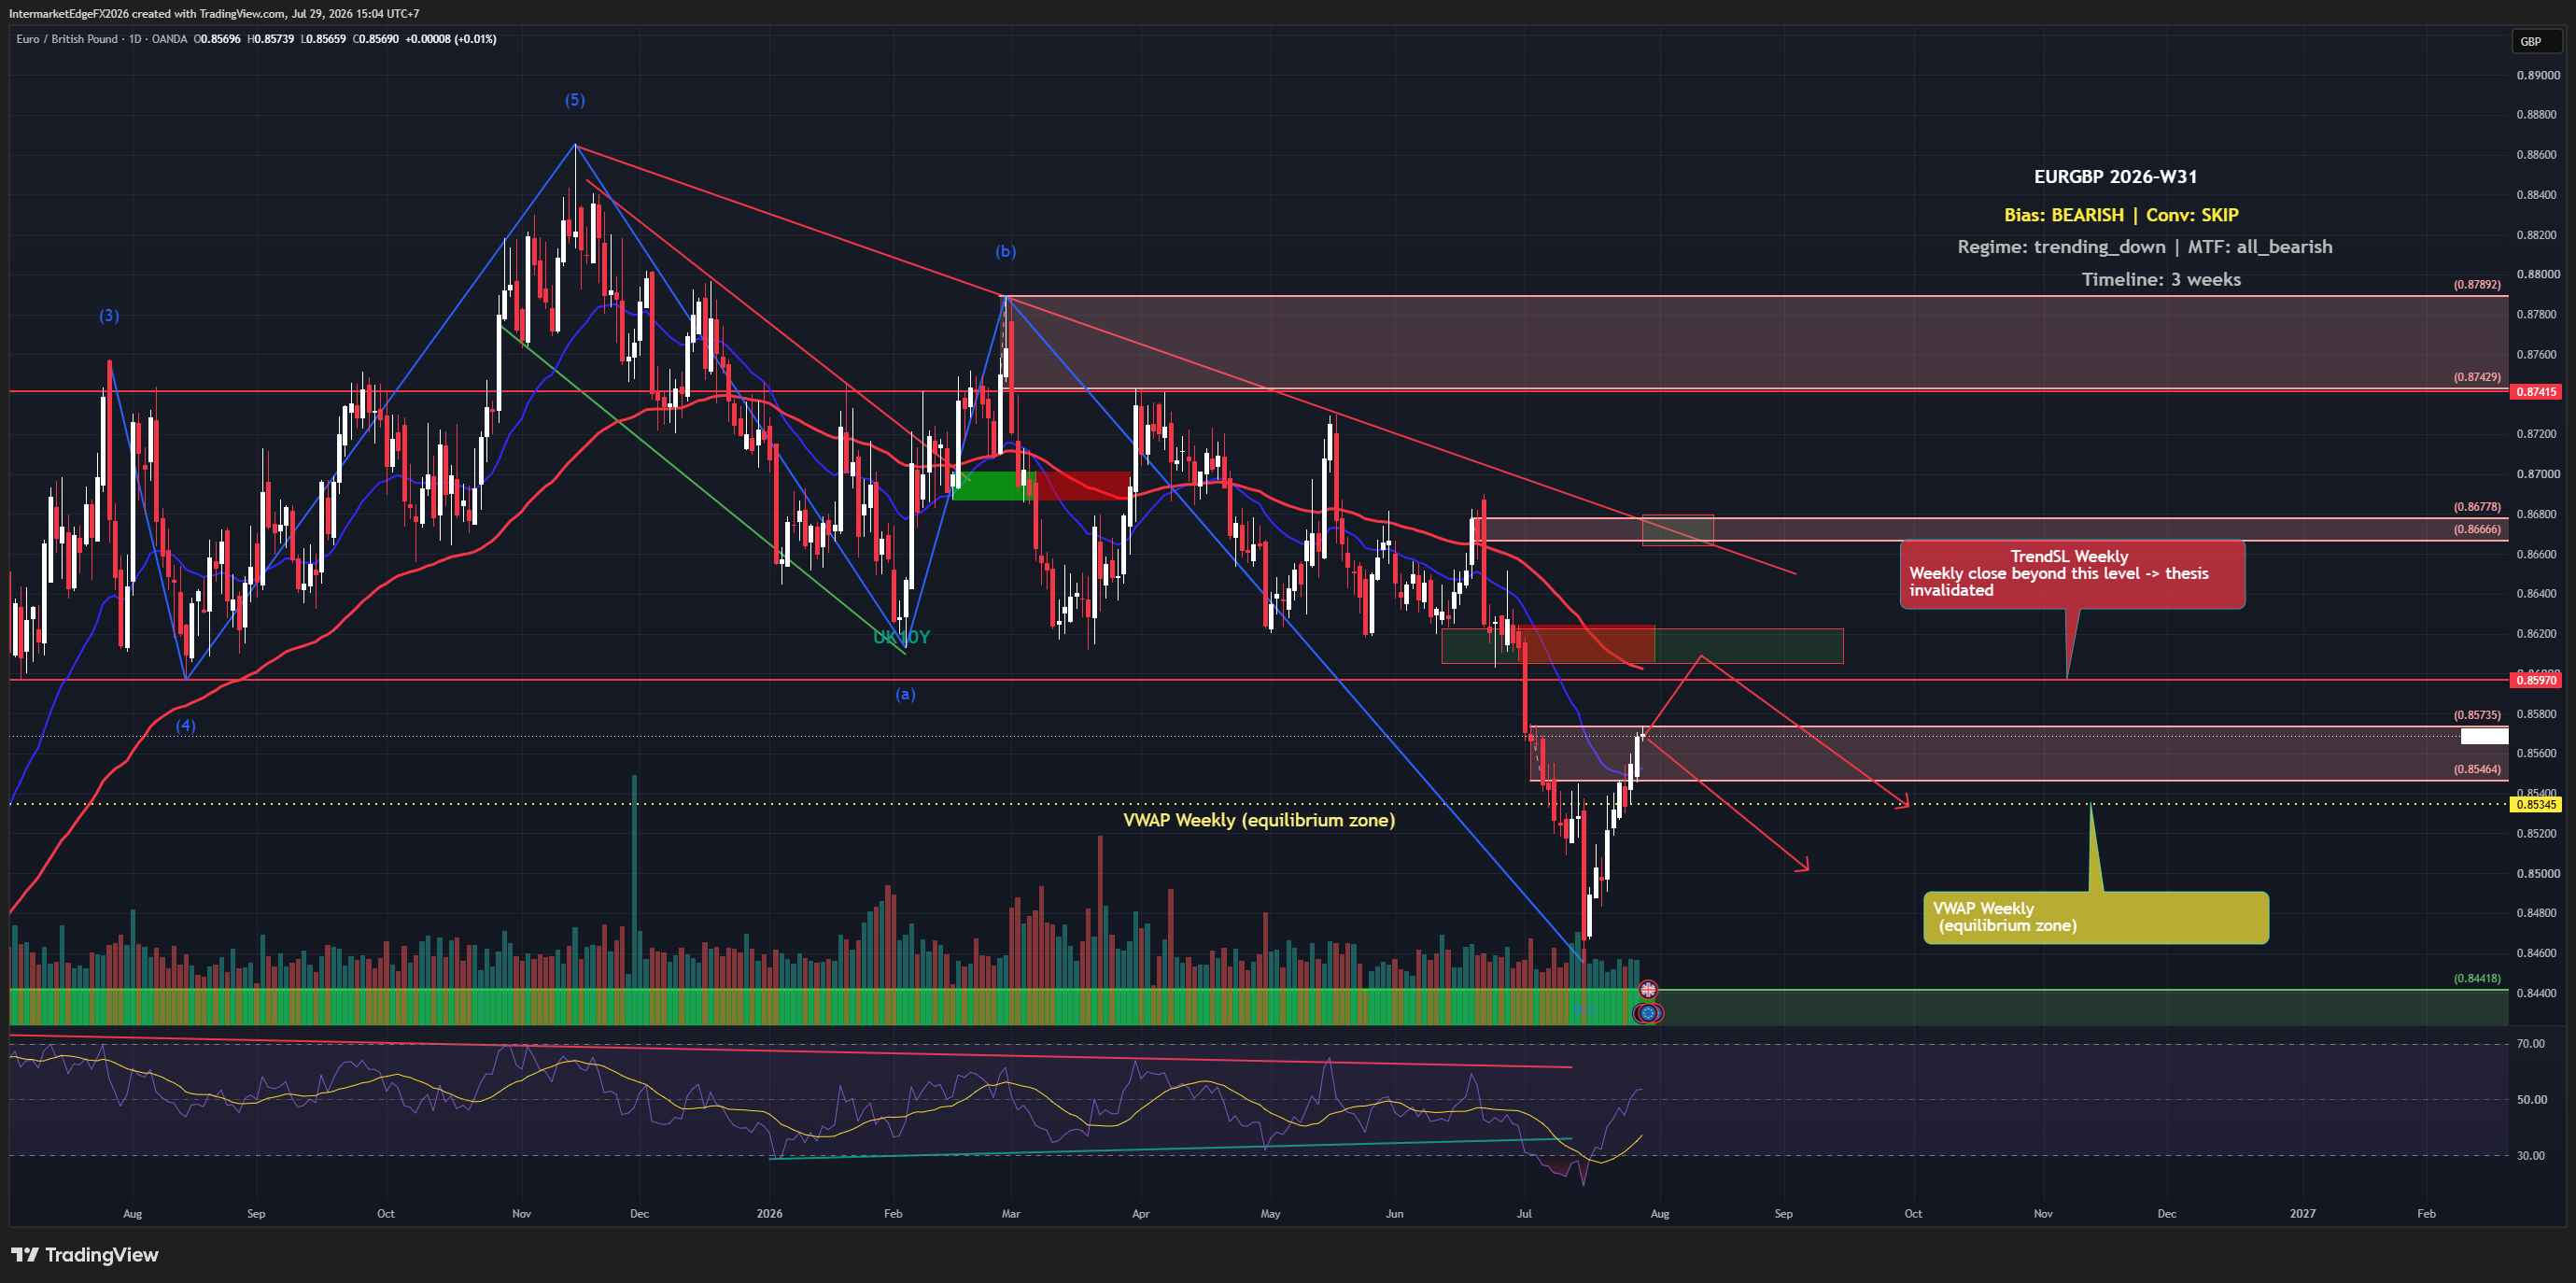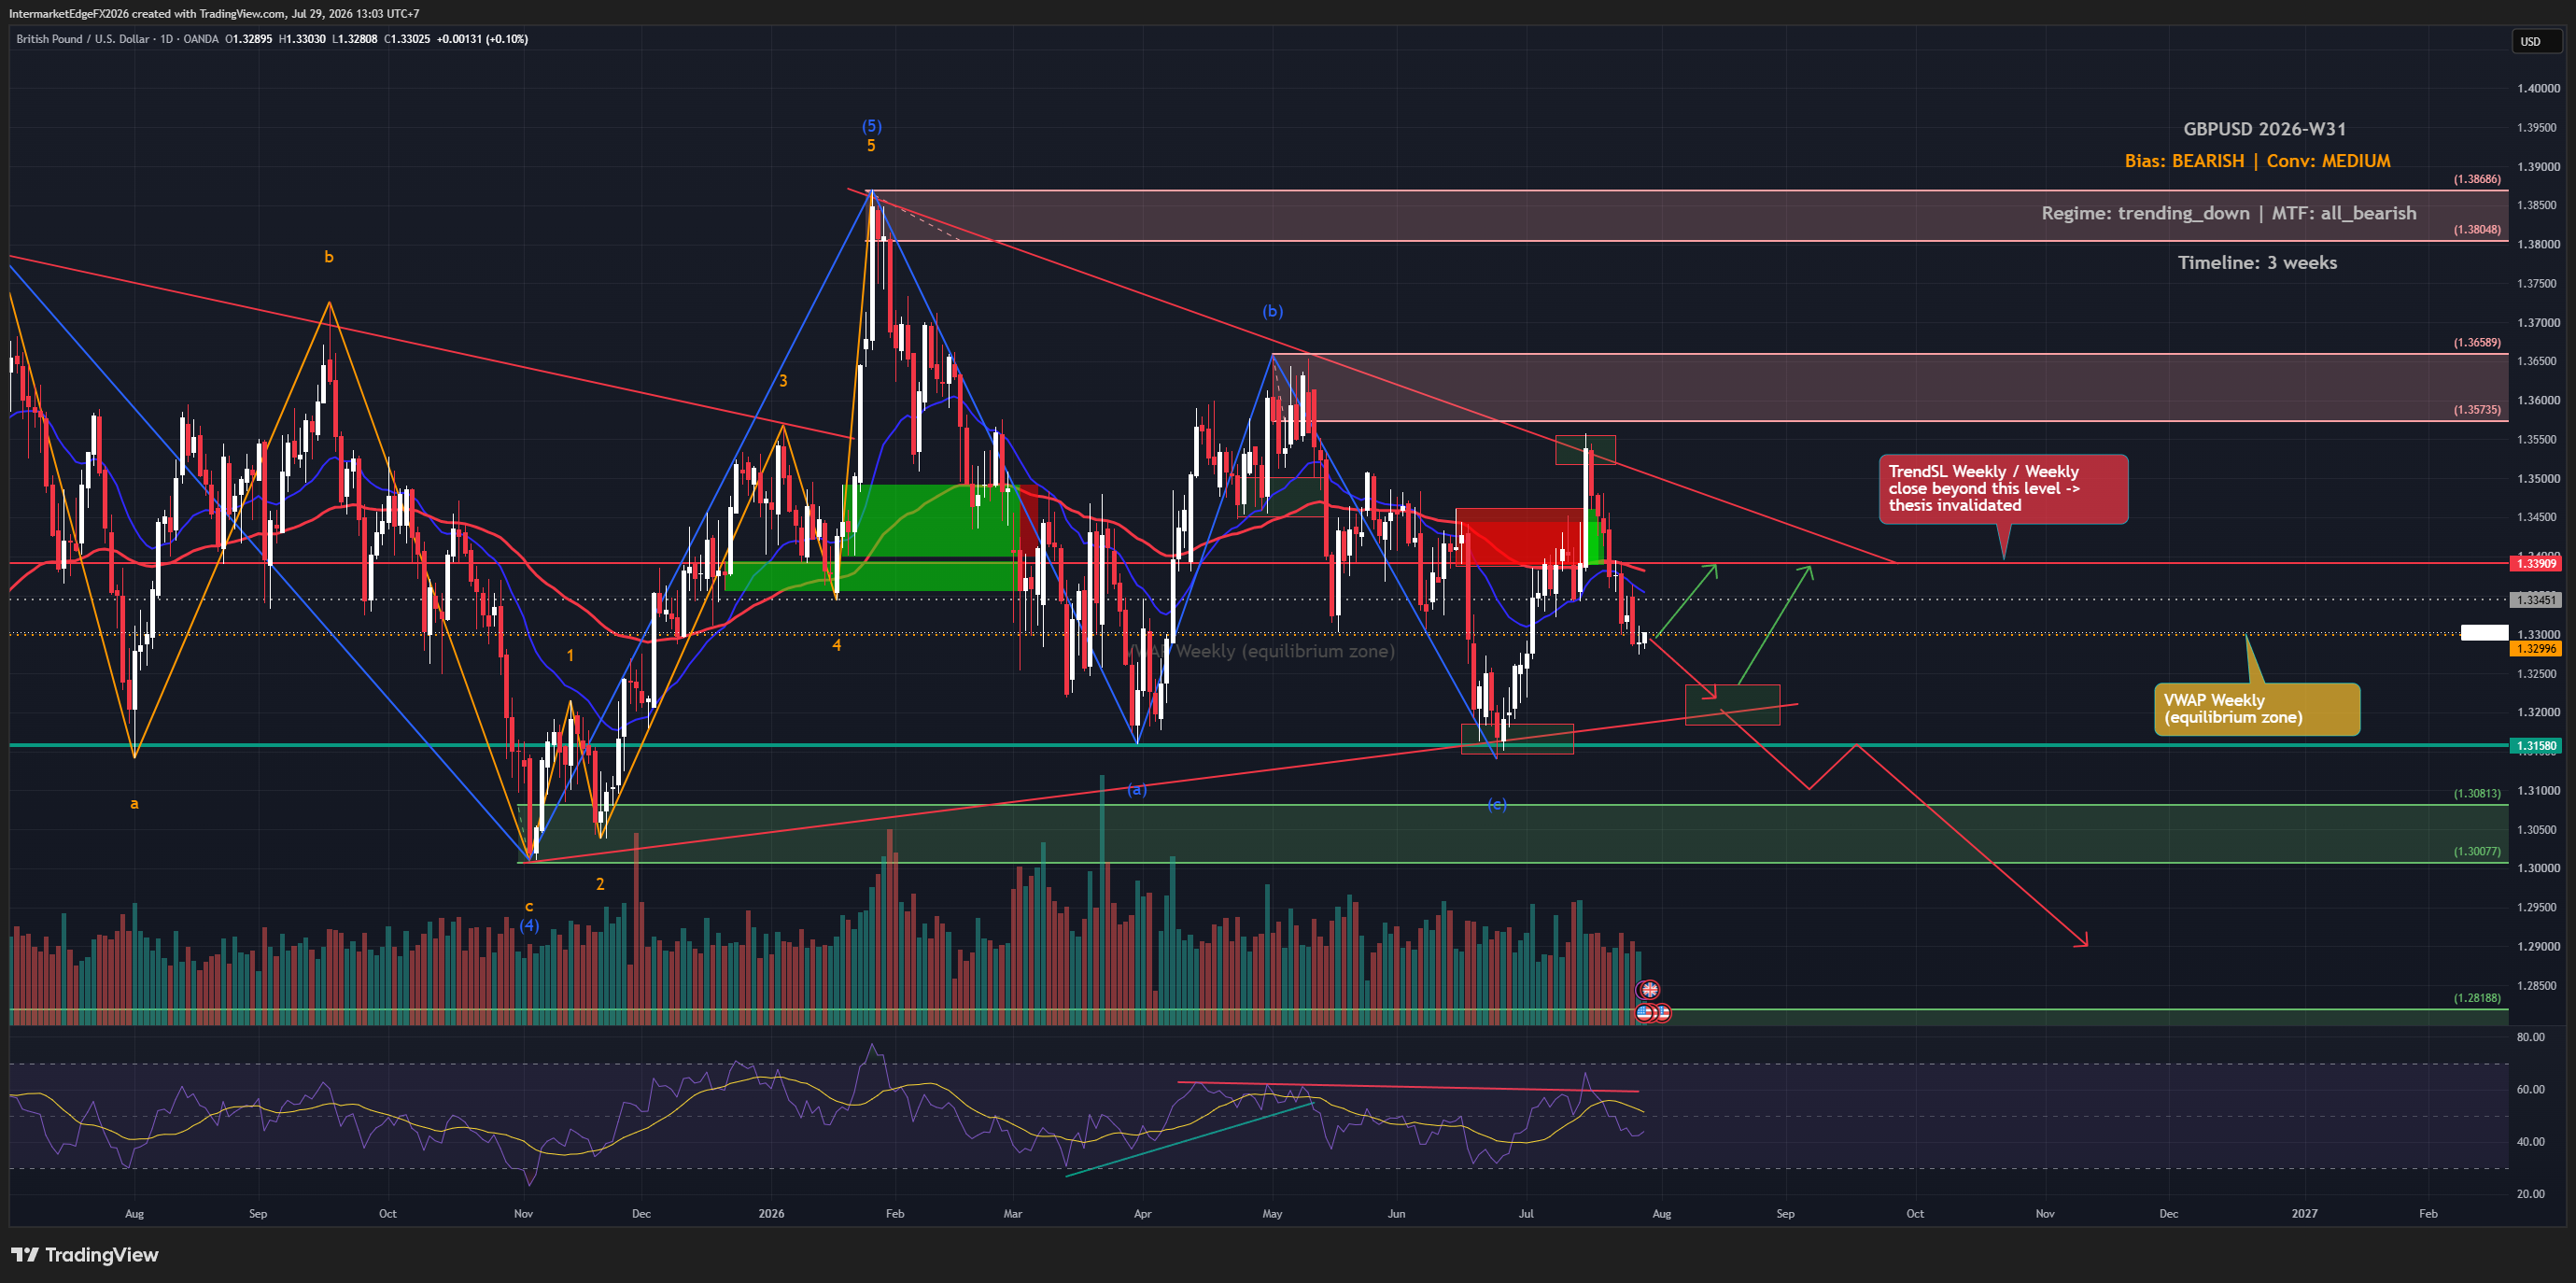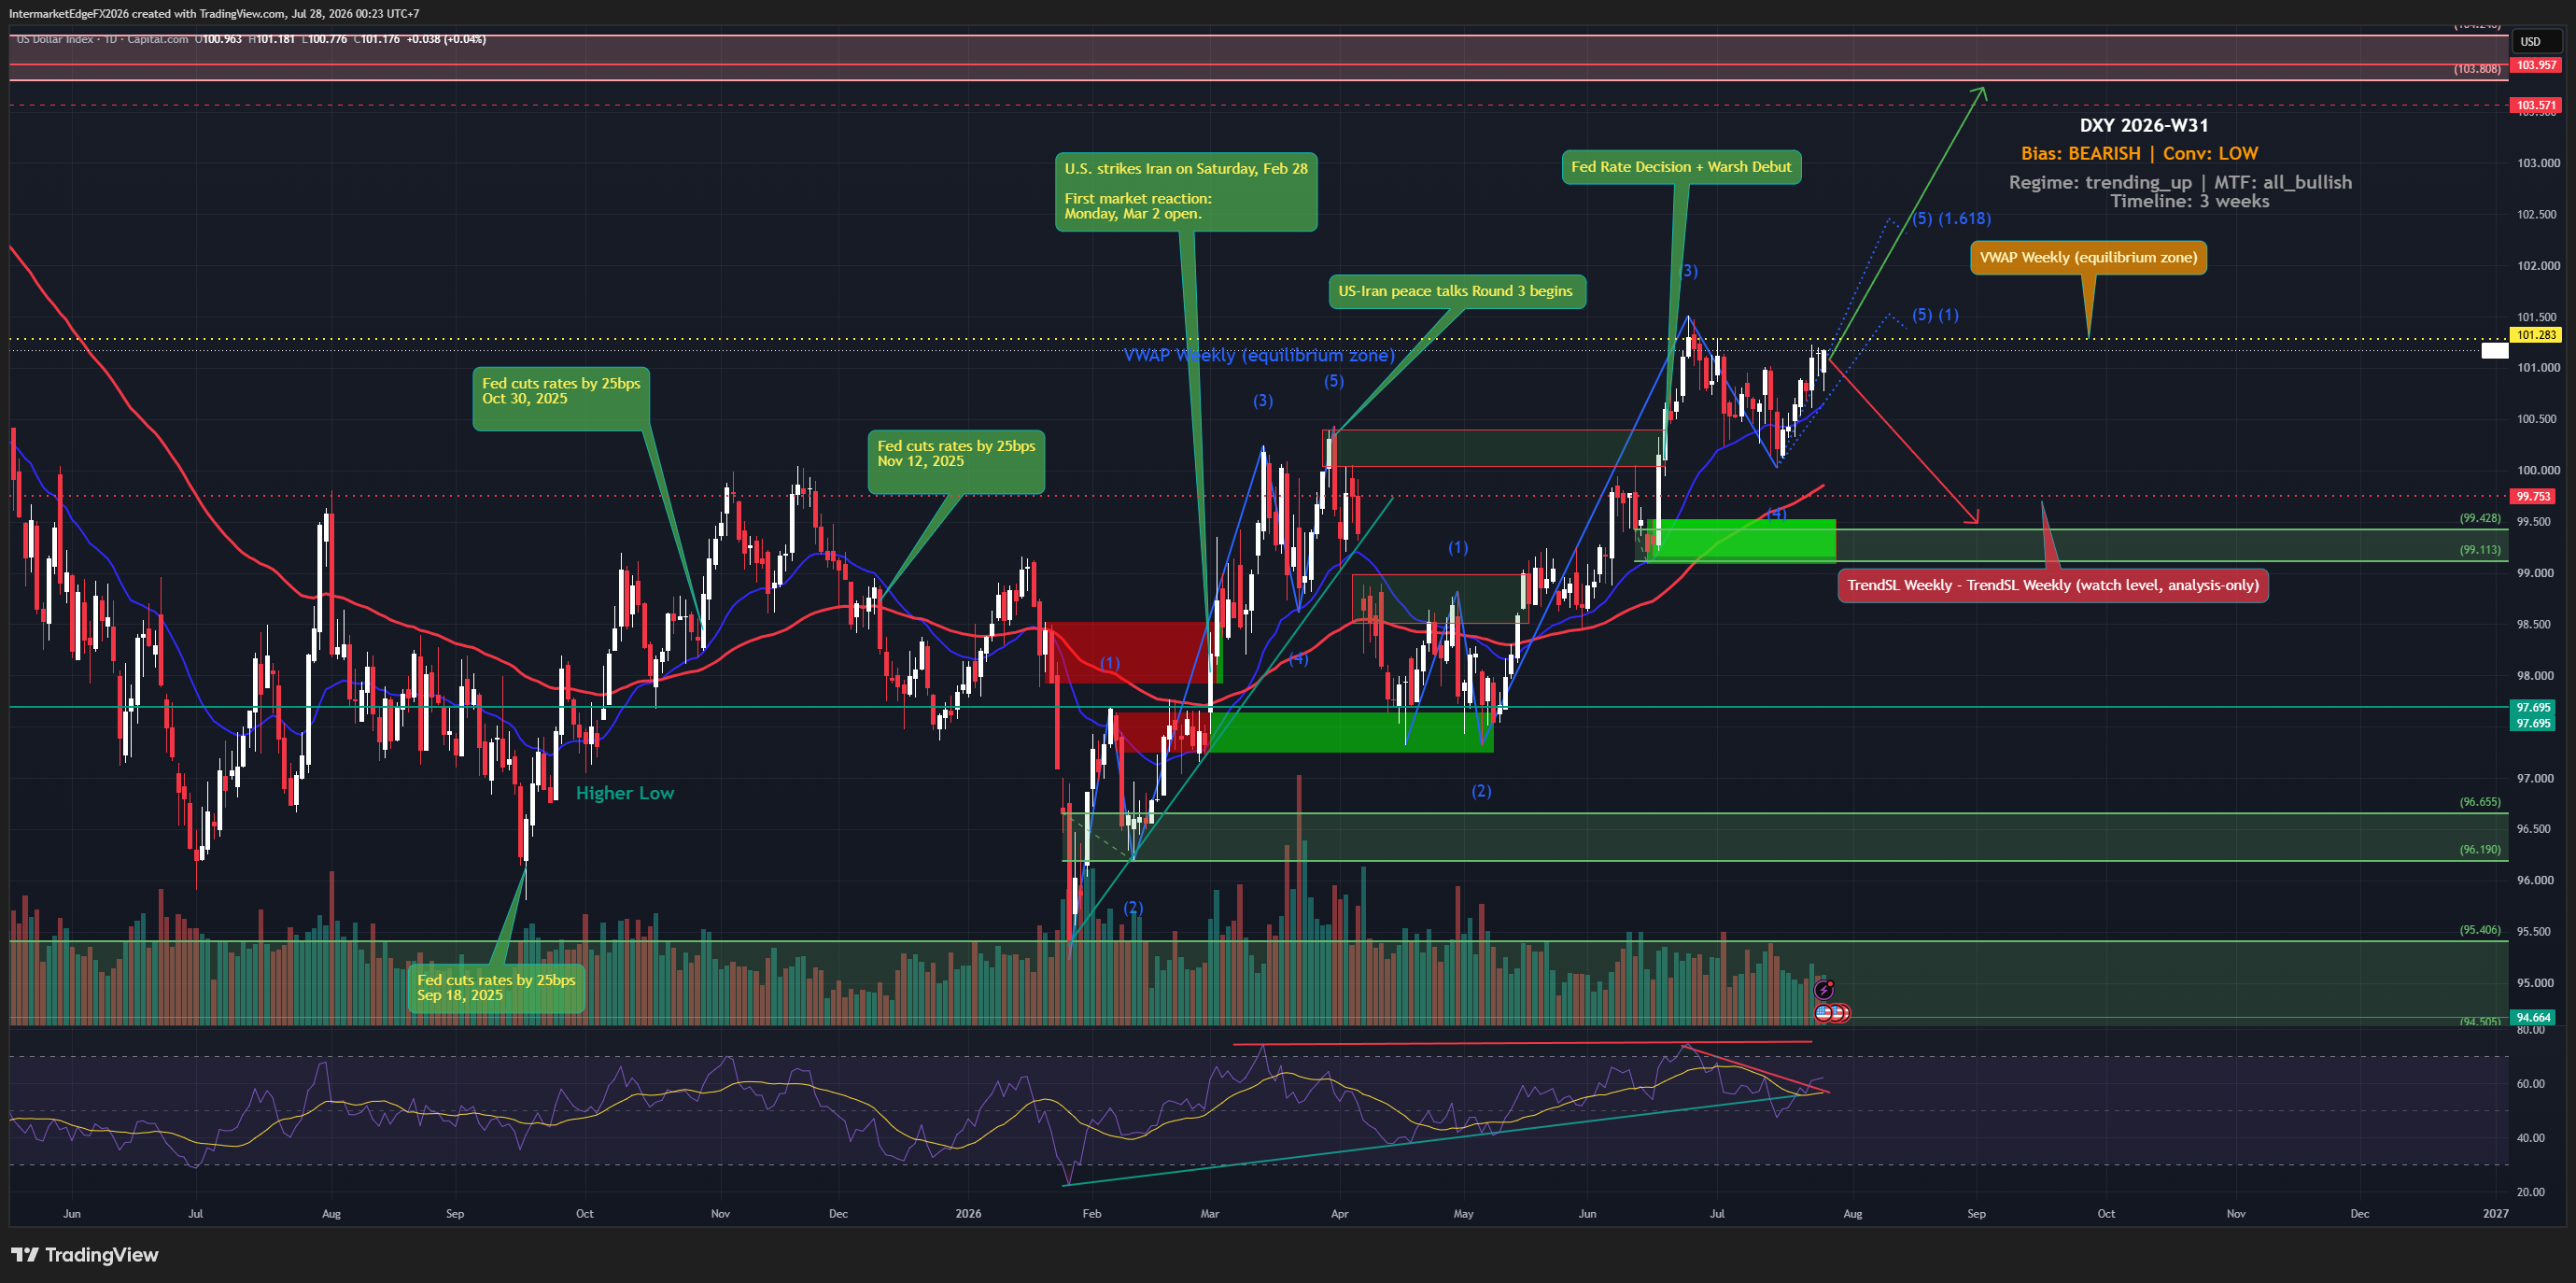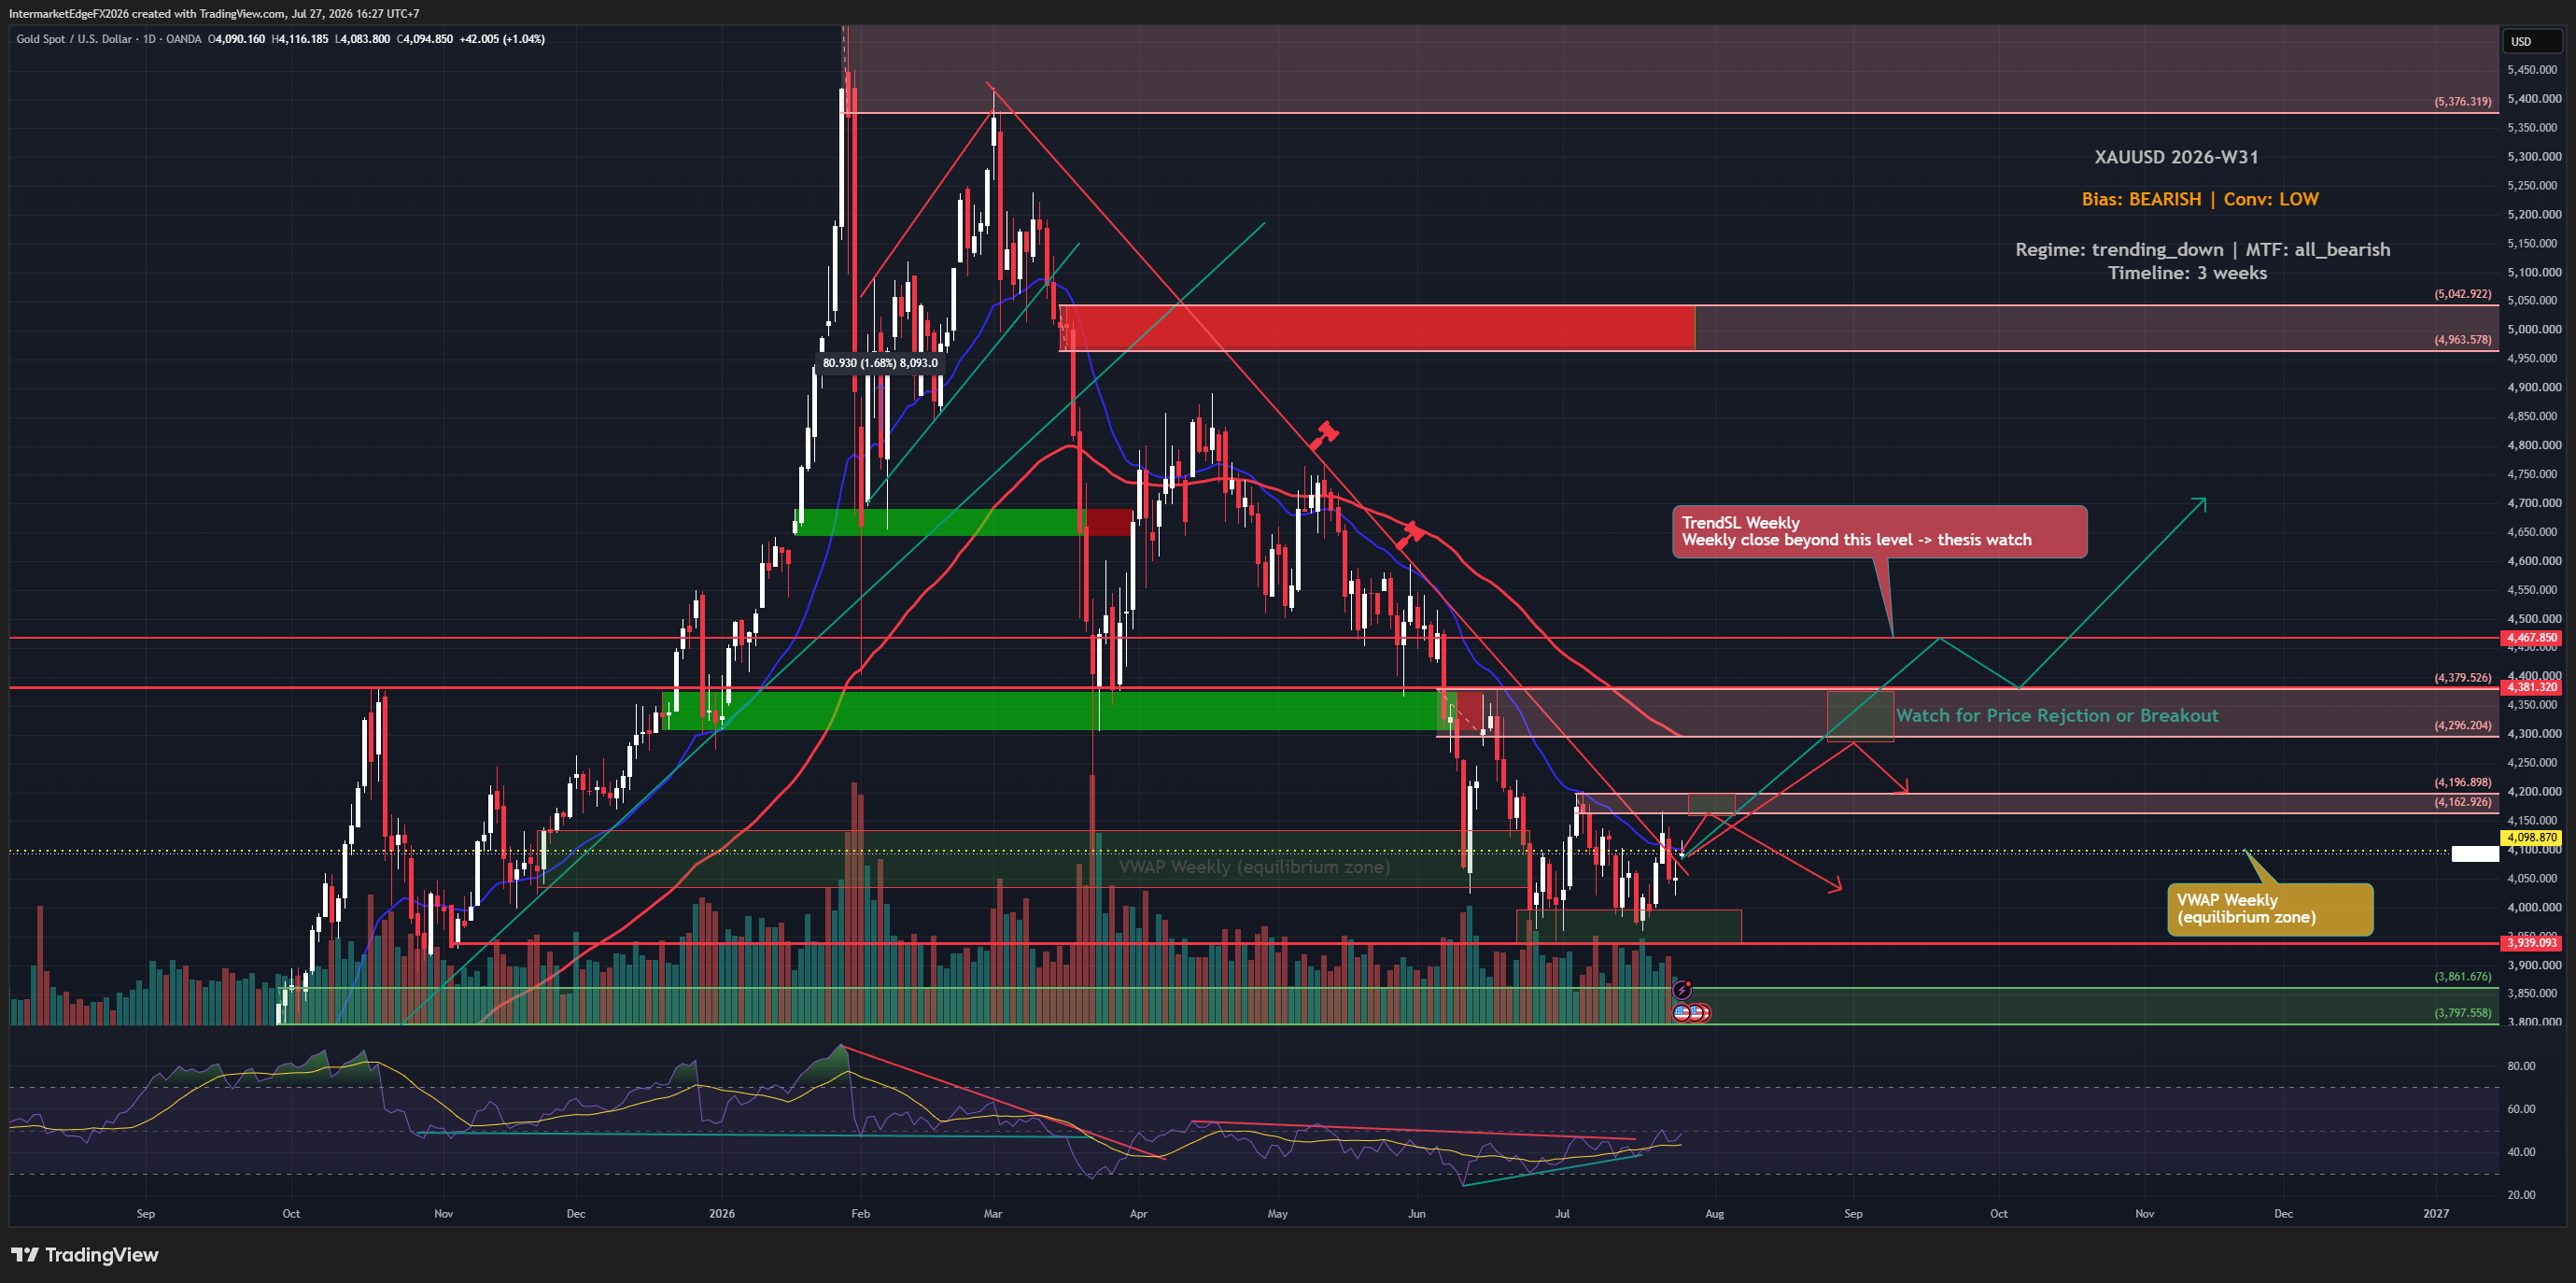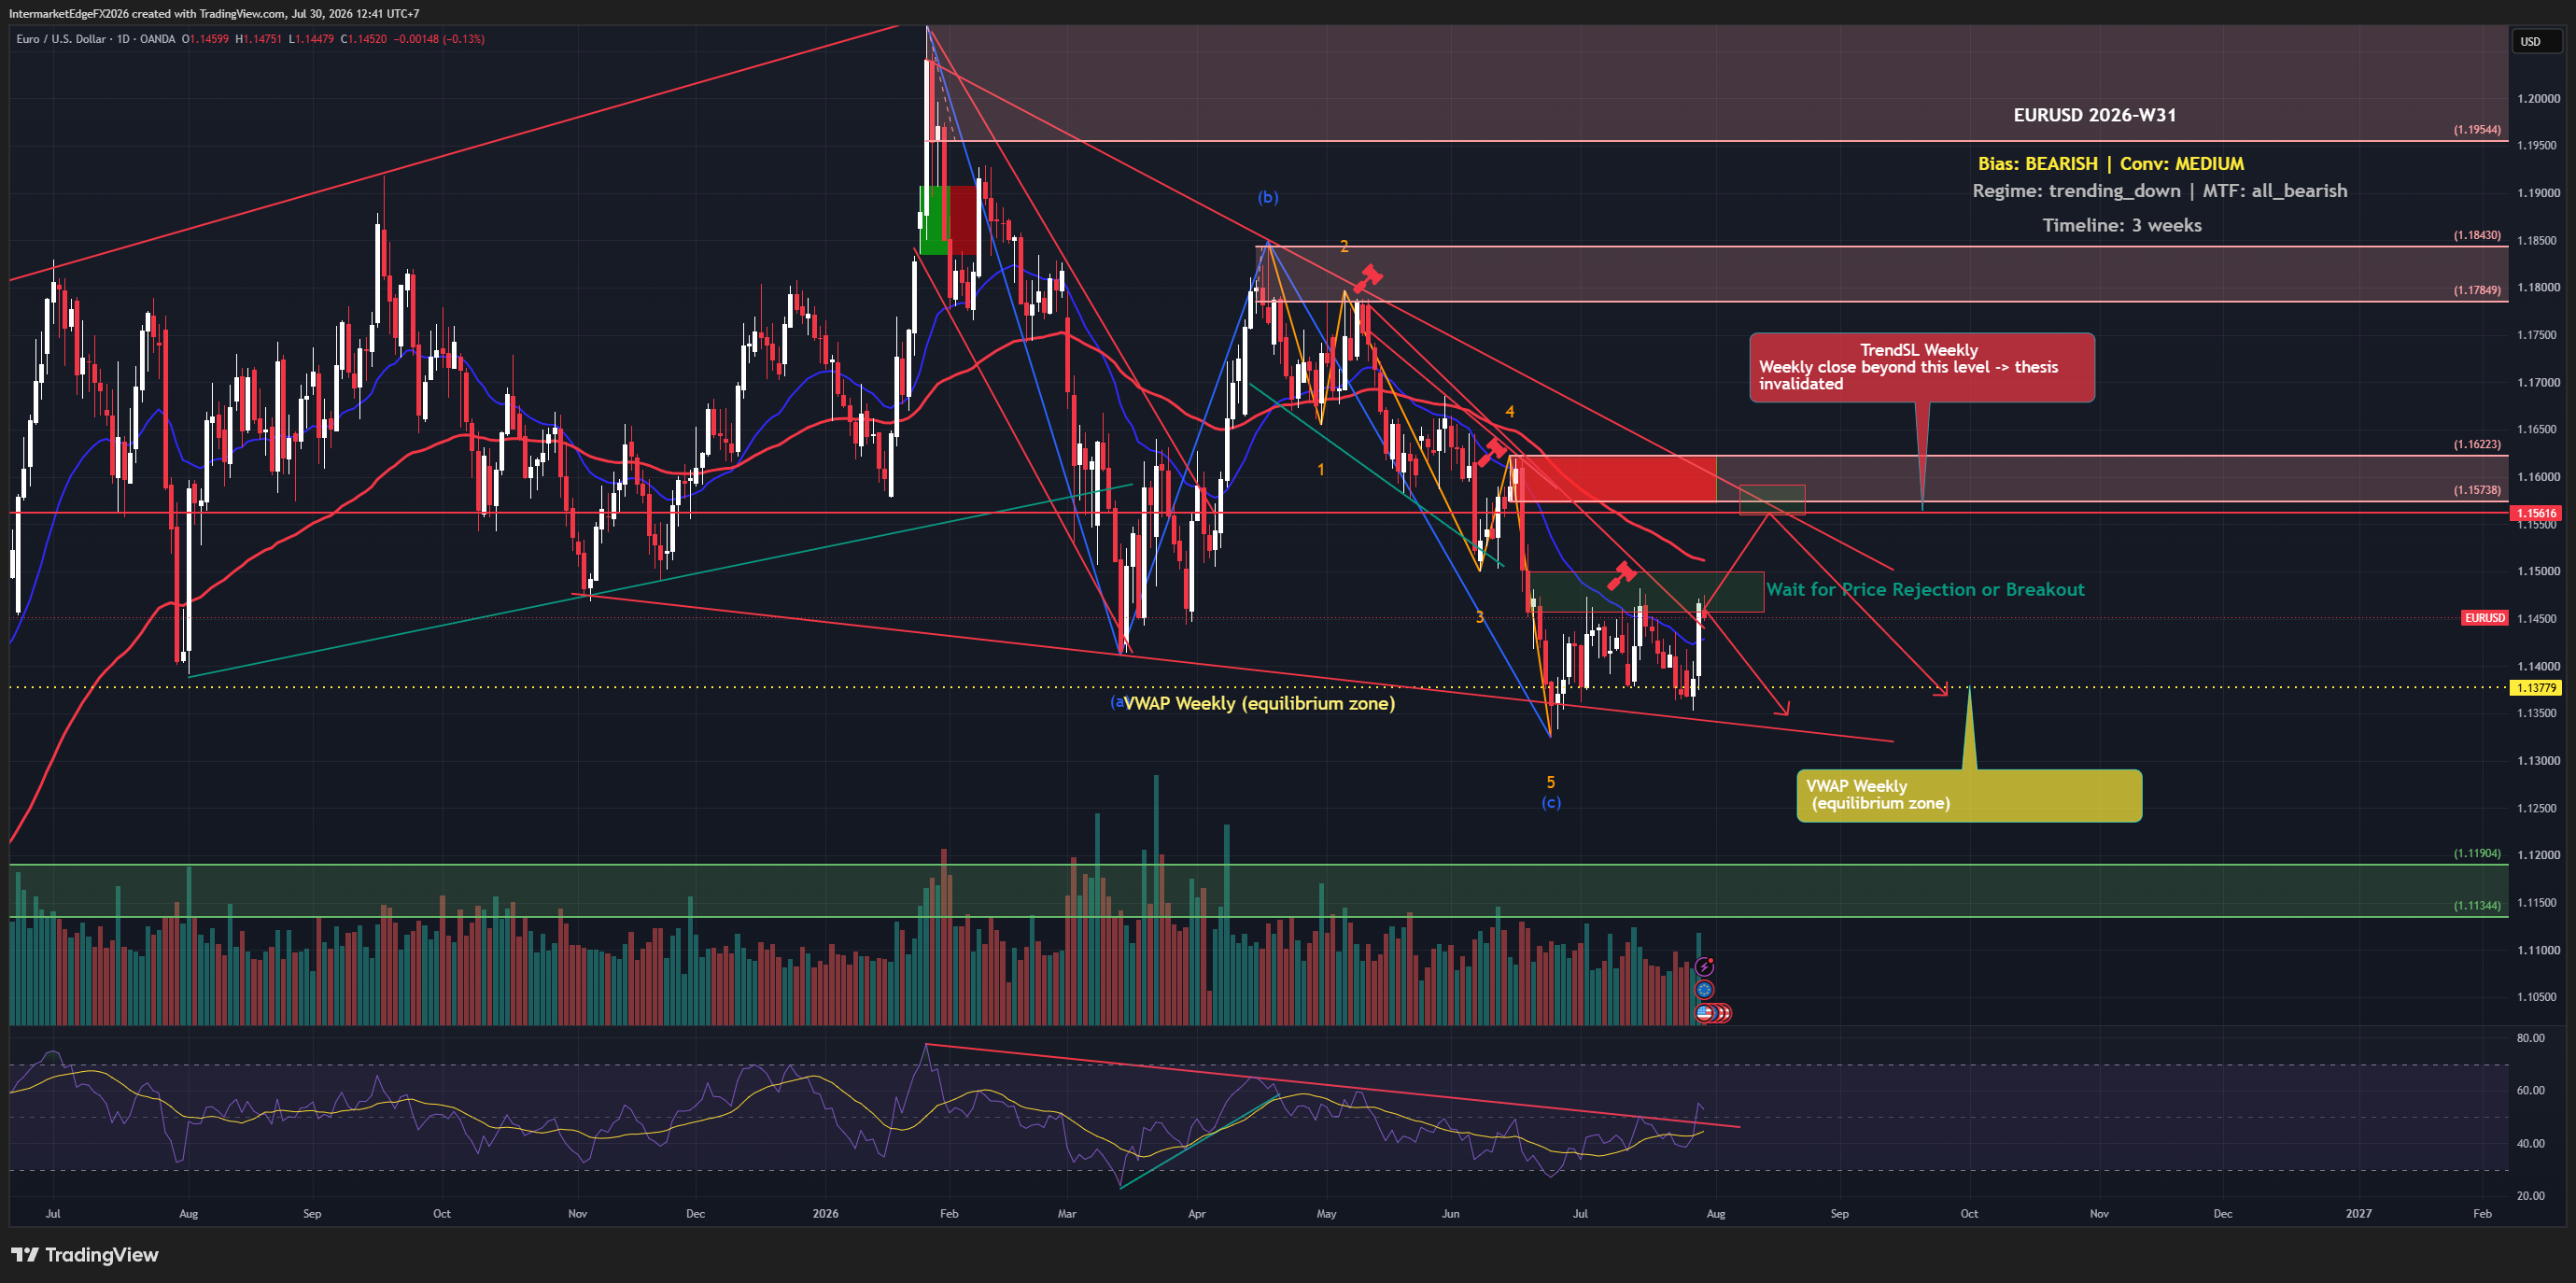
EURUSD Week W31-2026: Euro Climbs to Two-Week High as Fed Holds Rates Steady, Dollar Sinks and Bearish Thesis Faces Short-Term Counter-Trend Pressure
The Euro hit a two-week high this week as the Fed held rates steady and the dollar sank in the immediate aftermath, but don't mistake a short-term relief rally for a trend reversal. With US 10-year real yields running at 2.43% and the ECB-Fed rate differential still firmly favoring the dollar, the structural bearish case for EURUSD remains intact. The current bounce is trading against the macro grain, and that matters. The overall bias for EURUSD in W31-2026 is bearish with medium conviction, driven primarily by the ECB versus Fed rate differential that continues to favor USD strength across the medium-term horizon of roughly three weeks. The multi-timeframe technical alignment is fully bearish, every timeframe in the review is pointing in the same direction, which adds structural weight to the macro thesis even if short-term price action is temporarily running the other way. It is important to be explicit about the signal conflict present this week: both recent price action and COT positioning data are reading bullish, and the Euro is indeed trading above the weekly VWAP of 1.13779 as of Thursday, 30 July 2026 at 05:32 UTC. That is not a minor footnote, price at 1.14574 is already running against the thesis snapshot close, and that gap of roughly 80 pips is real counter-trend pressure that deserves respect. The COT signal showing net bullish positioning should also be noted, though the brief does not specify the exact report week, release date, or net contract figure, so it should be read as directional evidence rather than a precise citable statistic. The bearish thesis this week rests entirely on macro and causal-chain logic: Fed hawkishness feeds USD bullish pressure, which feeds EURUSD bearish pressure, with DXY directional weight being the strongest single input into the pair. -- Intermarket Edge