Tag: Commodity — InterMarketEdge

Tag: Commodity

USOIL | May 21, 2026 The Oil Market's Most Important Week - What the $5 Swing Tells You About Hormuz

USOIL | May 21, 2026 The Oil Market's Most Important Week - What the $5 Swing Tells You About Hormuz

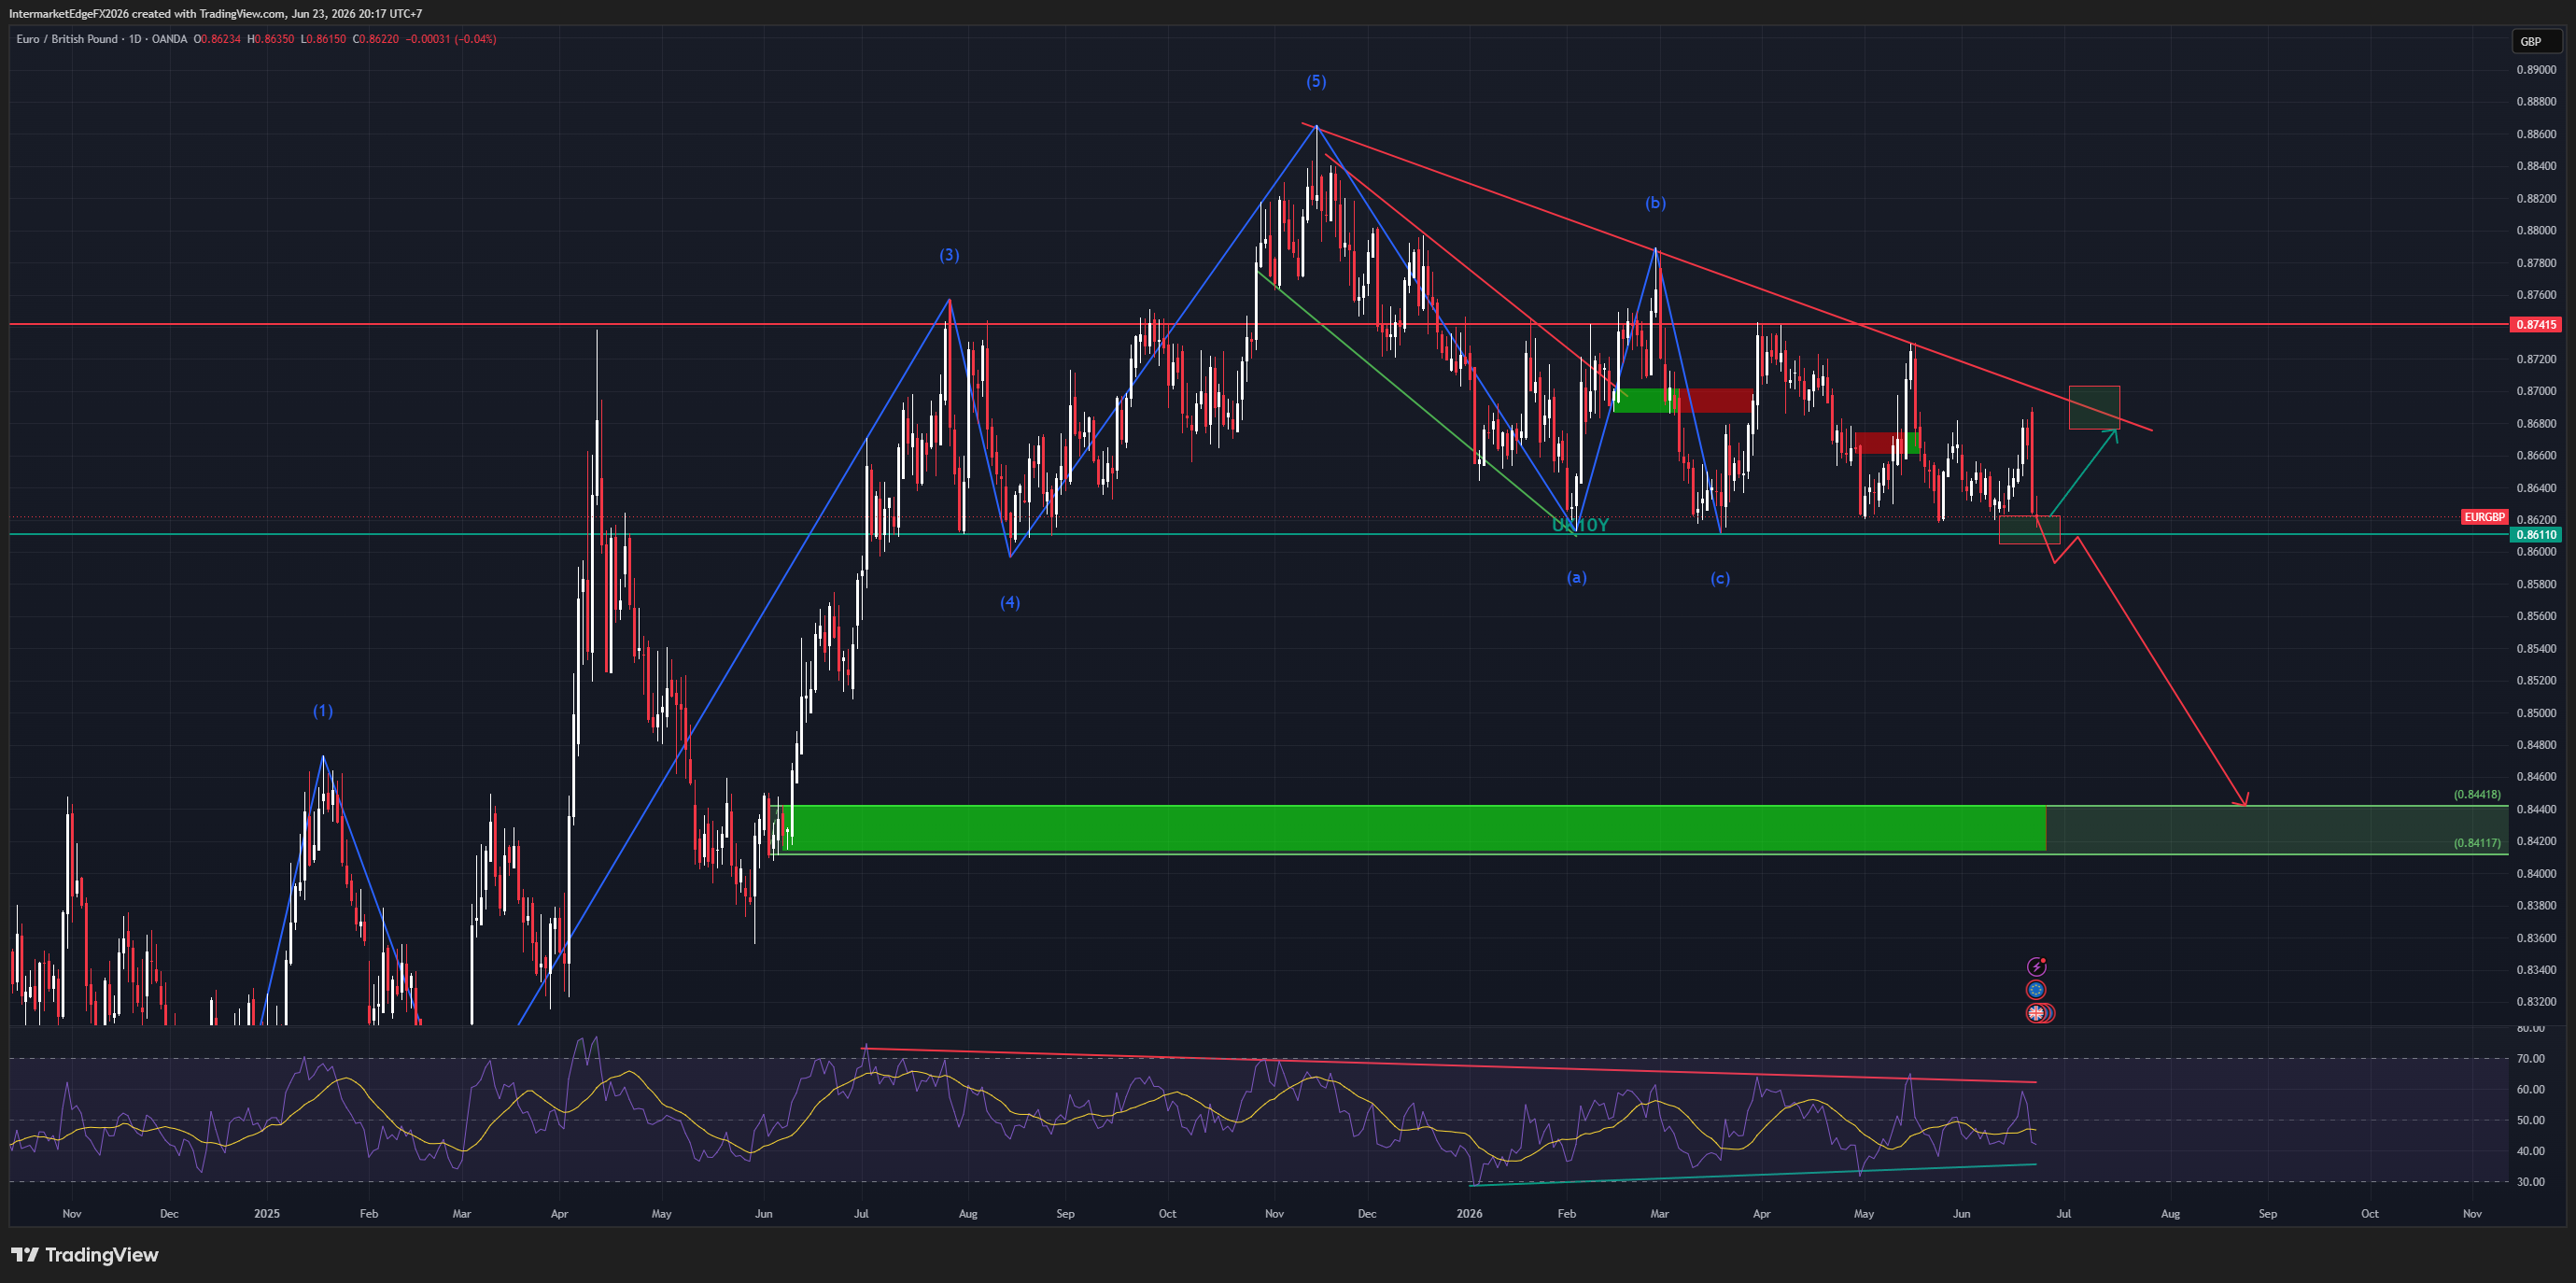
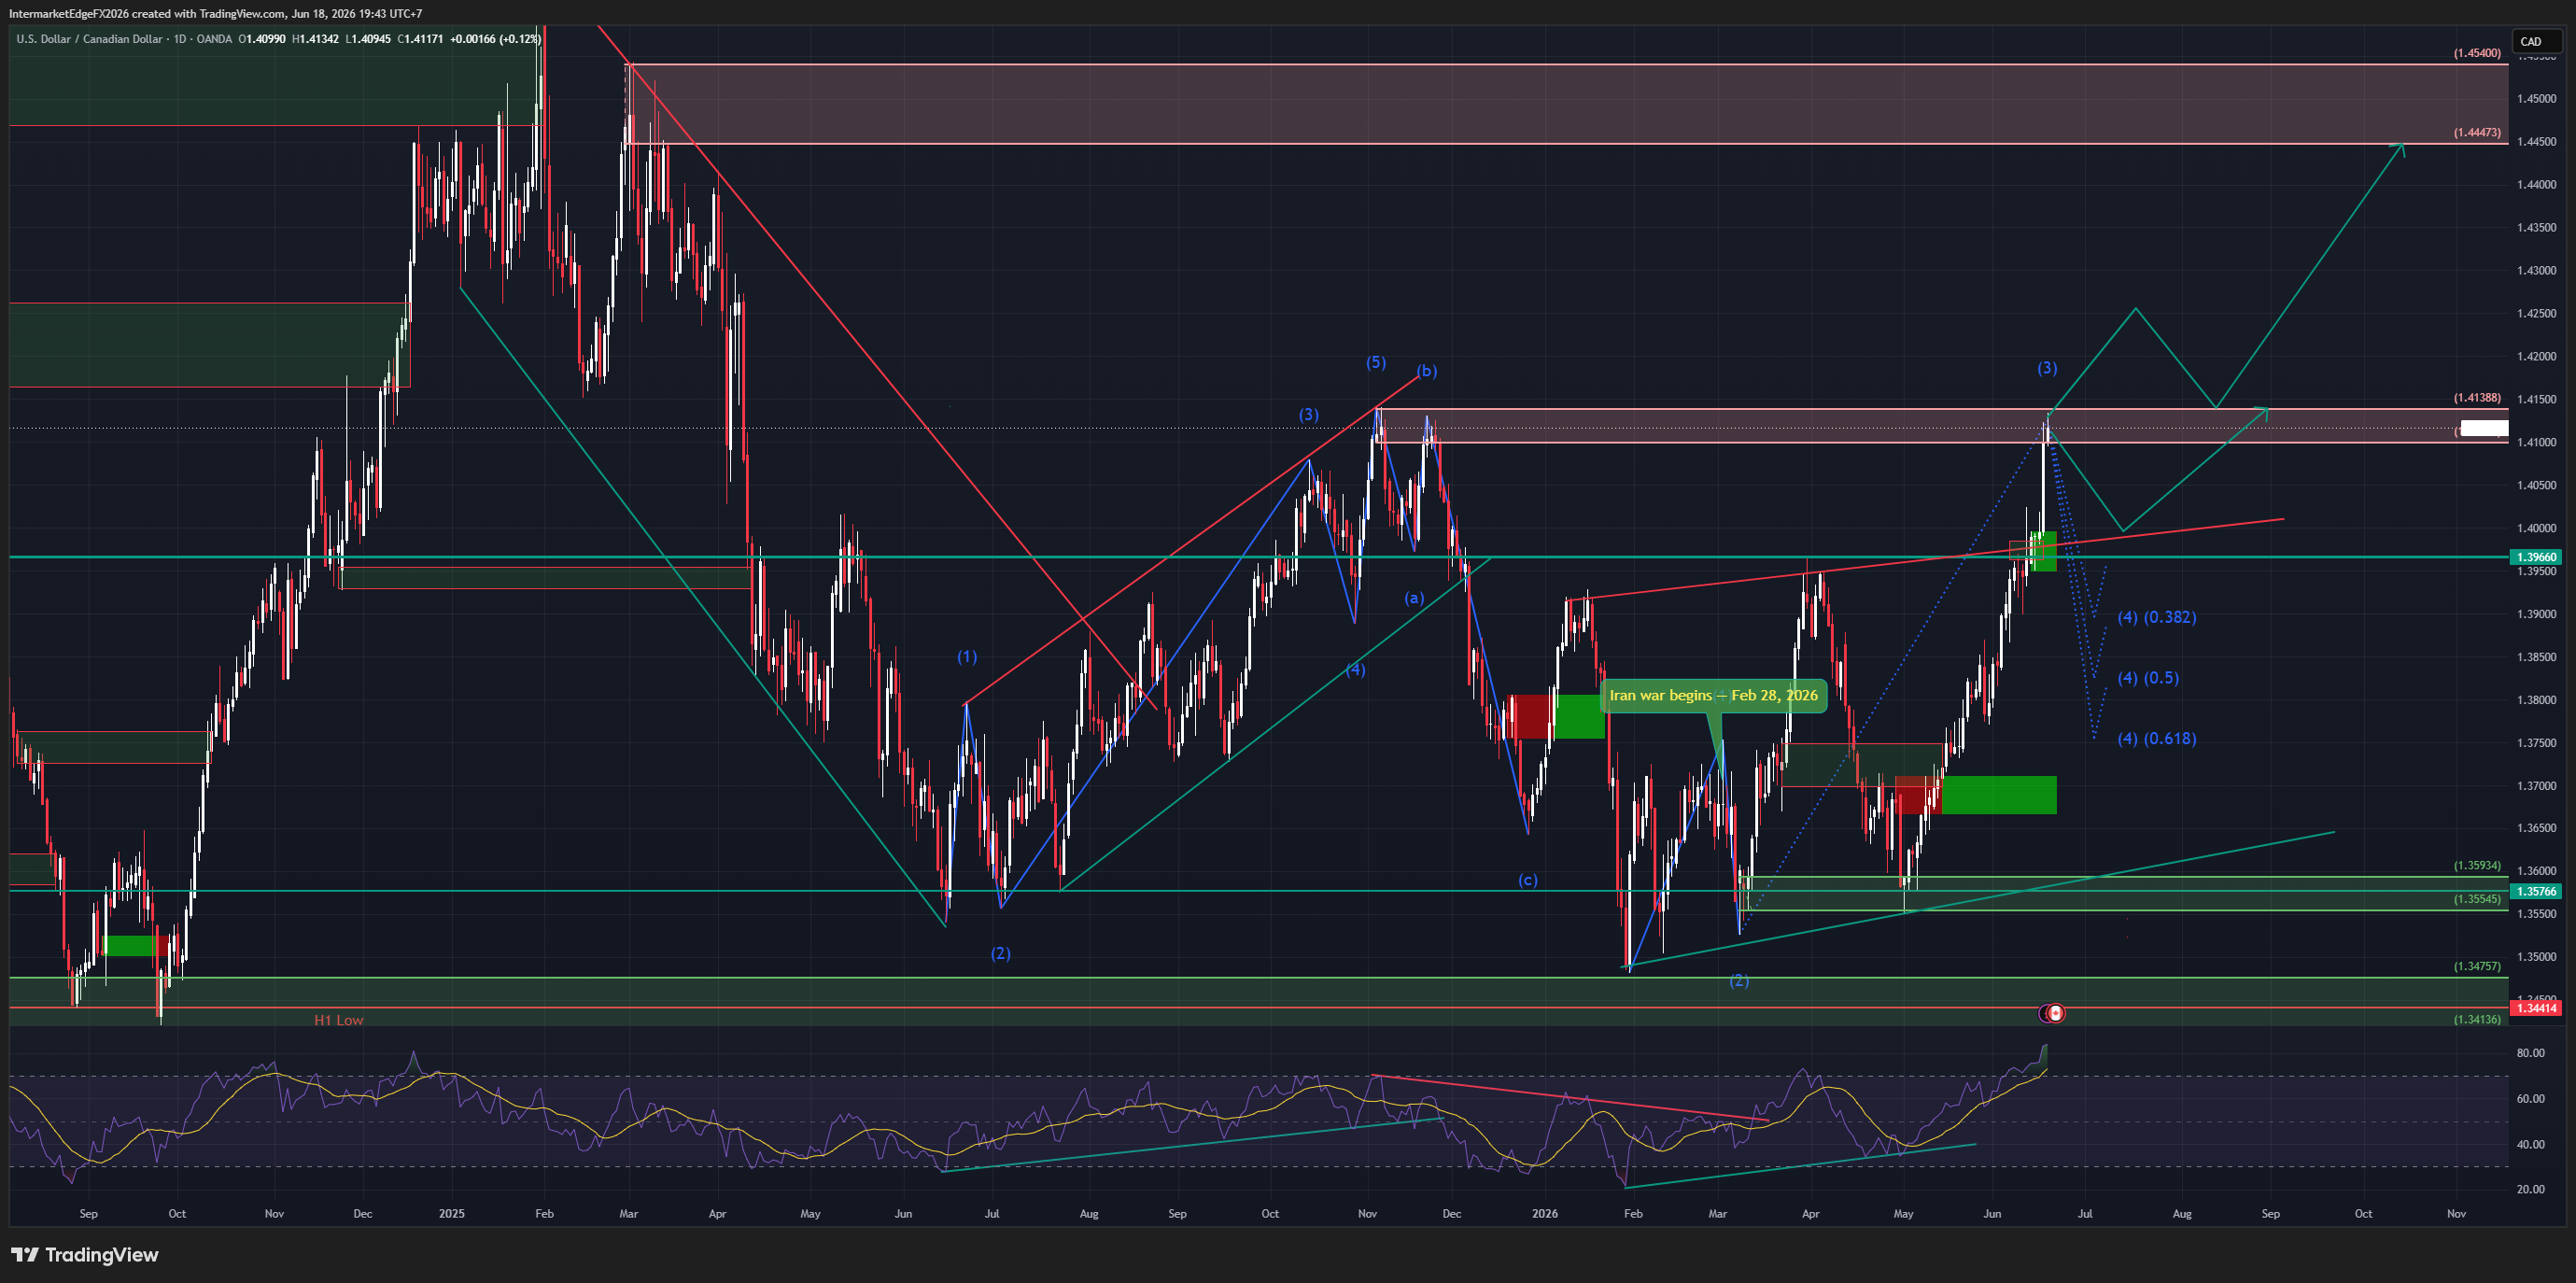
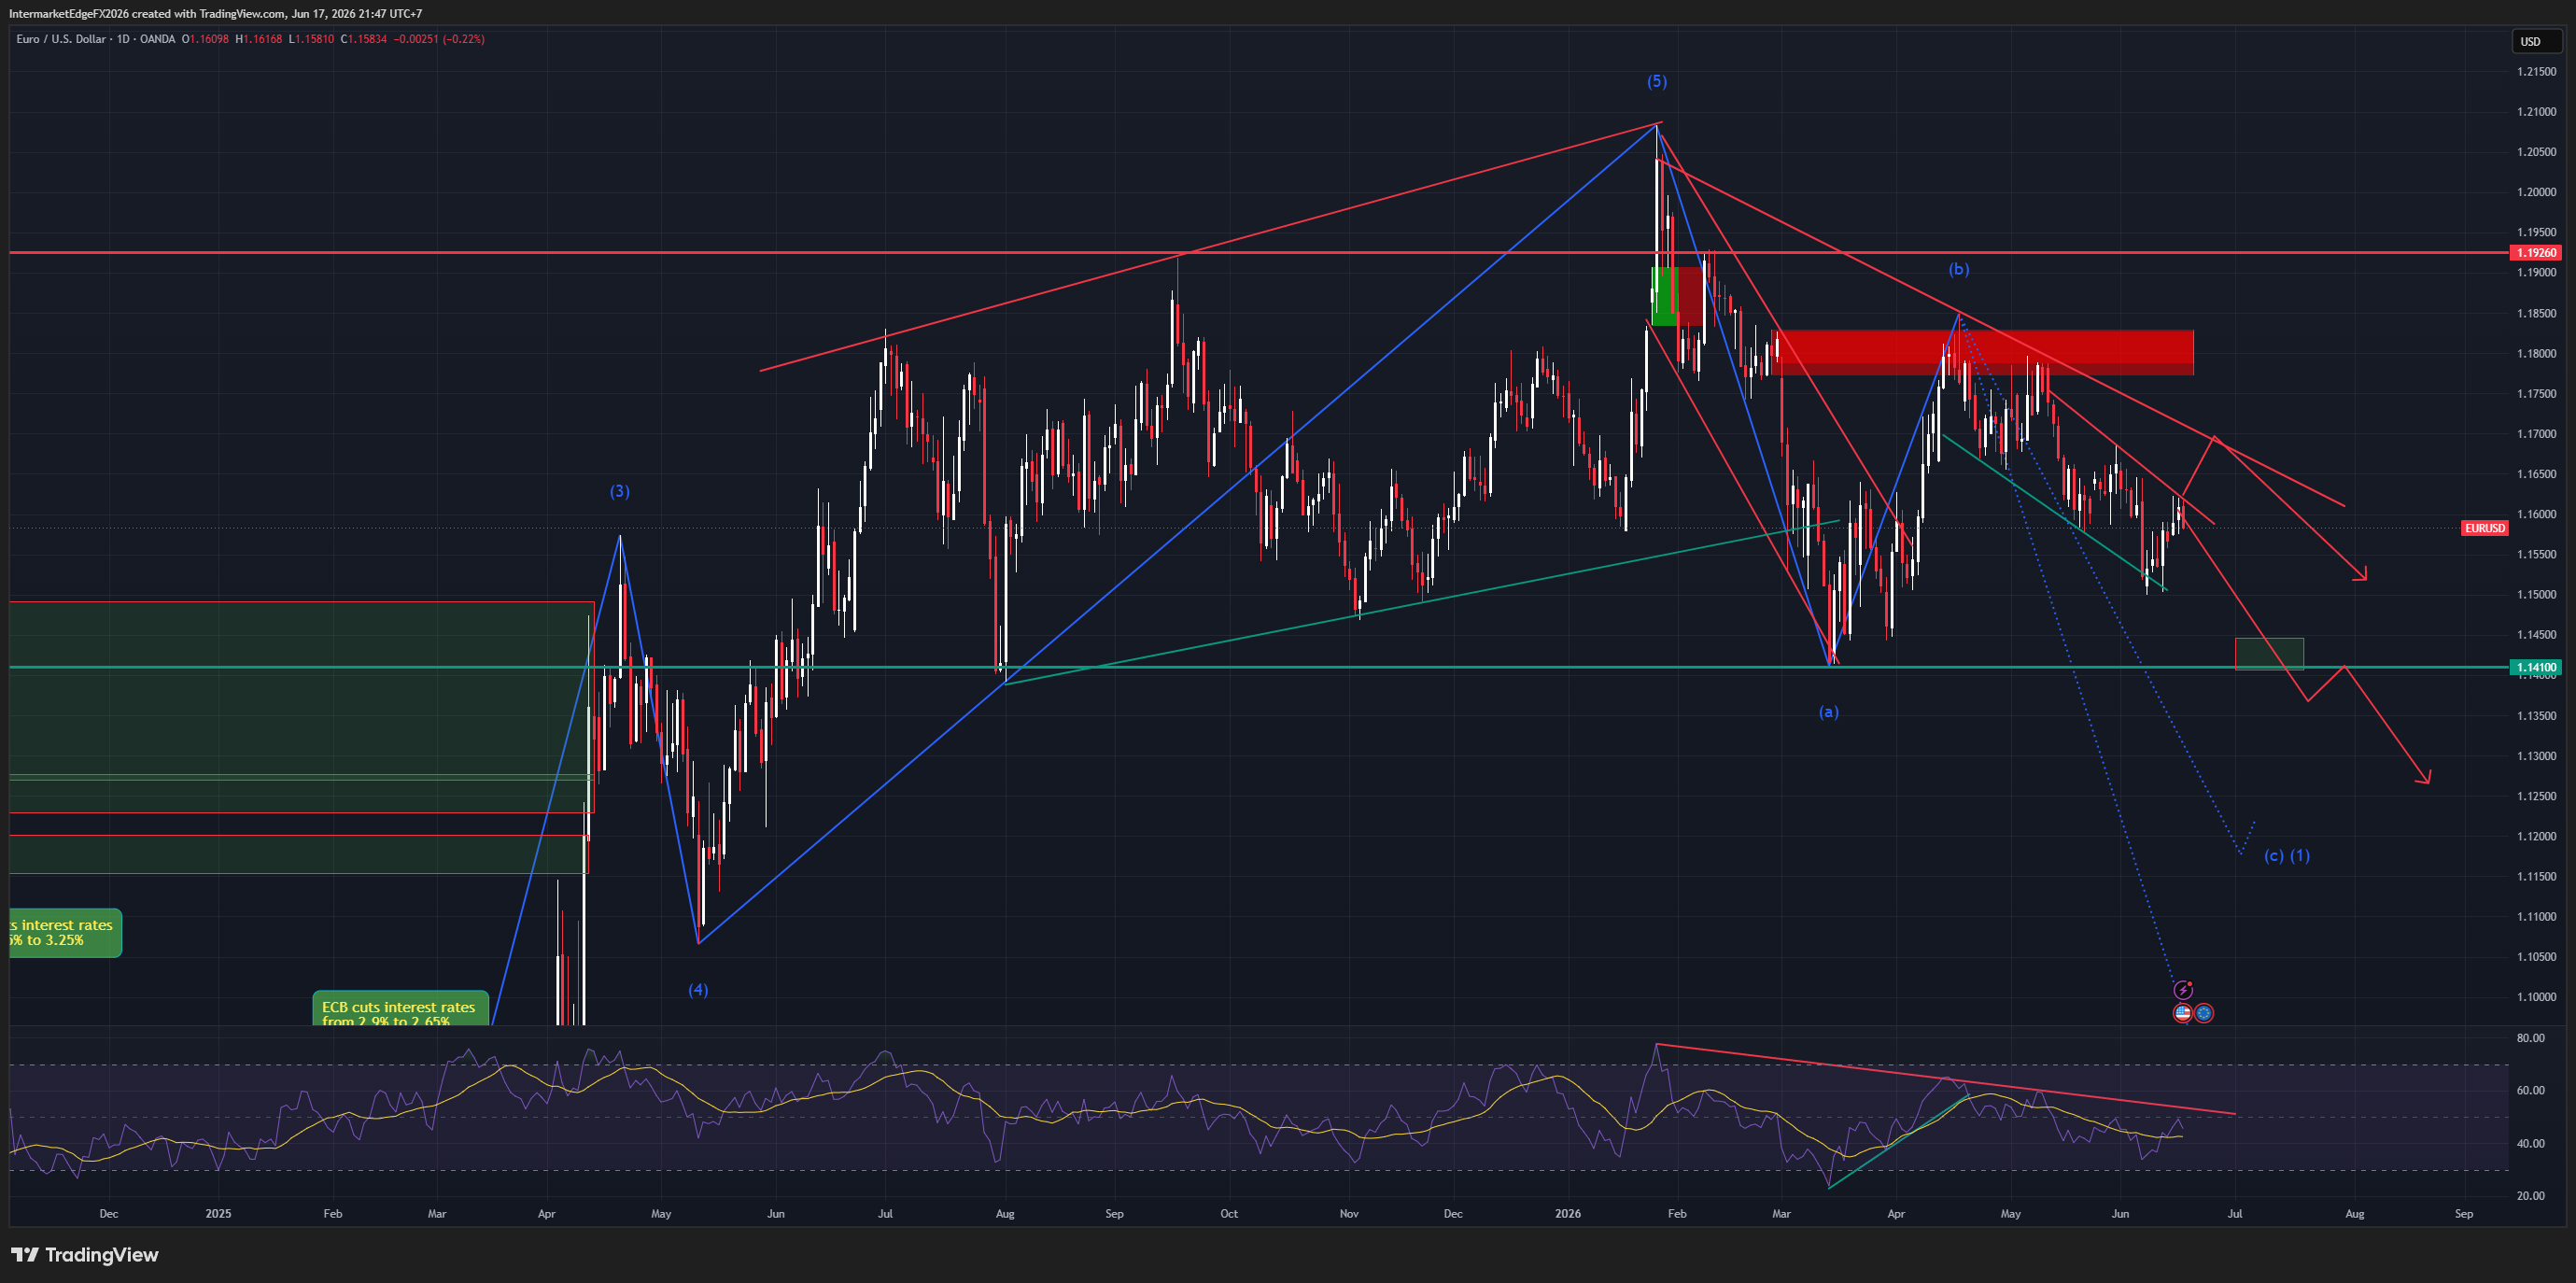
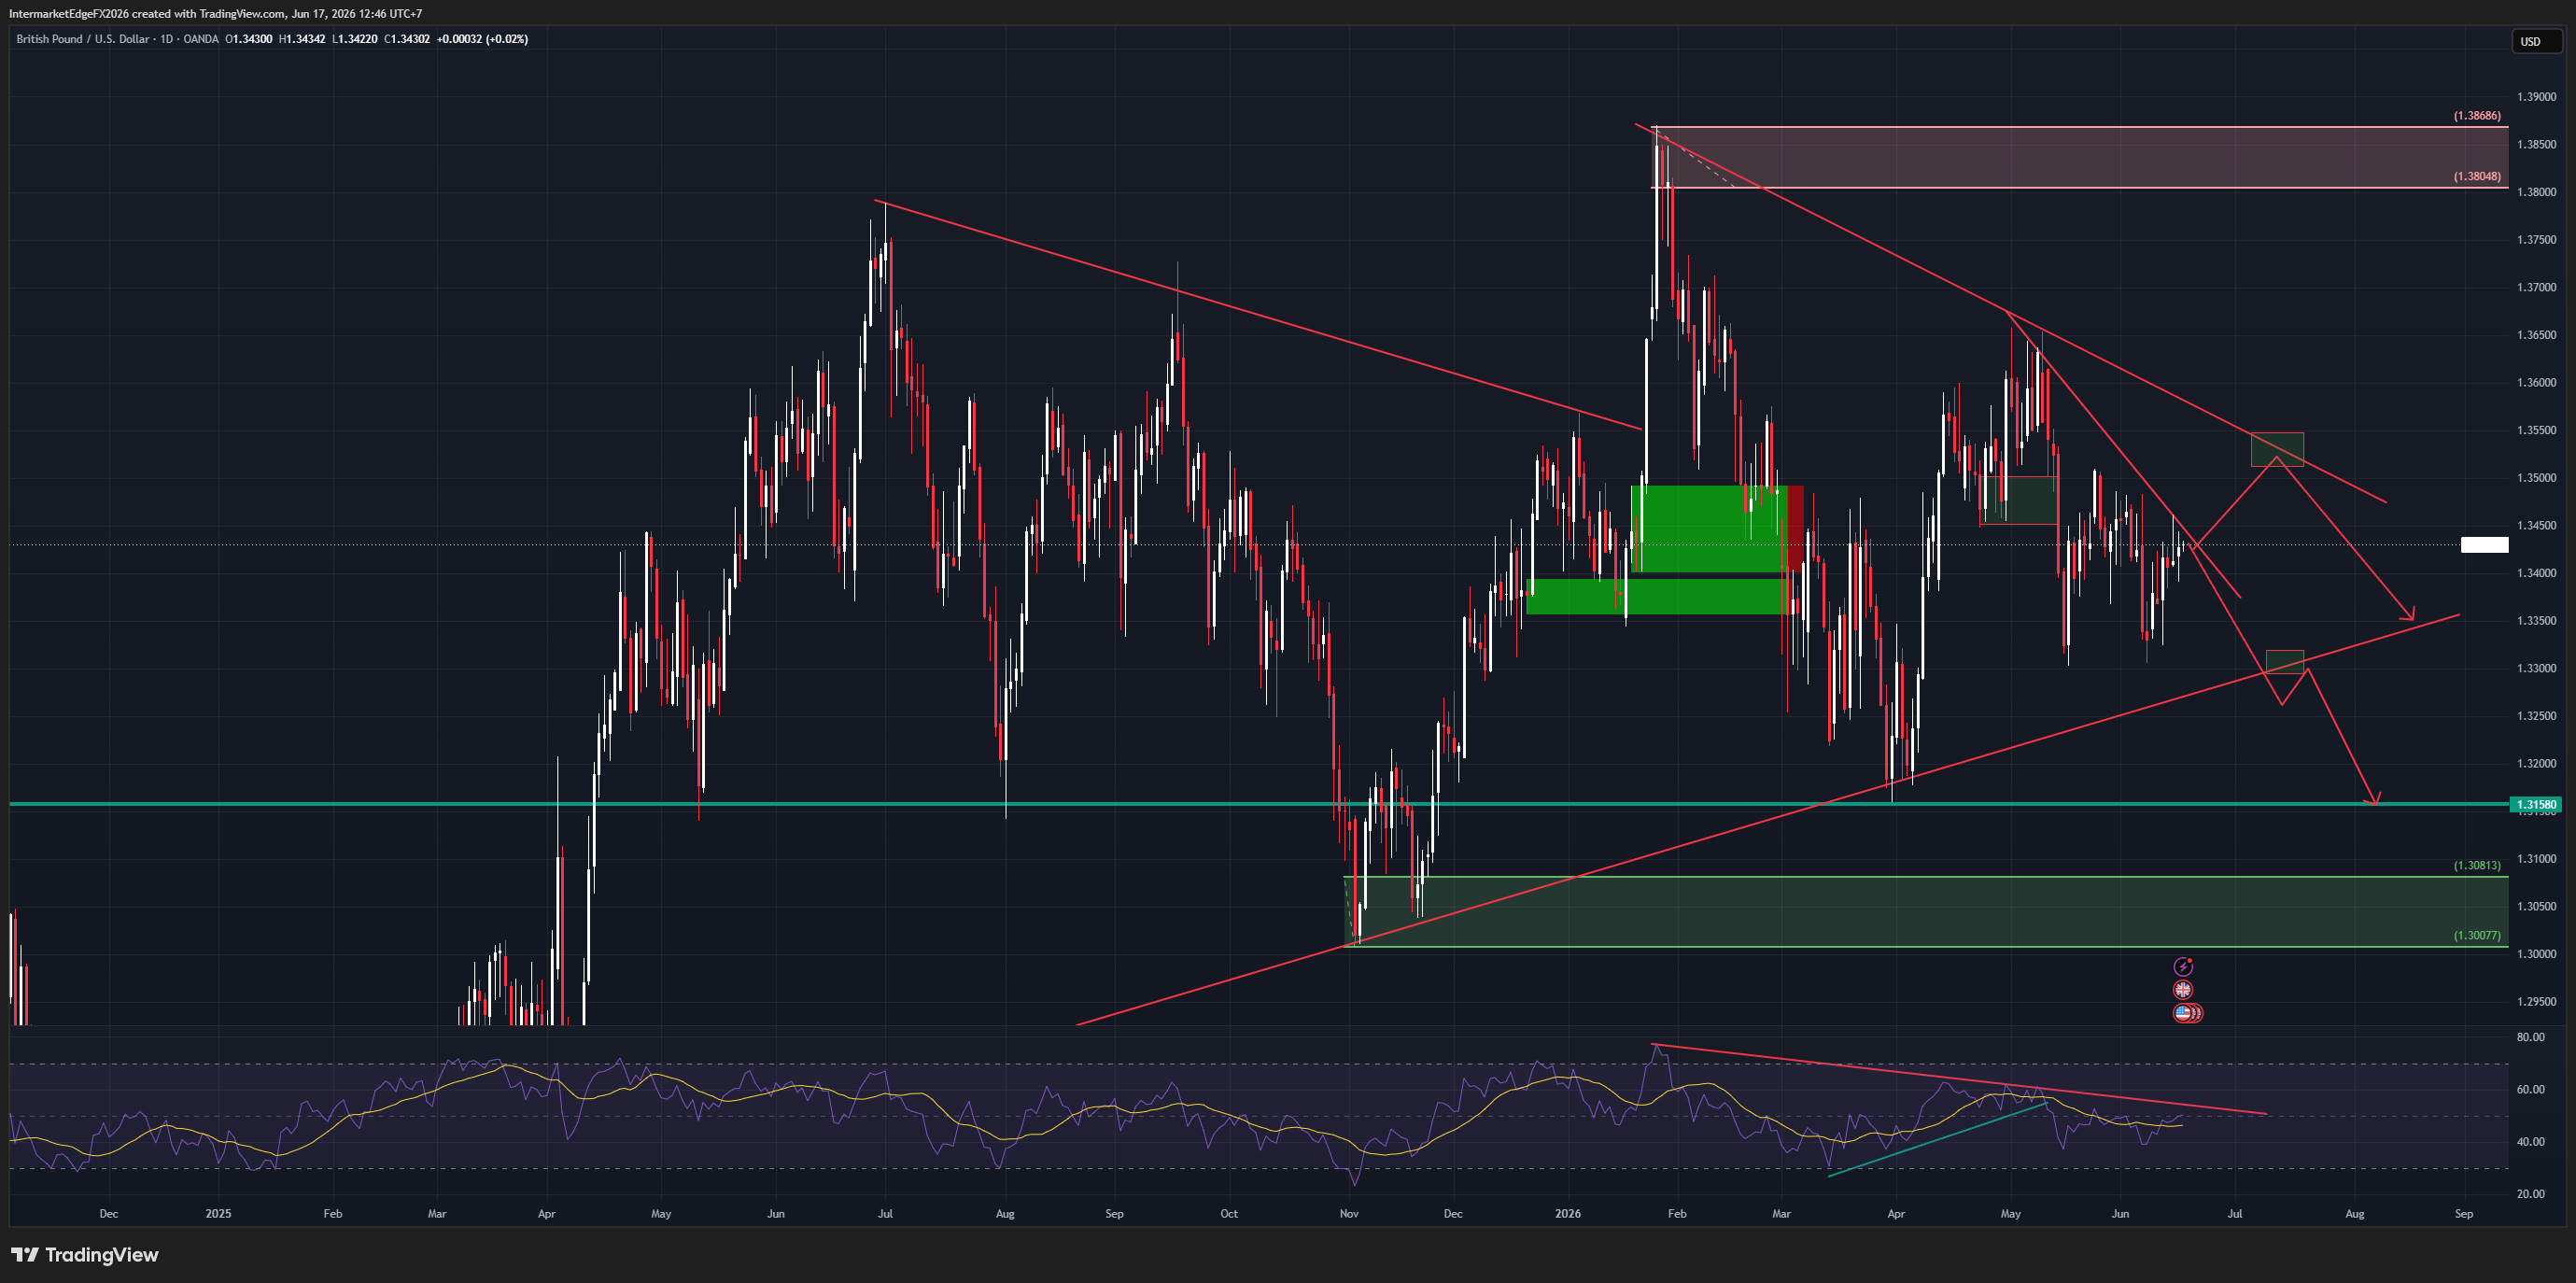
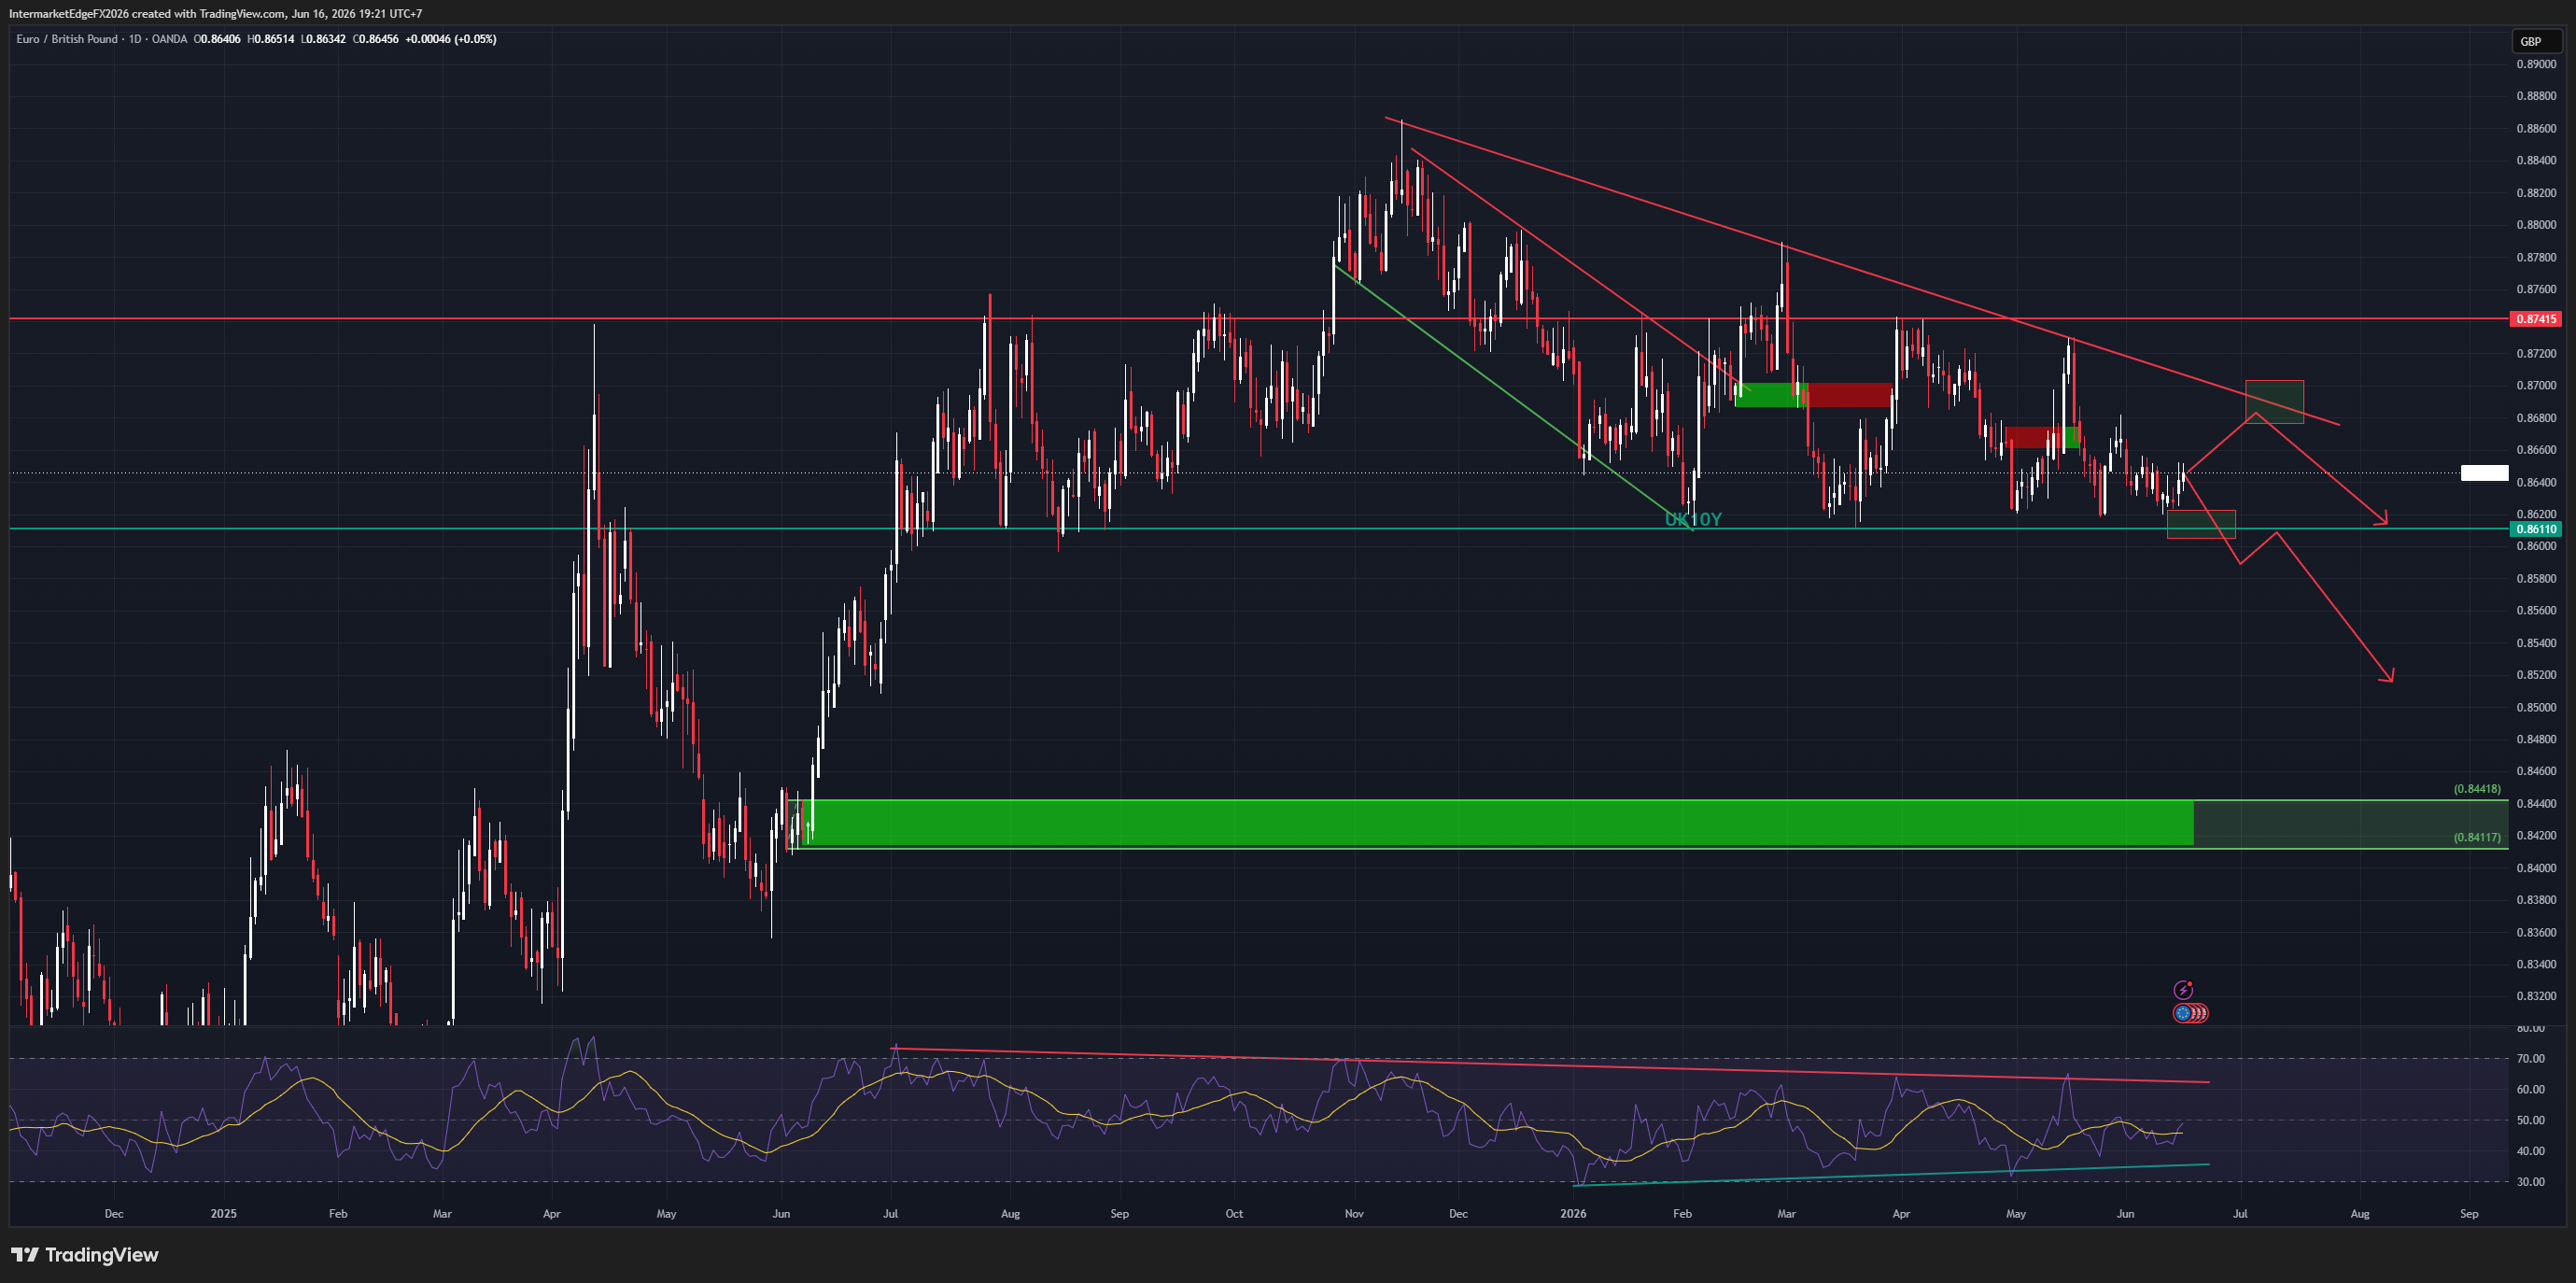
**USOIL | May 21, 2026** WTI at $101.13. Brent at $107.40. This is the instrument that drove every other analysis published this week. The Brent sequence from May 18 to May 21 is the story of the week in a single column of numbers. From $111.27 on Monday to $106.09 Thursday morning, then bouncing to $107.40 by evening. A $5 decline and partial recovery across four trading days - not noise, but the market pricing and partially repricing Hormuz reopening probability in real time. The structural picture is unambiguous. This is still the largest oil supply shock in market history by some measures. Hormuz remains largely restricted. Three supertankers transited the Strait on Wednesday - in a market accustomed to hundreds per week. That is not normalization. US crude inventories fell for a fourth consecutive week, confirming demand is holding and the supply shortage is genuine. OPEC+ adding +411kbpd from June is a gesture in a market facing a daily shortfall estimated at 14+ million barrels. But the Iran deal probability introduces a binary outcome that overrides the structural argument in the short term. A deal confirmed sends WTI toward $74-82 as the war premium exits - gradually, not instantly, because physical infrastructure takes months to normalize. A deal collapse sends WTI back toward $109-115. Wednesday's EIA data is the supporting variable. The Iran headline is the primary driver. The intermarket confirmation is clear. Gold at $4,515 recovered alongside oil today. EURUSD held above 1.15. USDJPY stayed below 160. Every currency pair analyzed this week - USDCAD, EURUSD, DXY, GBPUSD, EURGBP, EURJPY, USDJPY - moved because of this number. The structural tell is not a diplomatic announcement. It is tanker tracking data. Watch three supertankers become thirty. When that happens, Brent flips from backwardation to contango - and the war premium exits. Conviction: Medium. Structurally bullish. Directionally binary on Iran.

EURJPY | Update - May 20, 2026 | 21:24 GMT+7 Carry Cross Bounces - But the Iran De-escalation Signal Is the Real Story

EURJPY | Update - May 20, 2026 | 21:24 GMT+7 Carry Cross Bounces - But the Iran De-escalation Signal Is the Real Story

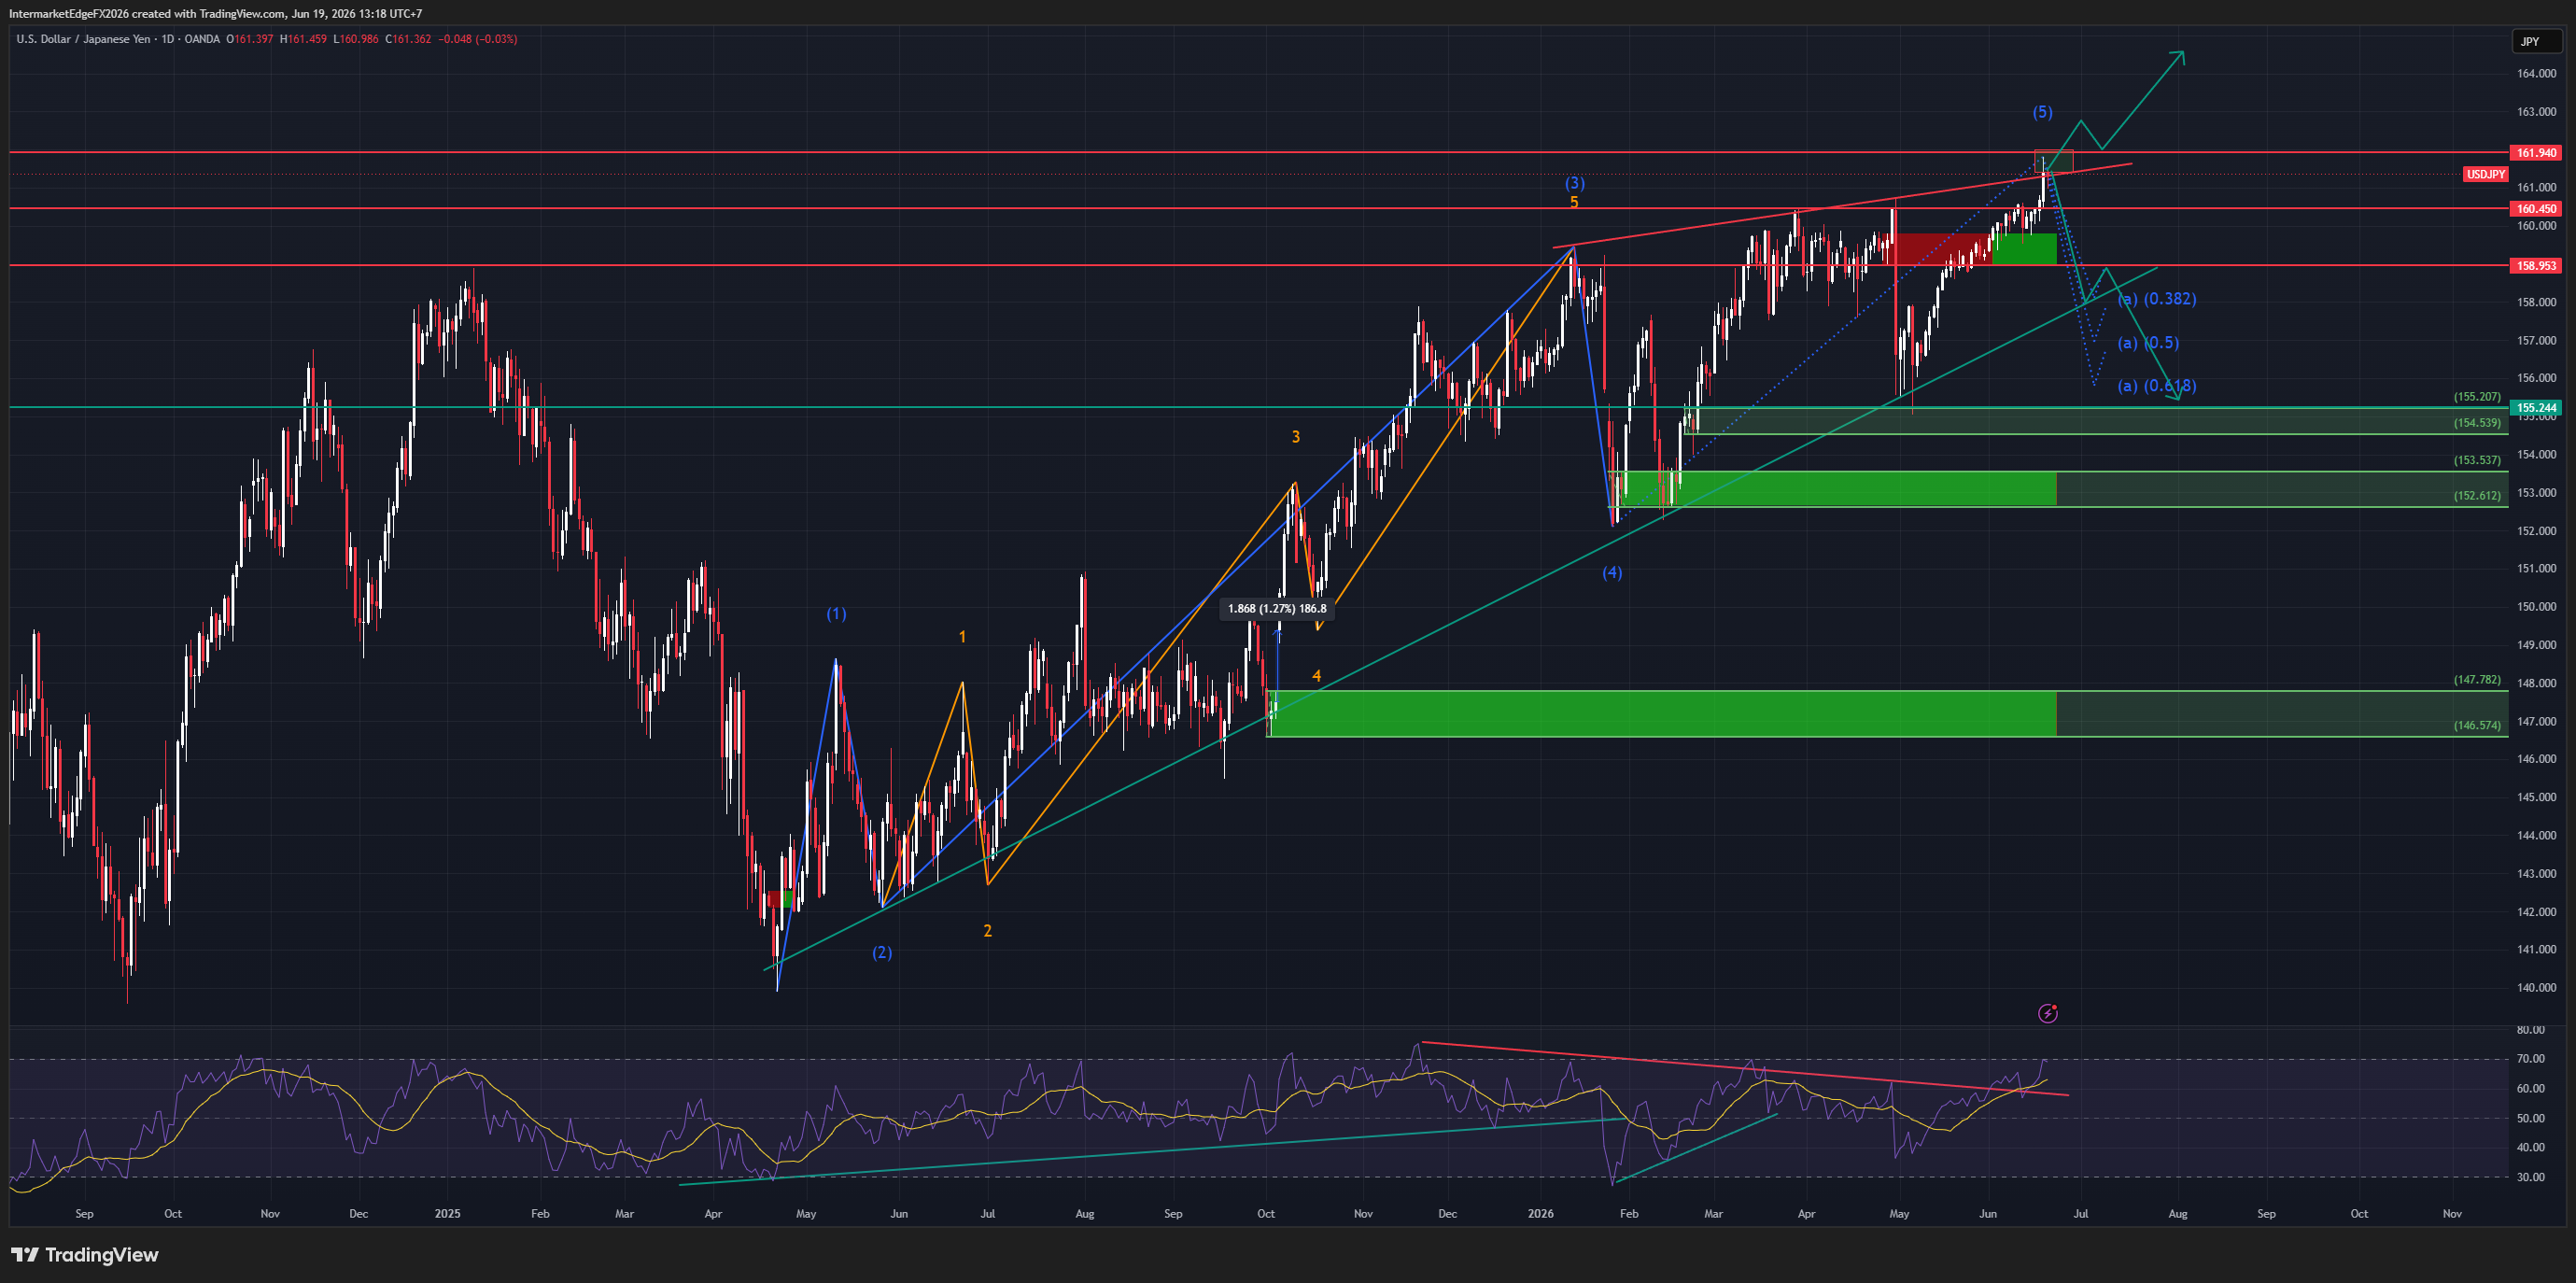
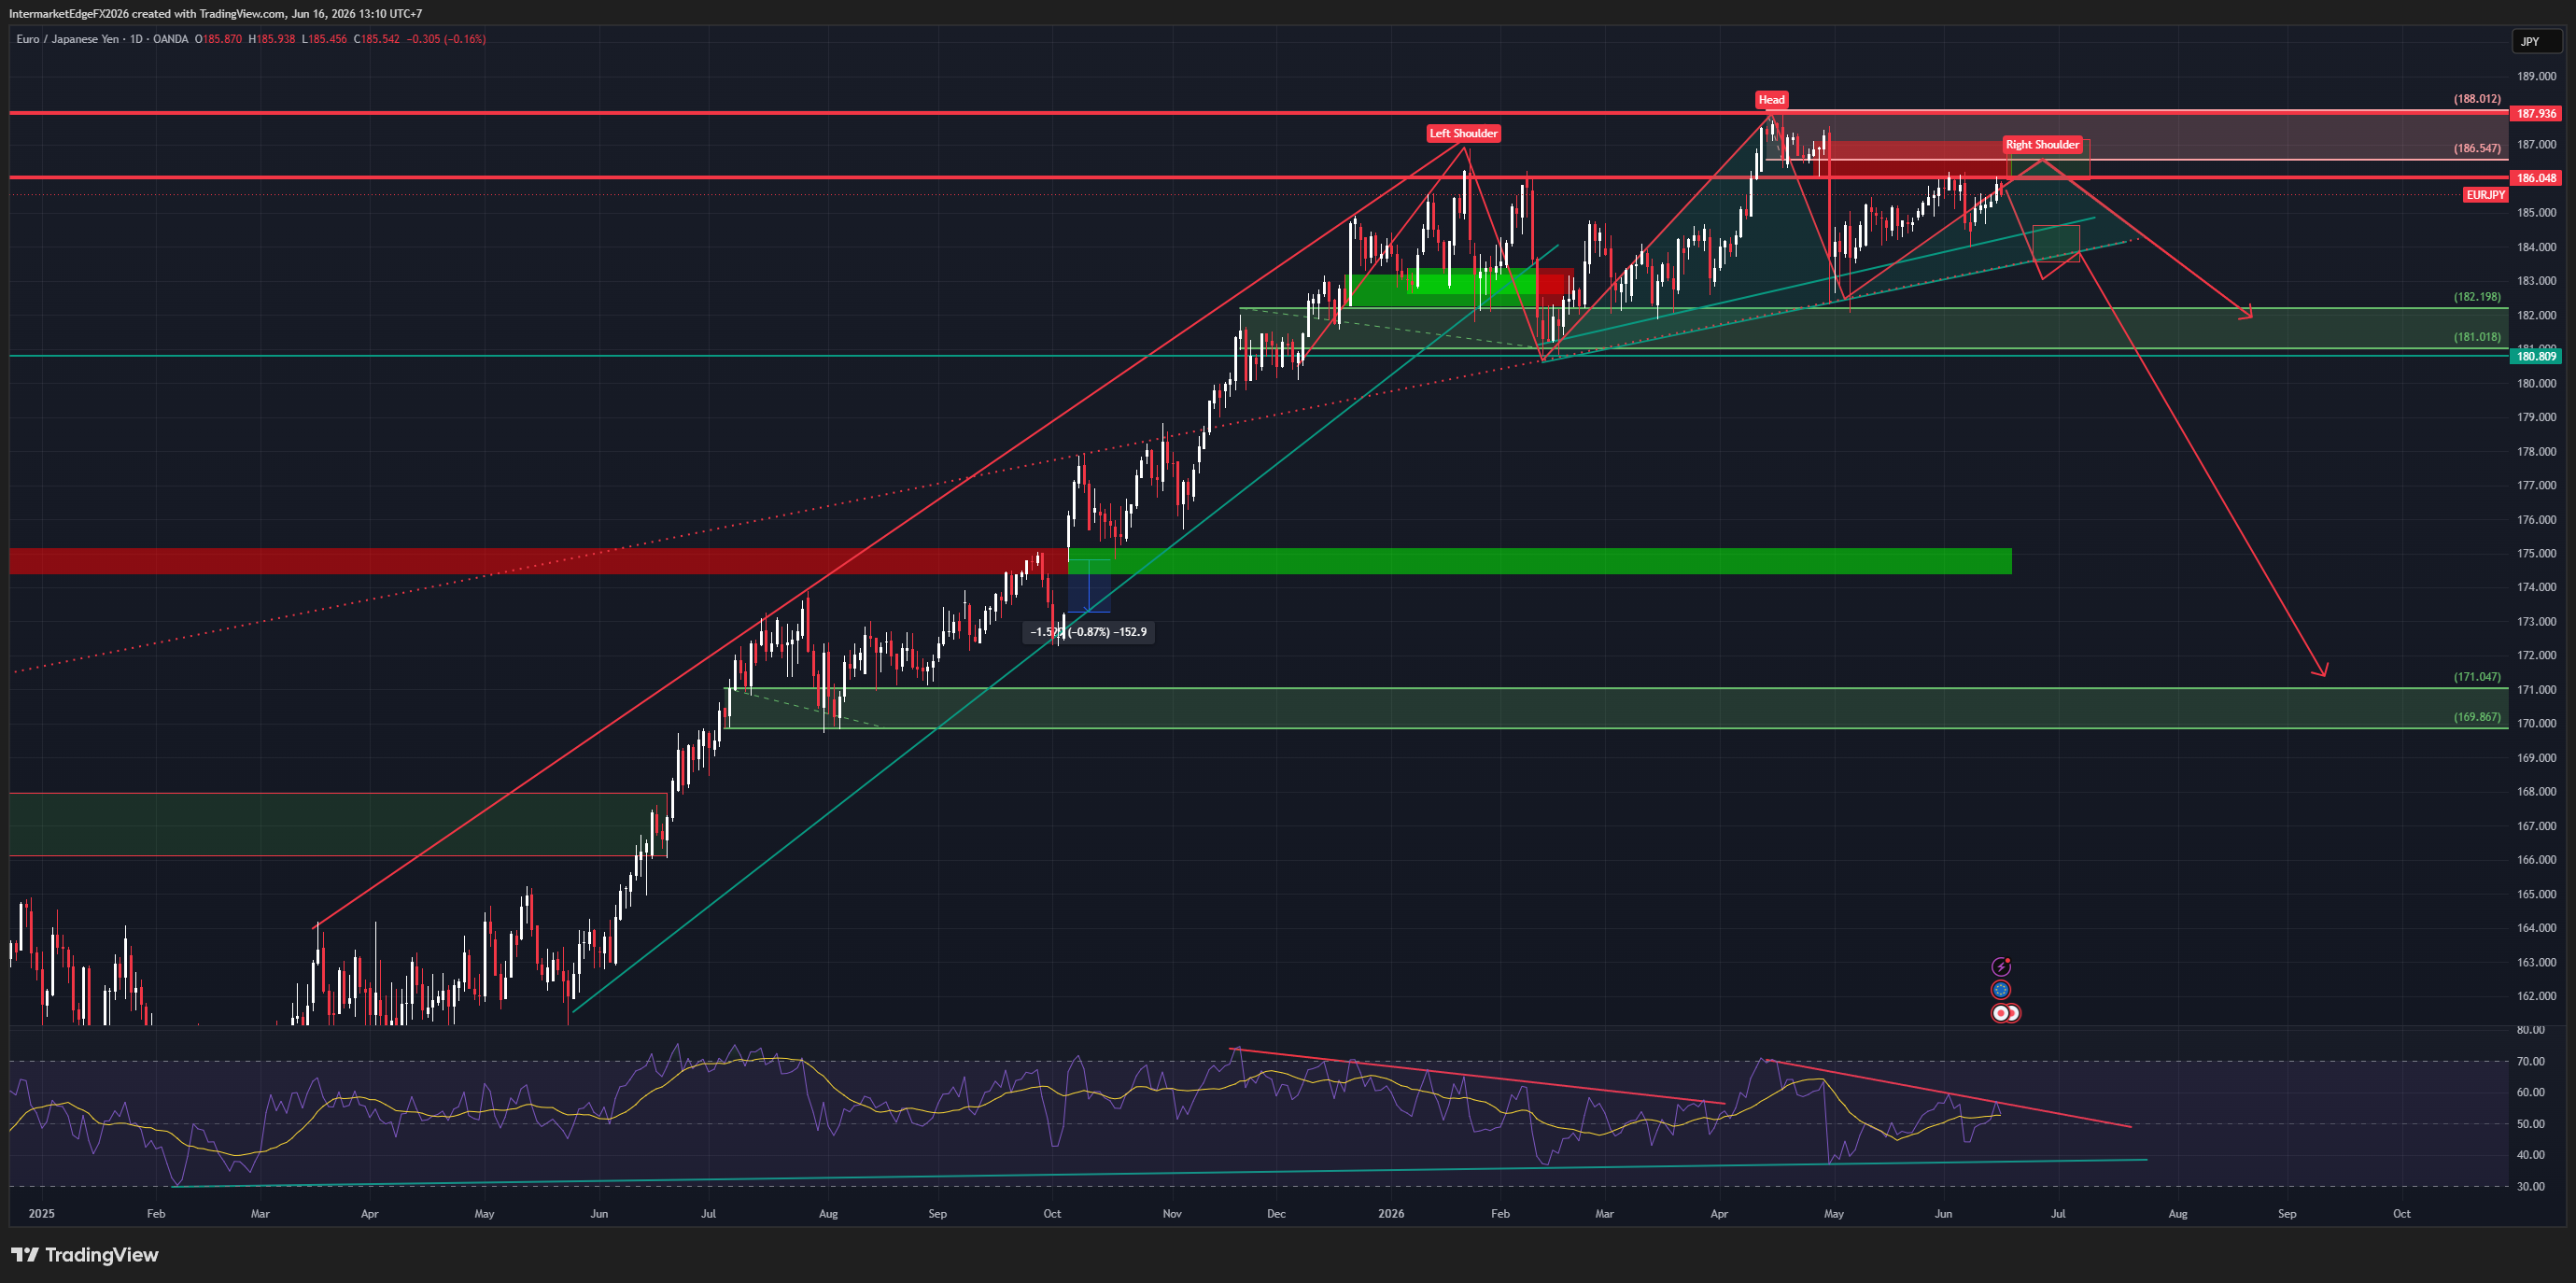
**EURJPY | Real-Time Update - May 20, 2026** EURJPY is at 184.59. The 24 basis point bounce from the session low is not the story tonight. What is happening behind that number is. Iran has sent an updated peace proposal to Pakistan mediators. Brent has dropped to $108.26 - the lowest level of the week. WTI is at $101.58. Oil has fallen nearly $3 in 48 hours. This is the market beginning to price the probability of Hormuz reopening, and it changes the entire analytical framework for EURJPY. The context matters. On May 6, when Trump paused Project Freedom citing "great progress," WTI plunged 15% intraday to $88. The market already showed how violently it reprices when a deal gets close. Tonight is a smaller version of that signal - Iran has sent a proposal, but Trump says he is "not satisfied." The market is pricing probability, not outcome. For EURJPY specifically, this creates a direct conflict. The EUR structural bid - the de-dollarization flow that has been supporting EURUSD above 1.15 despite the ECB cutting cycle - is built on Hormuz urgency. If that urgency compresses, the EUR loses a structural support layer. At the same time, equities are rising (S&P 500 +0.43% to 7,392), which means the carry trade is not being unwound. VIX at 17.91, DE-JP yield spread still +152bps - the carry math is intact. The result: Brent falling while equities rising. EURJPY downside is gradual, not a crash. Carry is not broken. EUR foundation is weakening. Three scenarios this week: Iran deal materializes in 48-72 hours - EURJPY drops toward 180-182 fast (25%). Talks continue without resolution - EURJPY consolidates 182-186, base case (55%). Talks collapse and Iran escalates - oil spikes, EURJPY volatile both ways (20%). The tell: watch Brent and EURUSD simultaneously. If Brent falls but EURUSD holds above 1.15, the structural bid is still absorbing the pressure. If both break together, 180 gets tested quickly. Do not chase tonight. Watch Brent. Watch the next Iran headline.

Gold at $4,553 - What Is the Market Still Pricing In?

Gold at $4,553 - What Is the Market Still Pricing In?

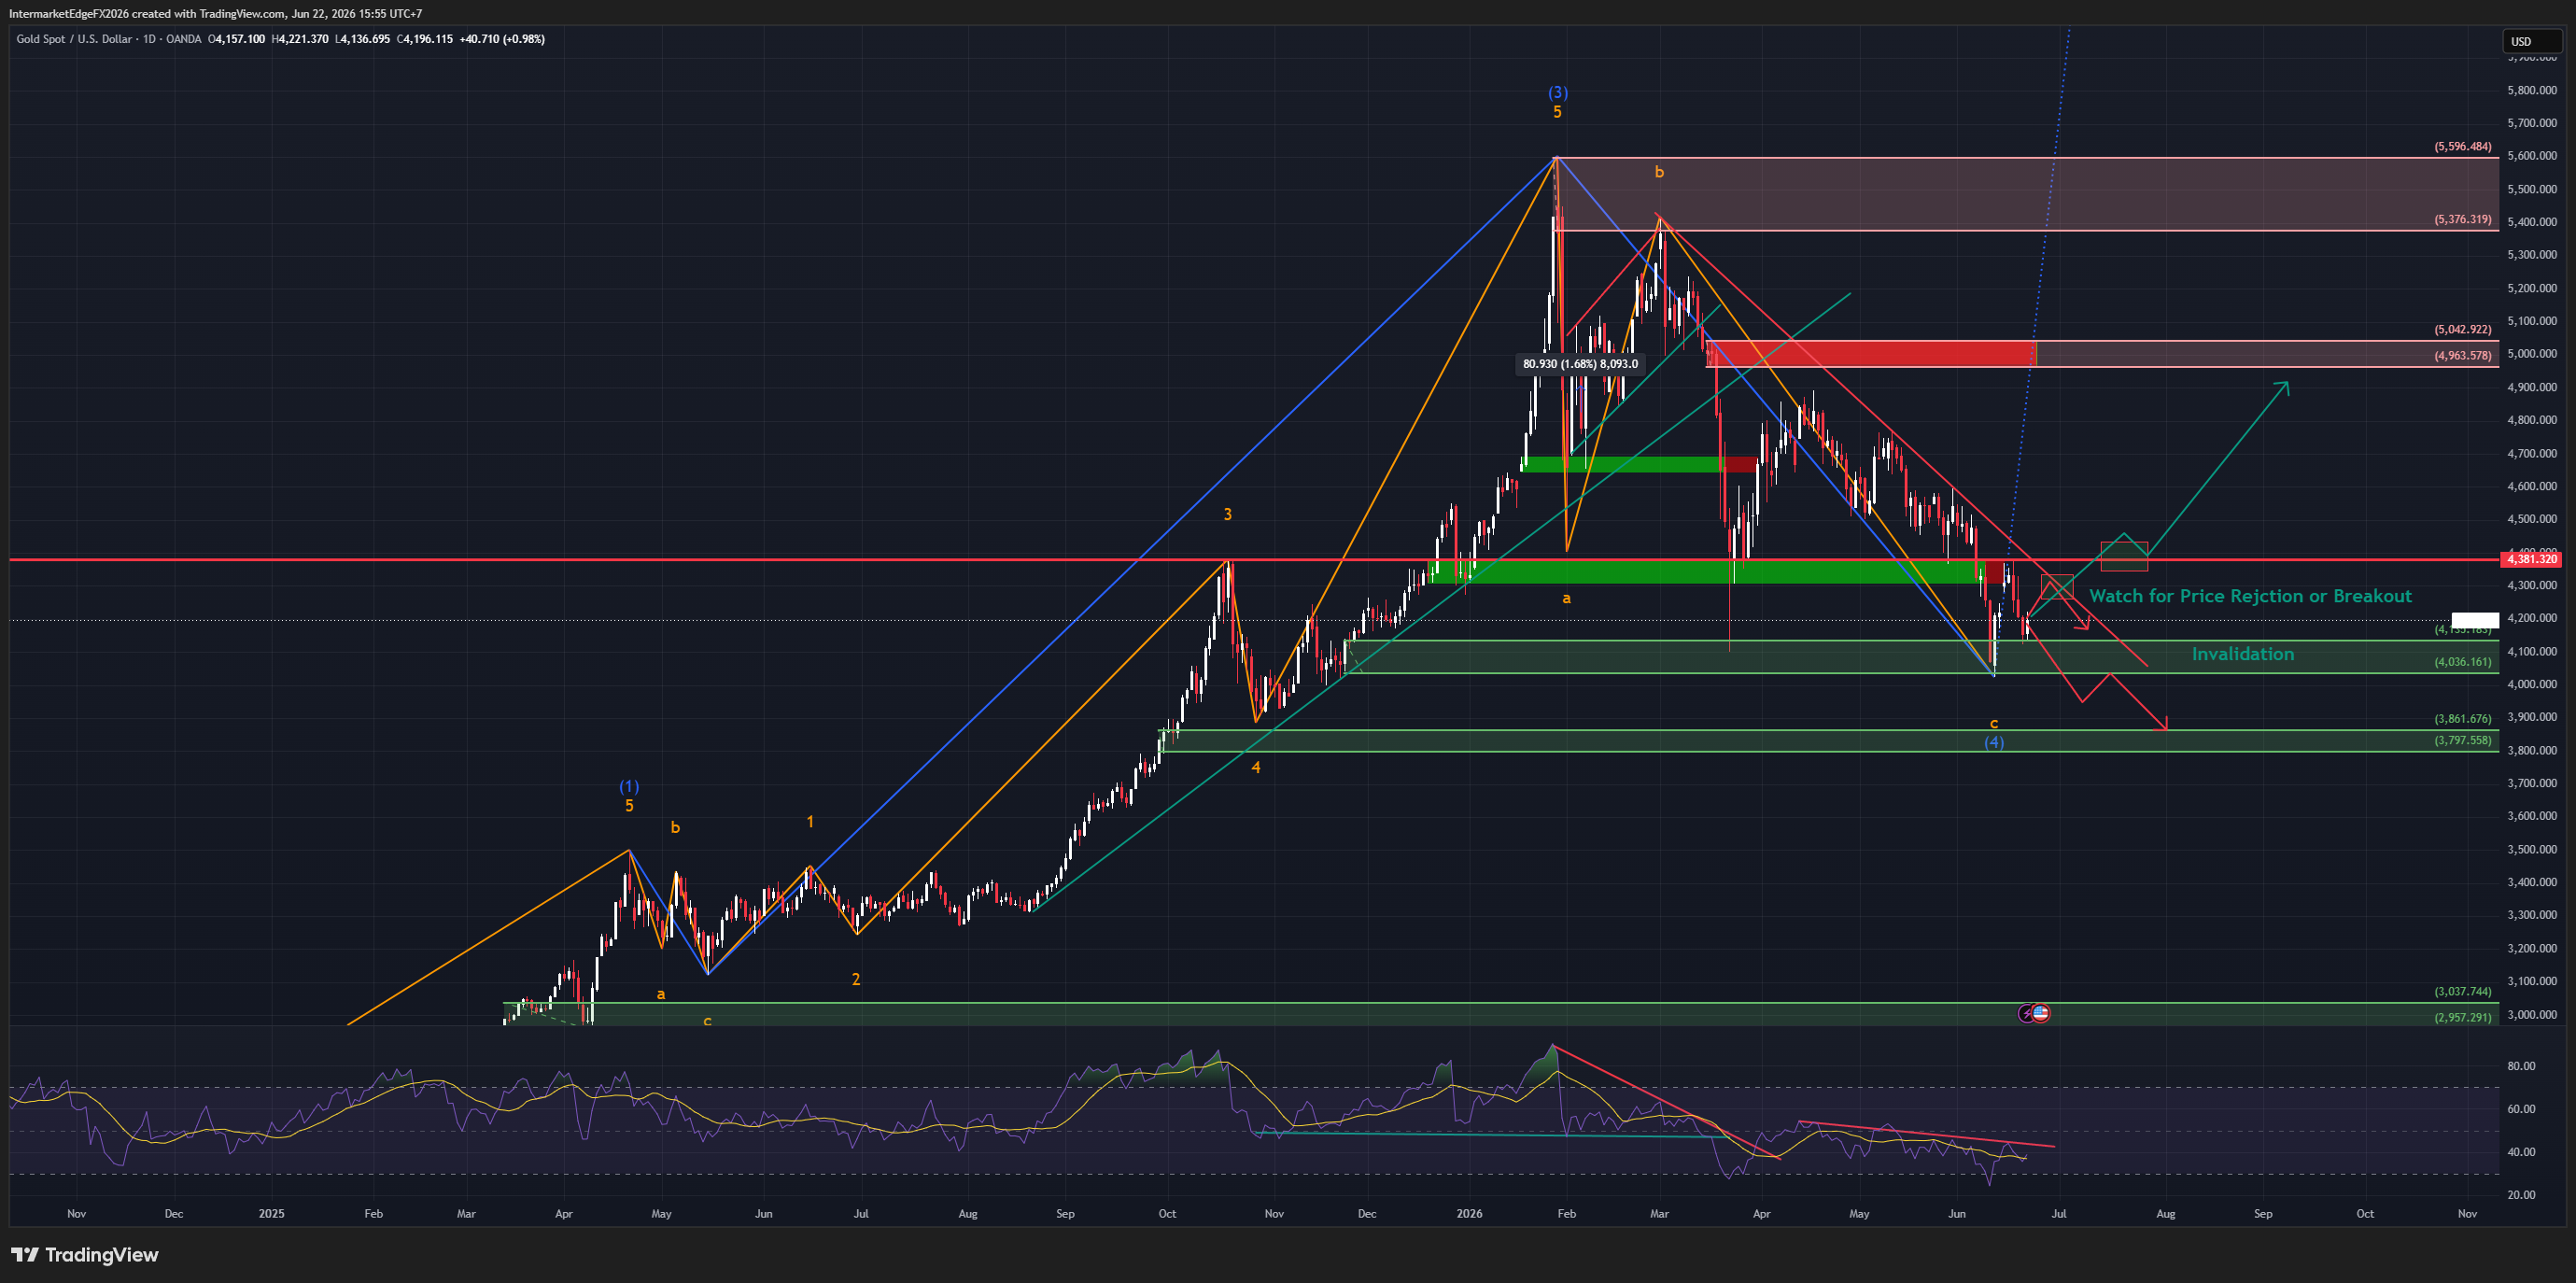
**XAUUSD | Weekly Outlook - May 19, 2026** Gold at $4,553 is not a speculative bubble price. It is a regime price - and understanding that distinction is the entire thesis of this analysis. Six months ago, $4,500 gold was a tail-risk scenario in institutional forecasting models. Today it is the base. The forces that drove it here - central bank accumulation running since 2022, the Hormuz geopolitical premium keeping Brent above $110, Warsh uncertainty creating a genuine unknown about the real yield path, and a structural de-dollarization bid from EM central banks and sovereign wealth funds - have not reversed. They are still active, still measurable, and still doing heavy lifting that the yield math alone cannot explain. What makes this regime unusual is that gold is holding all-time highs despite positive real yields. Classical monetary theory says this should not be happening. The fact that it is tells you the geopolitical and reserve asset restructuring layers are overriding the standard yield-gold relationship. This week, the directional catalyst is singular: FOMC Member Waller speaks Tuesday May 19. If he signals hikes are genuinely on the table for 2026, gold faces -$100 to -$150 intraday risk as the market reprices the real yield assumption embedded in current prices. If he maintains ambiguity, the $4,650-$4,700 upside target remains in play. Key support at $4,420. Invalidation on daily close below that level. Conviction: Medium-High. Structure favors the long side. Timing is Tuesday.

Stay in the loop

Get notified about new research, macro insights, and market analysis.

InterMarketEdge

© 2026 InterMarketEdge. Financial intelligence for inter-market traders.