Tag: Commodity — InterMarketEdge

Tag: Commodity

Gold W42: A Rebound Tests the Bearish View

Gold W42: A Rebound Tests the Bearish View

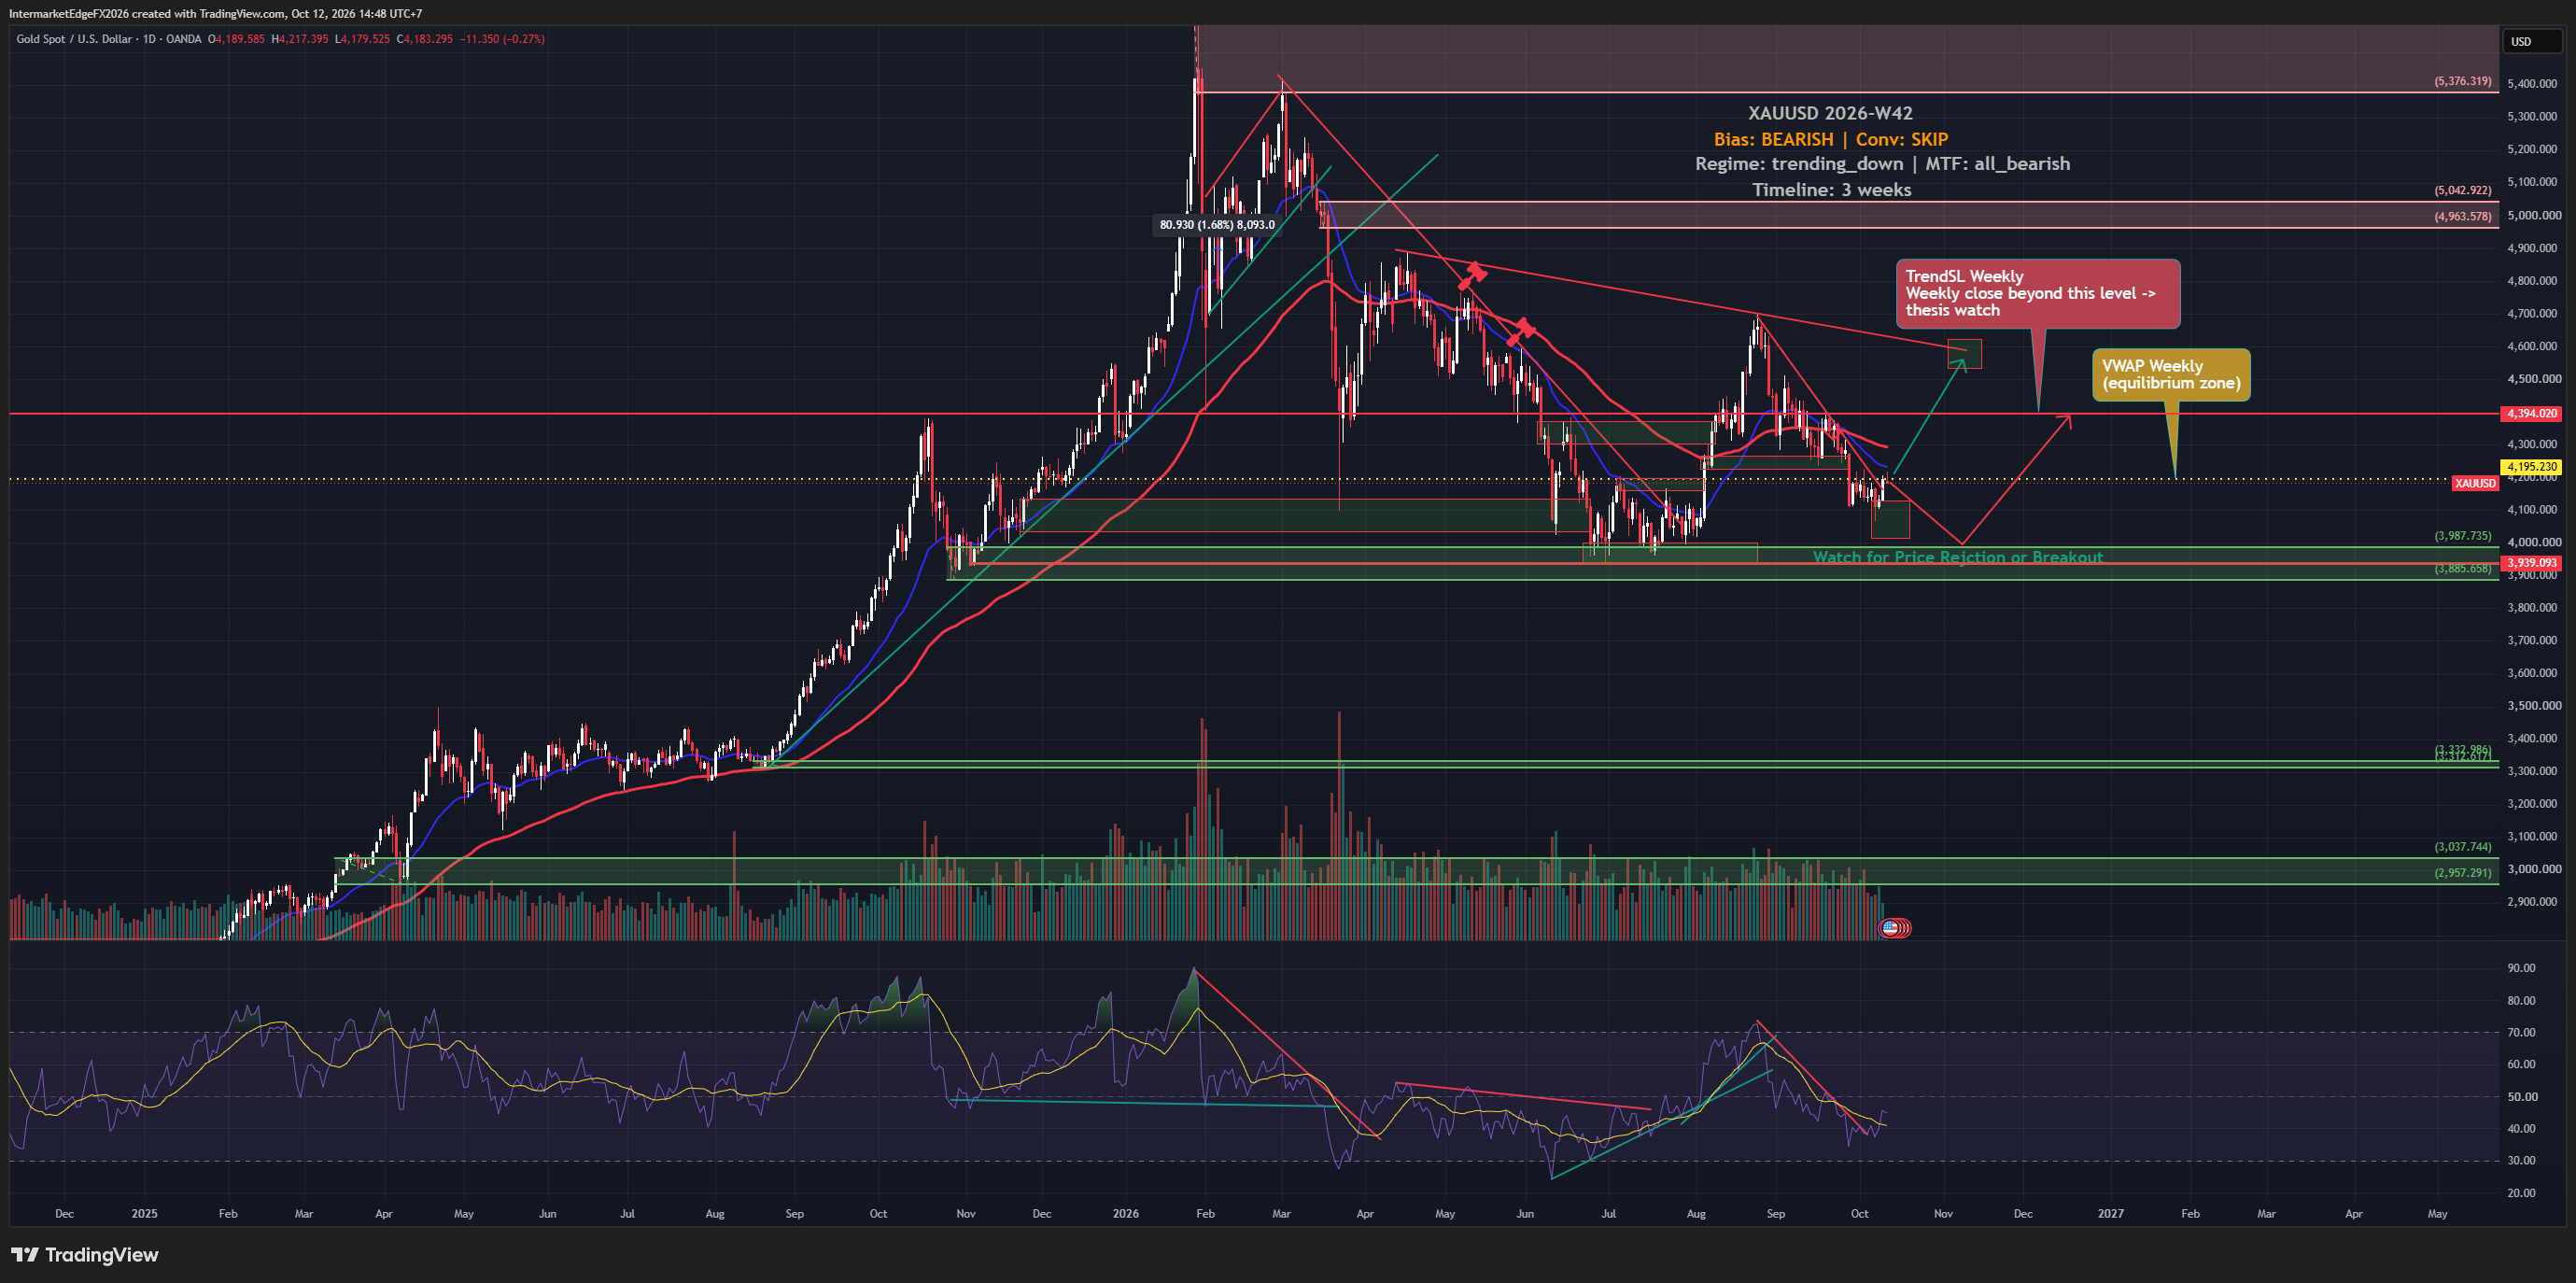
Gold W42 retains a bearish three-week view, with a decision to stand aside. Daily, weekly and monthly trend assessments remain downward. At 12/10/2026 07:41 UTC, XAUUSD was 4198.50 USD per troy ounce, above weekly VWAP 4195.23. Price remains below weekly TrendSL 4394.02. Source: mt5:XAUUSD.sml:1m, a timestamped broker quote. The near-term momentum warning against the bearish view is already active. This is not a future contingency and does not require a weekly close. A completed weekly close above 4394.02 would invalidate the bearish structure. That condition remains pending; an intraday move is not a completed weekly close. Reuters on 12 October reported gold strength alongside a softer dollar and oil. Lower oil does not automatically mean lower real yields. Watch DXY, nominal yields and inflation expectations together. ForexFactory lists CPI on 14 October and retail sales/PPI on 15 October; this is a secondary calendar source. Existing short exposure warrants reviewing and reducing risk under the trader's plan while the momentum warning is active. --- Intermarket Edge | Institutional Macro & Intermarket Analysis For informational and educational purposes only. Not financial advice.
DXY W42: Inflation Week Tests an Unconfirmed Bearish View

DXY W42: Inflation Week Tests an Unconfirmed Bearish View

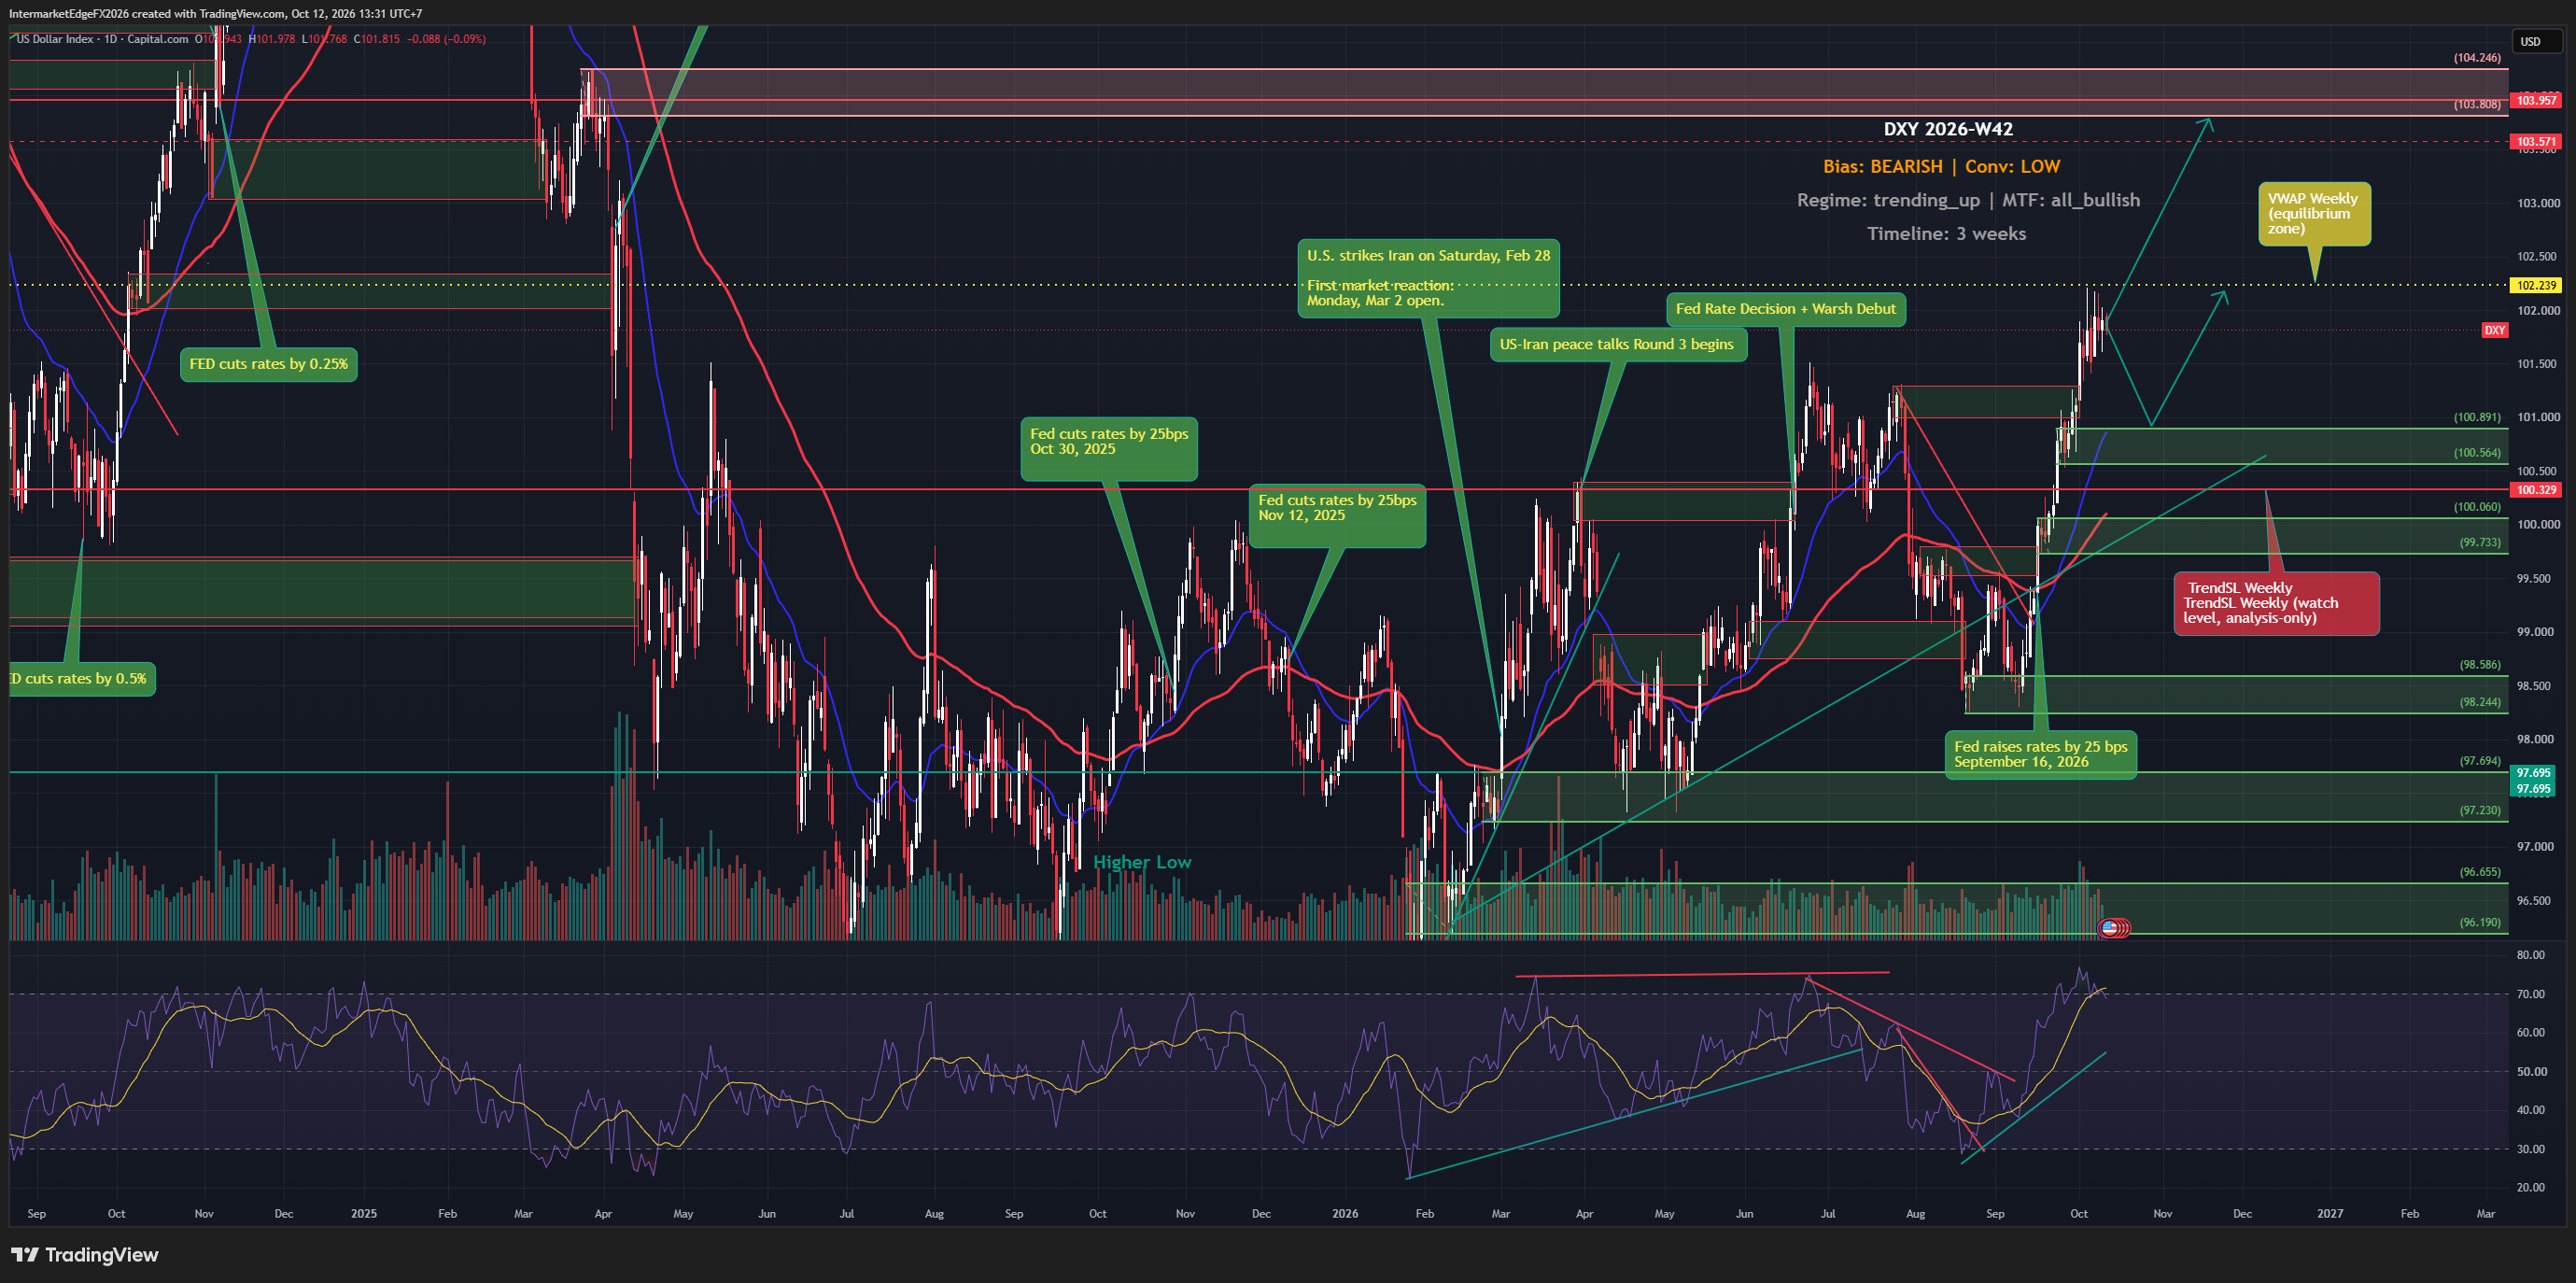
DXY W42 retains a bearish view with low confidence over three weeks, but daily, weekly and monthly trend assessments remain upward. The technical conflict is already active. At 12/10/2026 06:15 UTC, DXY was 102.218, below weekly VWAP 102.239. Price is already above weekly TrendSL 100.329. Source: yfinance:DX-Y.NYB:1m, a timestamped one-minute observation. A completed weekly close below 100.329 would provide bearish structural confirmation. This condition remains pending; an intraday move is not a completed weekly close. Sustained strength on the higher side of the weekly average would work against the bearish view. This momentum watch has no weekly-close requirement. A one-minute quote cannot establish sustained acceptance. Reuters on 12 October highlighted upcoming US inflation data and uncertainty around oil supply. ForexFactory lists CPI on 14 October, retail sales and PPI on 15 October, and a Fed Chair appearance on 16 October; it is a secondary calendar source. Monitor oil, EURUSD and yields together. Waiting for clearer agreement avoids confusing a directional view with an entry signal. --- Intermarket Edge | Institutional Macro & Intermarket Analysis For informational and educational purposes only. Not financial advice.
USDCAD Week W40-2026: CAD Drops to a 17-Month Low as USD Strength and Stalled Canadian Growth Collide

USDCAD Week W40-2026: CAD Drops to a 17-Month Low as USD Strength and Stalled Canadian Growth Collide

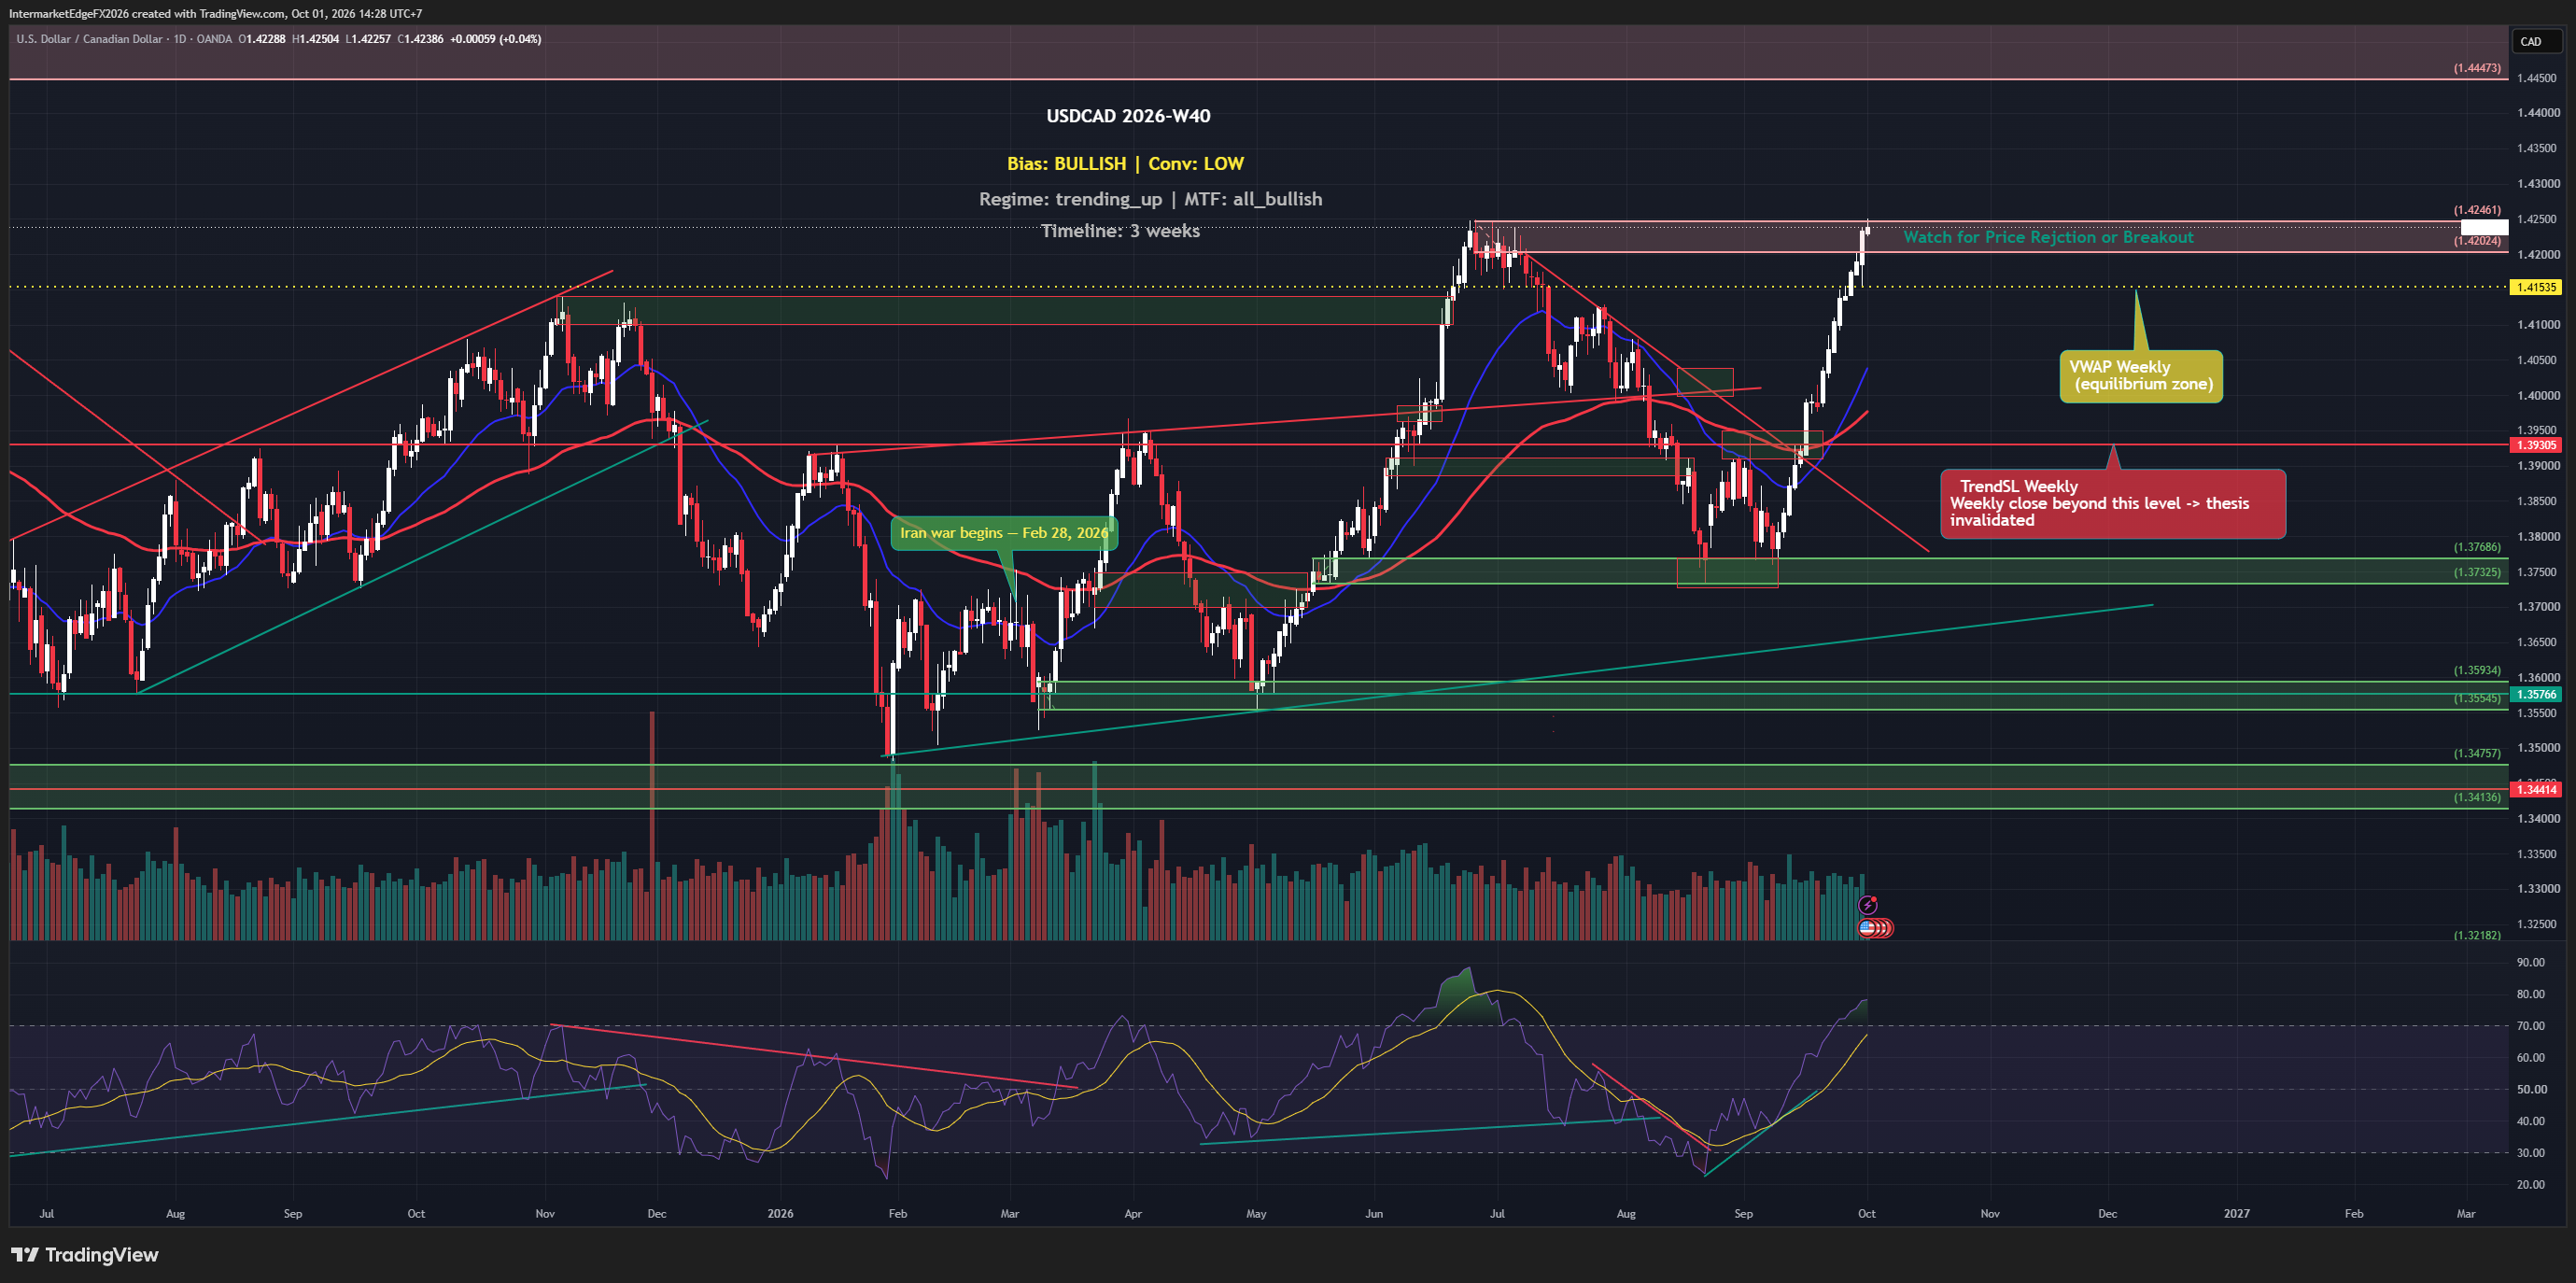
The Canadian dollar just touched a 17-month low even as domestic bond yields climbed, a setup that seems contradictory until you understand what is actually driving it. When US 10-year real yields reach 2.9% and Canadian GDP growth stalls simultaneously, higher local yields stop being a support and start being a symptom of stress. USDCAD is trading at 1.42467 as of Thursday, 1 October 2026, sitting above its weekly VWAP at 1.41535 and well clear of trend support at 1.39305. The bullish structure is intact, but conviction remains deliberately low. The bullish case for USDCAD rests on three mutually reinforcing forces that are currently aligned across every measured timeframe. First and most durable is the macro driver: a Fed that is holding rates high, with real yields near multi-year peaks, against a Bank of Canada that is increasingly constrained by a domestic growth slowdown. That divergence, the Fed-BOC policy gap, does not need to widen further to support the pair; it simply needs to persist, and stalled Canadian GDP makes persistence the base case. Second, COT positioning data, which tracks how large non-commercial futures participants are positioned, providing a directional read on professional sentiment though the available source does not specify the exact report week or net-position figure, so it should be read as a directional lean rather than a precisely dated statistic, shows a bullish tilt with a meaningful score, adding an institutional-positioning layer to what is otherwise a pure macro story. Third, the market is in an established uptrend with bullish alignment across the tracked timeframes, meaning shorter-term momentum and longer-term structure are pointing the same direction rather than in conflict. Conviction, however, sits at low, and that framing matters. This is not a weak signal dressed up as a trade. The overall score is below the threshold where position sizing would be straightforward. -- Intermarket Edge

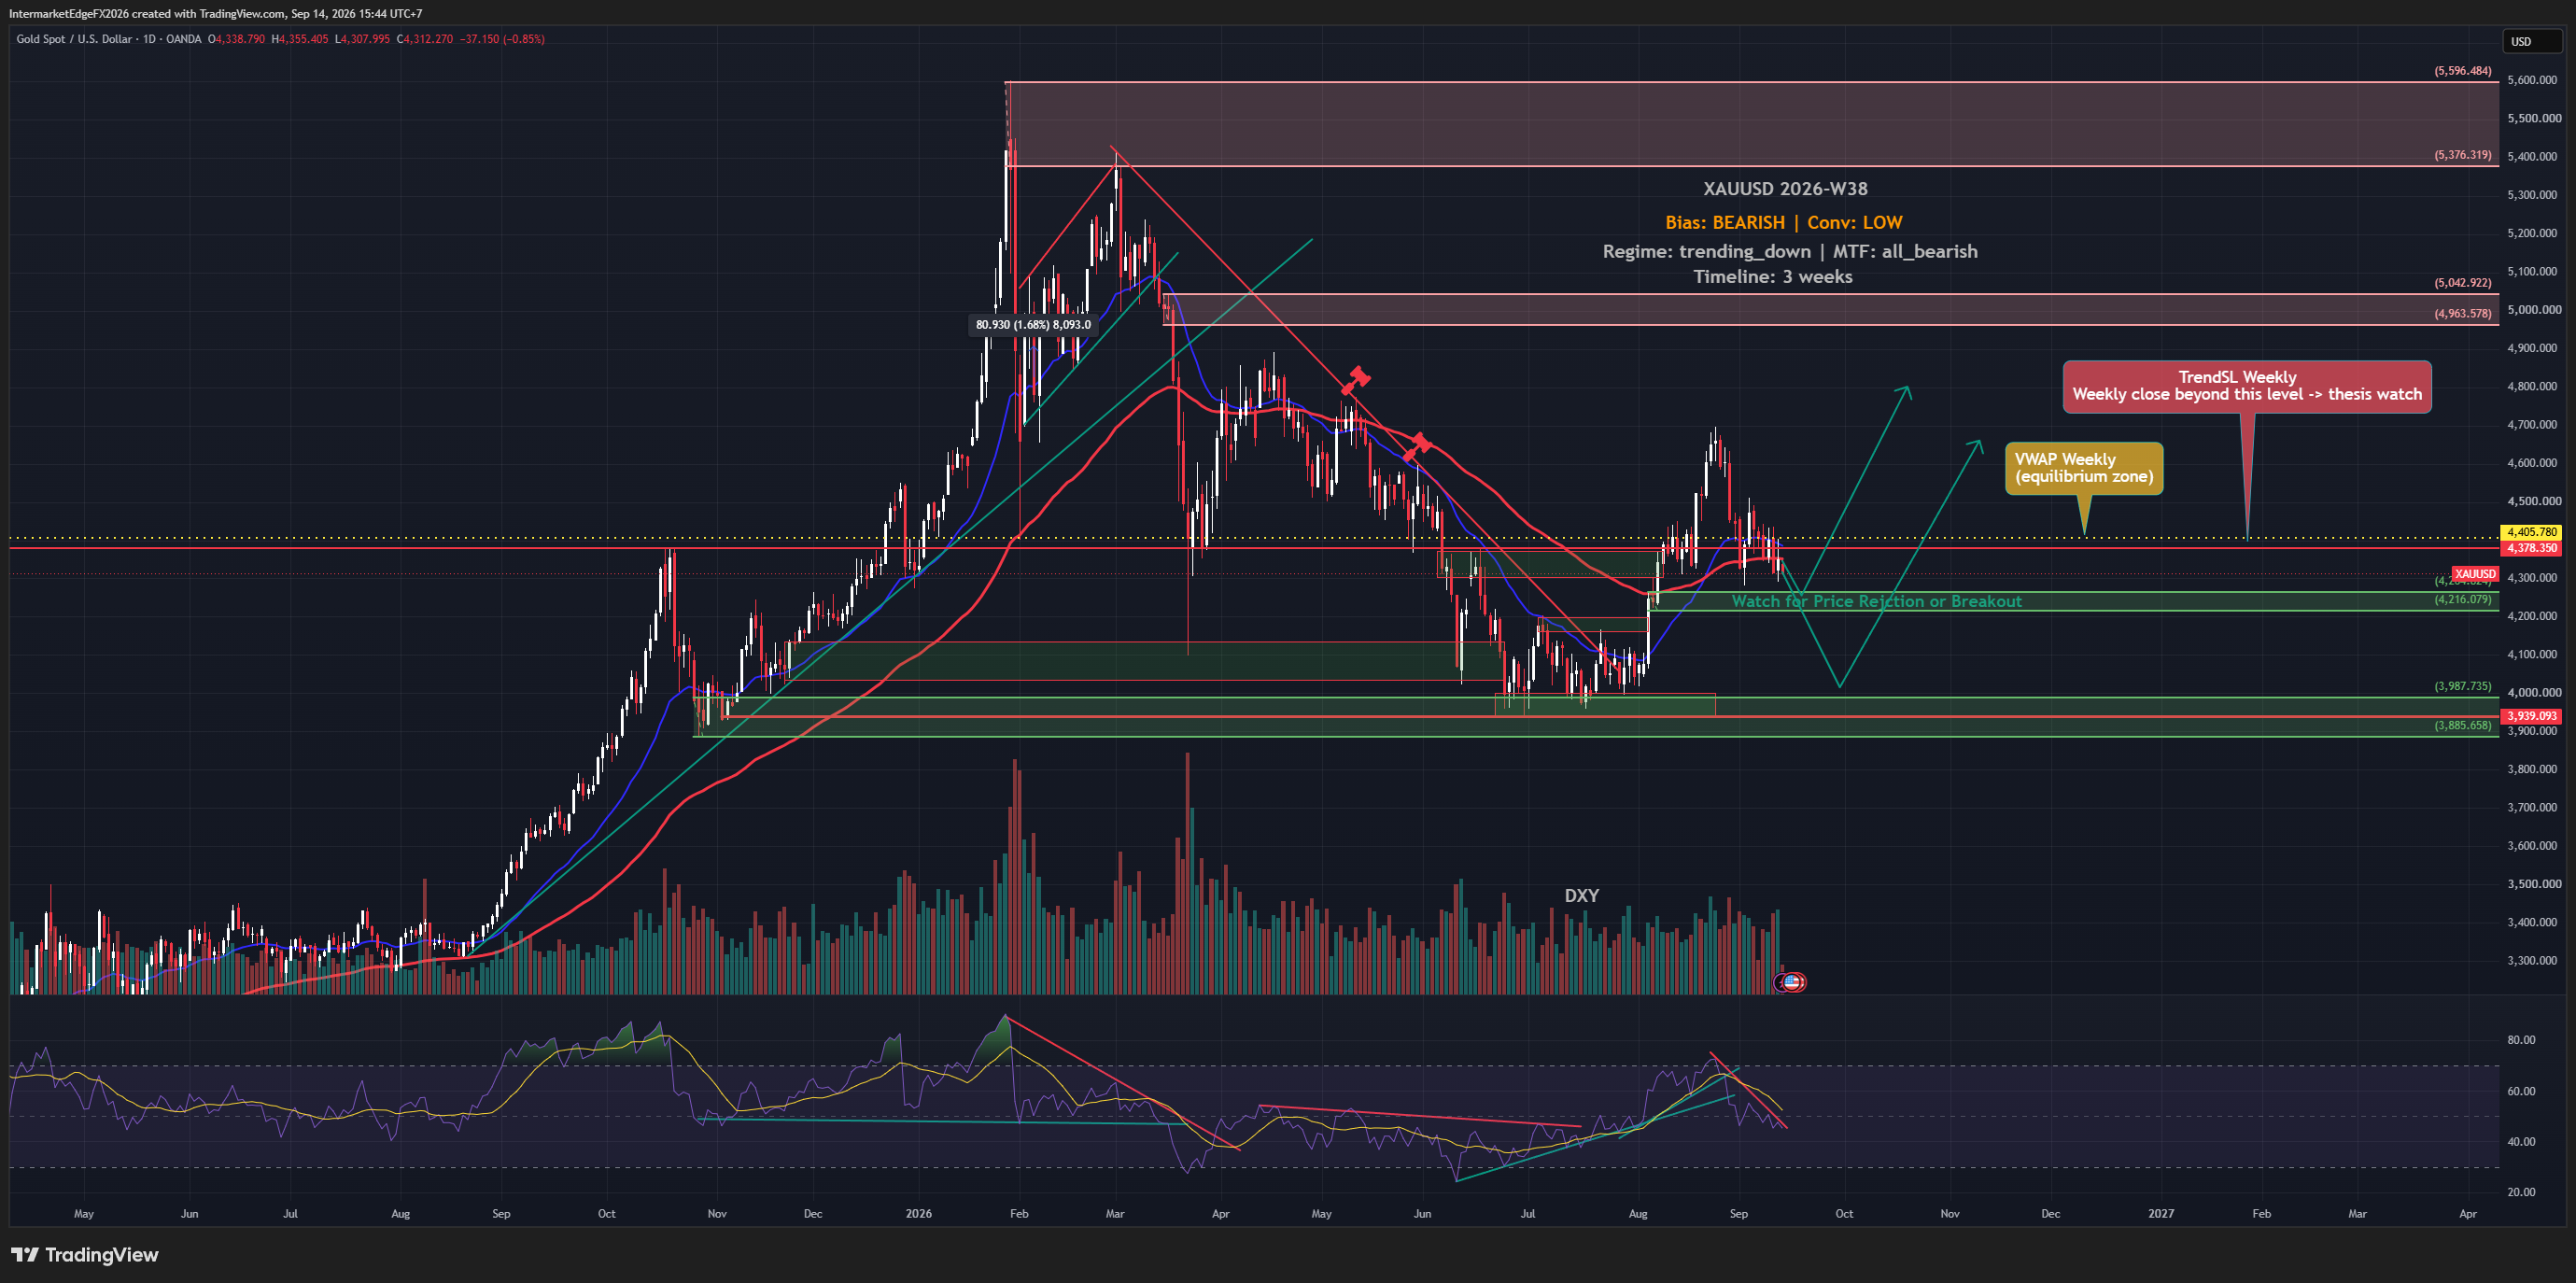
XAUUSD W38: Gold Rebounds, but FOMC Can Reset the Move

XAUUSD W38: Gold Rebounds, but FOMC Can Reset the Move

Gold is trading at 4329.19 as of Monday, 14 September 2026, and the bearish structure across all timeframes remains intact, yet price simply will not fall with conviction. Strong US inflation data and rising oil prices pushed Fed rate-hike expectations higher, which historically pressures gold, but the metal rebounded more than 1% on dip buying even as those hike bets increased. That divergence between macro pressure and price behavior is the central tension this week. The overall framework flags a bearish bias on XAUUSD for W38-2026, with the trend regime pointing consistently lower across every timeframe. However, this is precisely the week where reading the label without reading the evidence underneath it will get a trader into trouble, because the conviction behind that bearish call is low, and the reason matters. The individual signal doing the most work inside the analysis is price action, which is actually scoring bullish. The macro channel, the classic Fed-hawkish-leads-to-gold-bearish transmission, has been explicitly set aside after backtesting showed it produced a correct directional read only about 35.9% of the time on this instrument; the sample size, test period, and exact definition of 'correct' are not specified in the available data, so that figure should be treated as directional context rather than a standalone citable statistic. What that means practically: the most commonly cited reason to be bearish gold this week, rising rate-hike expectations, is the one the analysis has deliberately discounted. The bearish label therefore rests primarily on trend structure and timeframe alignment, not on a reinforcing macro catalyst. Retail positioning adds a contrarian lean: 67% of retail accounts tracked by FXSSI on 14 September are long XAUUSD. -- Intermarket Edge

USOIL W37: Bearish Thesis Tested as Brent Tops $100

USOIL W37: Bearish Thesis Tested as Brent Tops $100

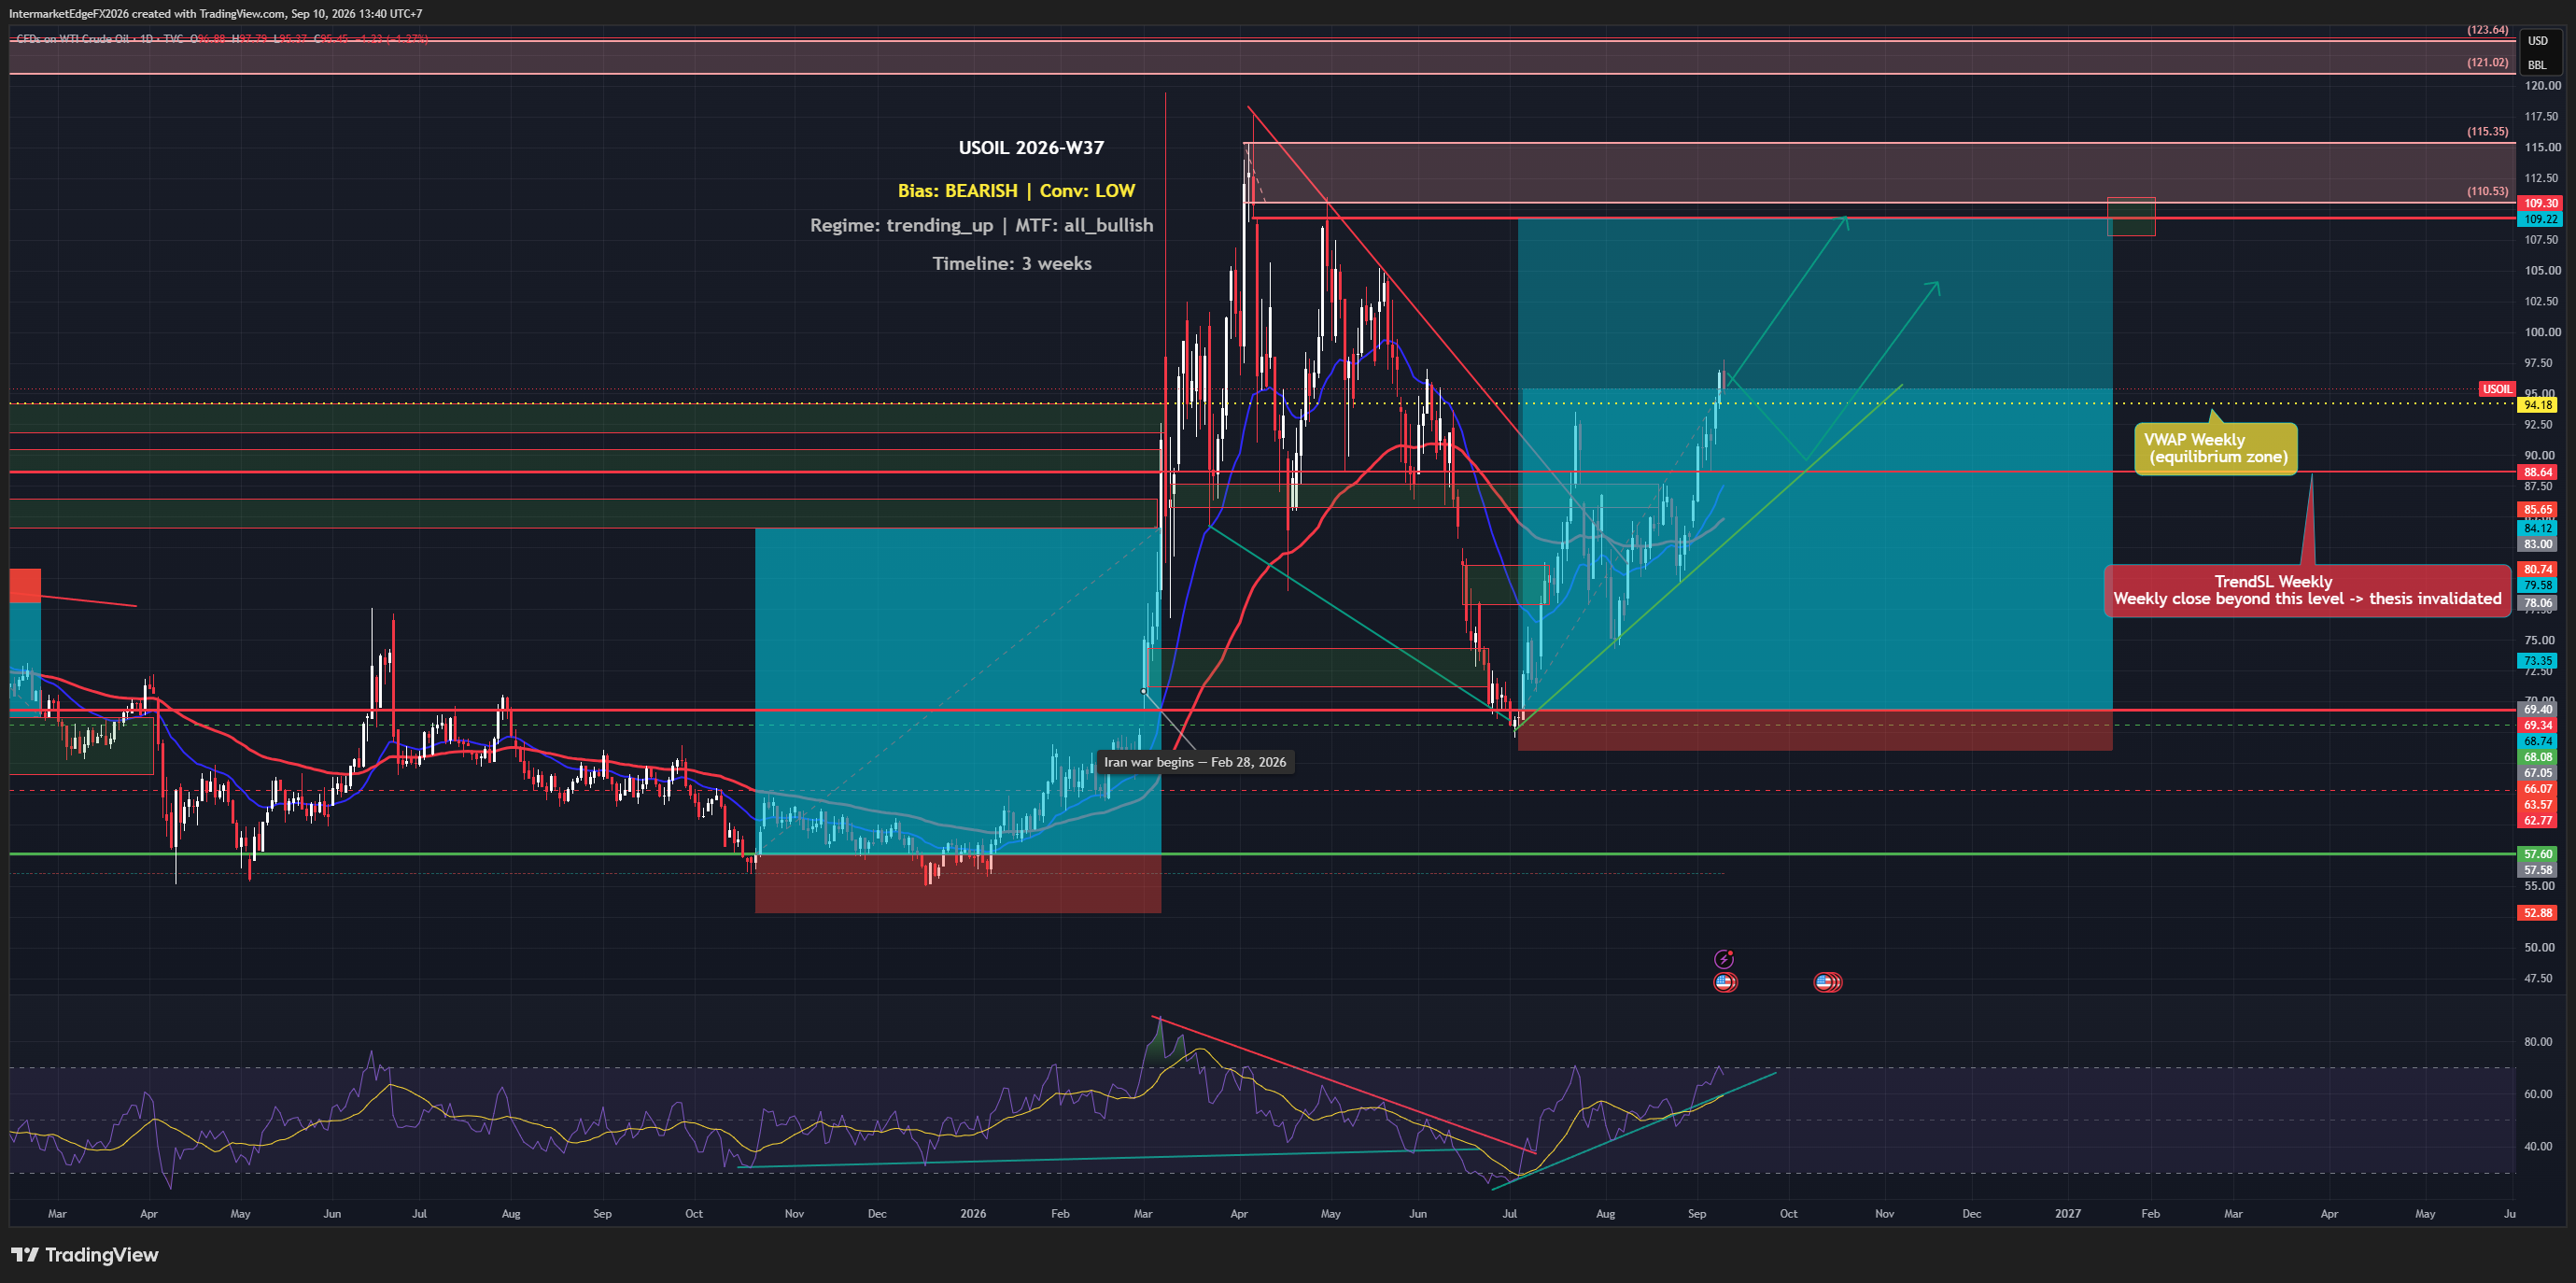
Brent crude is holding above $100 on escalating US-Iran attacks against shipping, and every major technical timeframe on USOIL is pointed higher. Yet the structural analysis this week lands bearish, not because the headline risk is wrong, but because inventory builds and a hawkish Fed create a fundamental undertow that the geopolitical premium tends to obscure. The setup is genuinely conflicted, and that conflict is the story. The structural bias for USOIL this week is bearish, but the conviction behind that call is low, and that low conviction is not a minor caveat, it is the central fact. Every quantified signal this week, price action, COT positioning, and macro scoring, registered bullish, yet the framework's structural weighting returns a bearish output. Traders need to sit with that honestly: this is not a clean bearish setup backed by converging evidence. It is a case where top-down structural logic is pushing against a wall of bottom-up signals that all point the other way. The macro case for bearishness runs through two specific channels. First, rising real yields with a hawkish Fed support USD strength, which functions as a quote-side headwind for oil, when the dollar firms, dollar-denominated commodity prices face an automatic gravitational pull lower, all else being equal. Second, the four-week average of actual crude inventory builds has exceeded 1.5 million barrels, meaning physical supply has been accumulating in the US even as the geopolitical narrative dominates the tape. Inventory builds of that magnitude sustained over a month are a concrete fundamental drag, not a sentiment reading. On the other side, COT positioning leans bullish, note that the report week and net-position figure are not specified in the available data, so this should be read as a directional tilt rather than a precisely citable number. -- Intermarket Edge

XAUUSD Week W37-2026: Jobs Data Crushes Consensus, But Gold Has Not Broken Down Yet

XAUUSD Week W37-2026: Jobs Data Crushes Consensus, But Gold Has Not Broken Down Yet

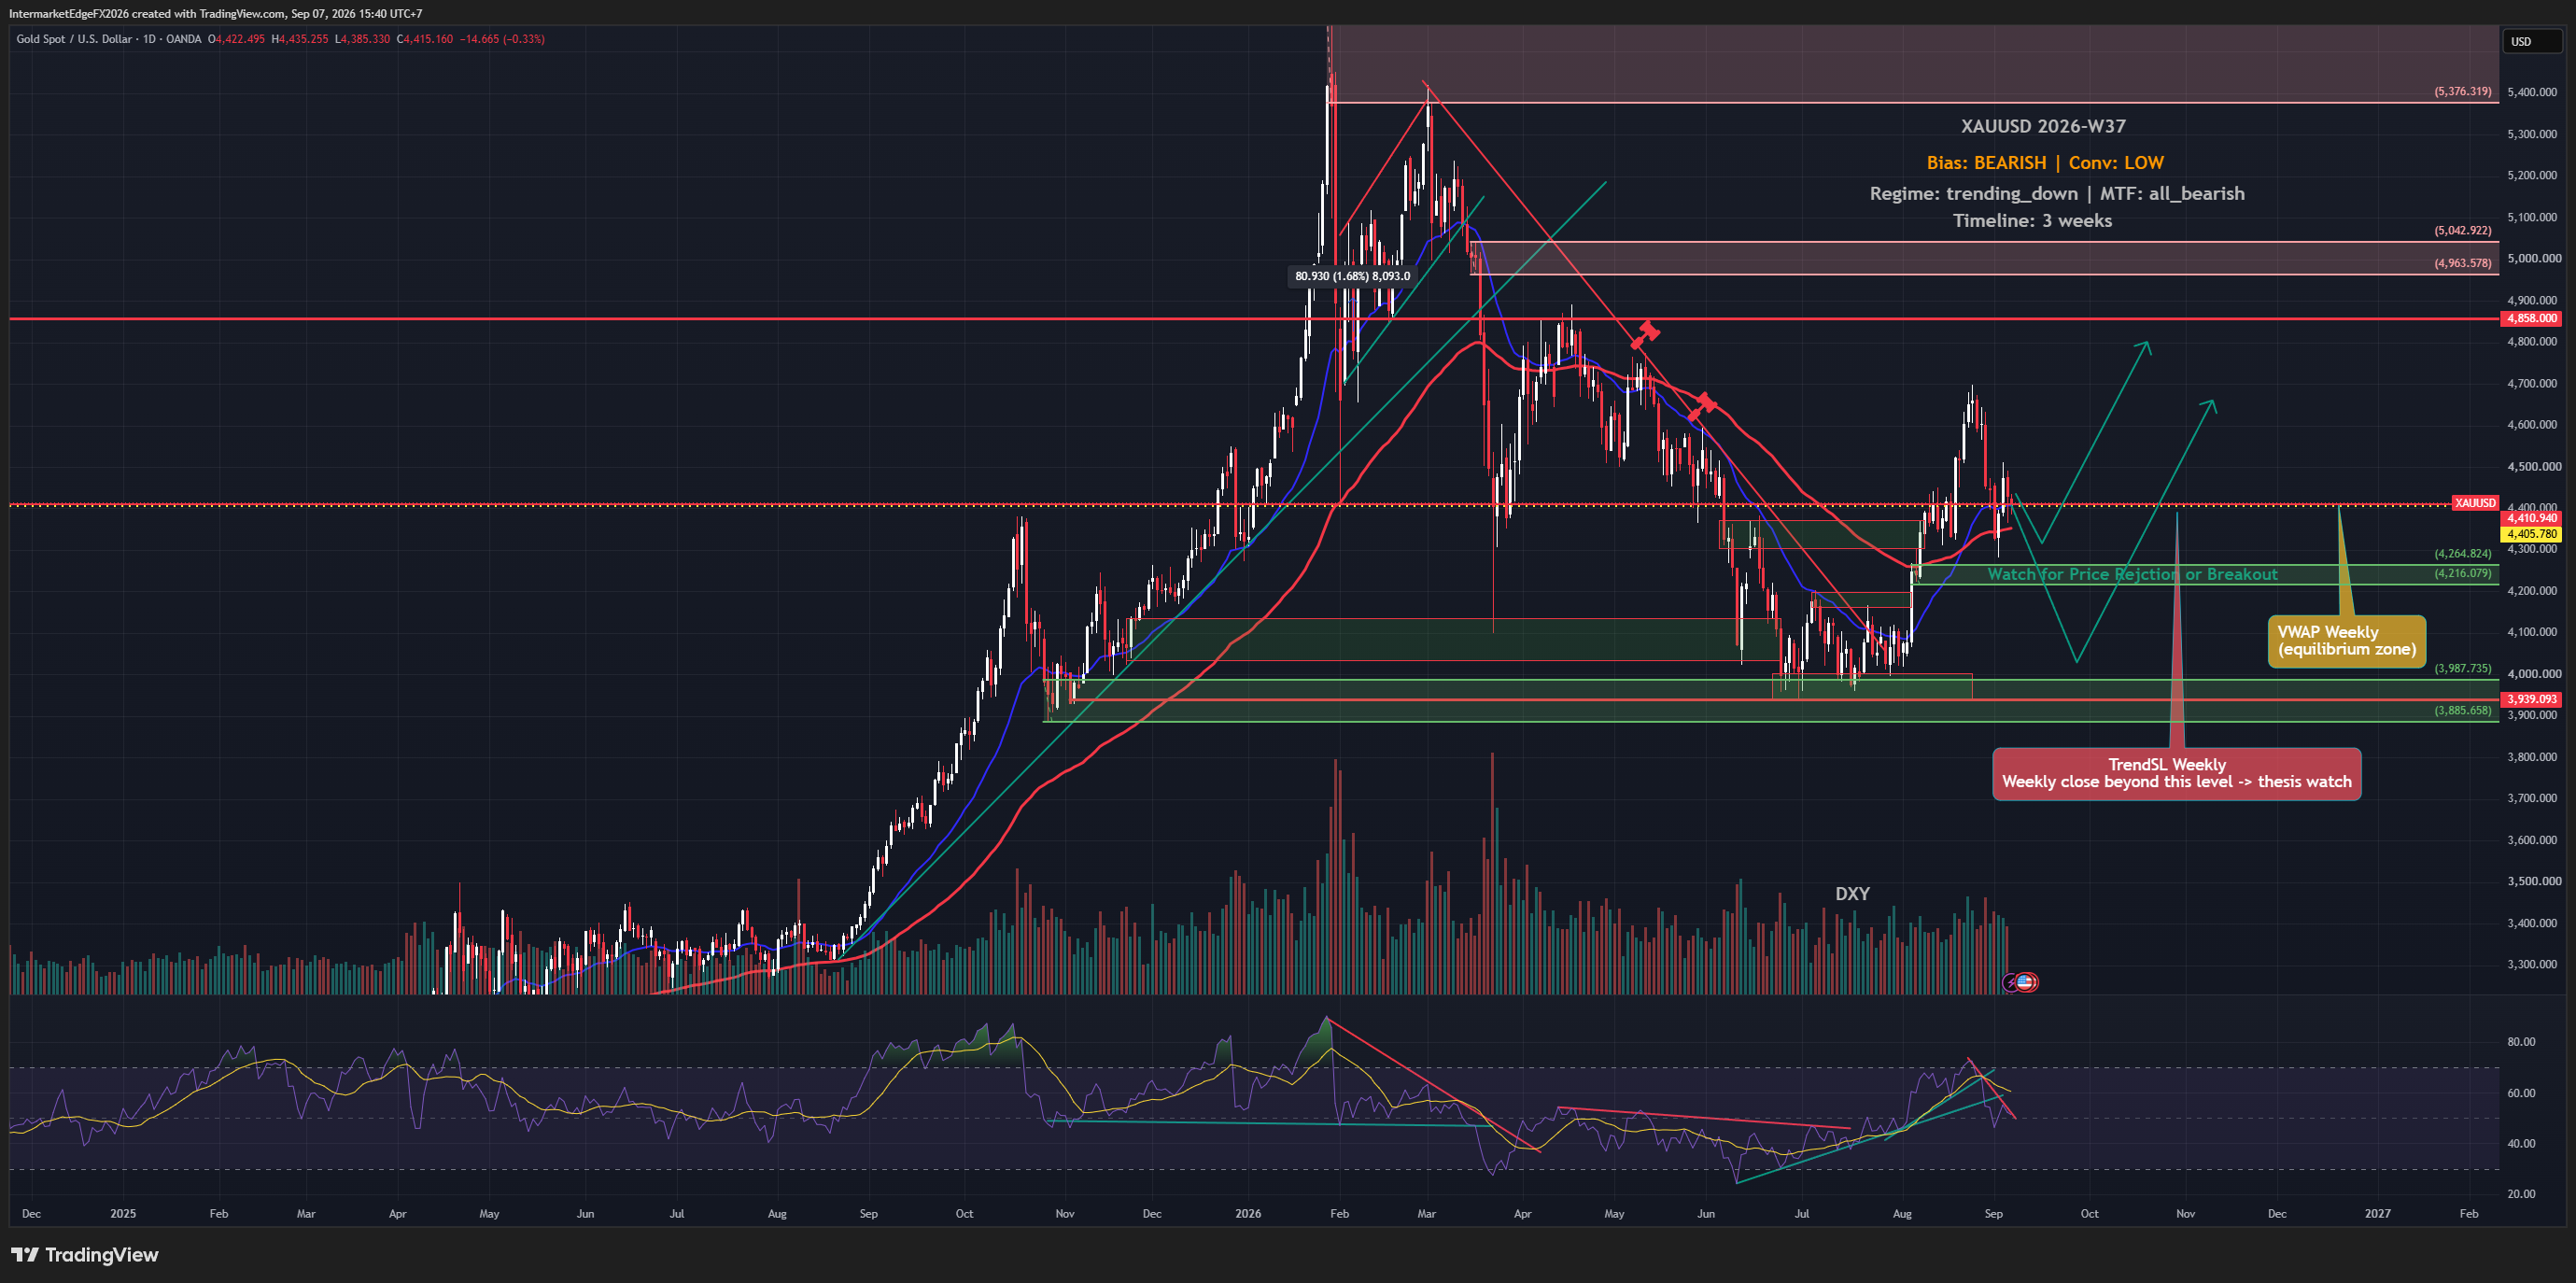
XAUUSD Week W37-2026: bearish structure, low conviction. Gold faced pressure after August payrolls rose 162,000 against the Reuters consensus of 56,000. But Hormuz tensions create competing safe-haven and inflation-policy risks. Neither that news nor the payrolls surprise guarantees a gold direction. The locked quote is 4403.68 at 08:17 UTC on Monday, September 7, 2026, source mt5:XAUUSD.sml:1m. Price is BELOW VWAP weekly 4405.78 by 2.10 and BELOW TrendSL weekly 4410.94 by 7.26, testing both from underneath. The view is bearish with low conviction over three weeks; the regime is a downtrend and monitored timeframes are bearish. The current stance is to stand aside. This is not an entry instruction. If price sustains above VWAP weekly 4405.78, it would warn of momentum against the thesis and warrant reviewing the size of existing shorts. Only a weekly close above TrendSL weekly 4410.94 would invalidate the bearish structure. Both conditions remain pending. August PPI is scheduled for September 10 and CPI for September 11, both at 08:30 US Eastern / 19:30 Vietnam time, per ForexFactory calendar data. Outcomes are unknown. Softer CPI could support gold if real yields and USD fall; hotter CPI could pressure it if both rise. Observe those responses rather than assuming them. Intermarket Edge For information and education only. Not financial advice.

USDCAD Week W36-2026: CAD Strengthens Despite a Hawkish Bank of Canada

USDCAD Week W36-2026: CAD Strengthens Despite a Hawkish Bank of Canada

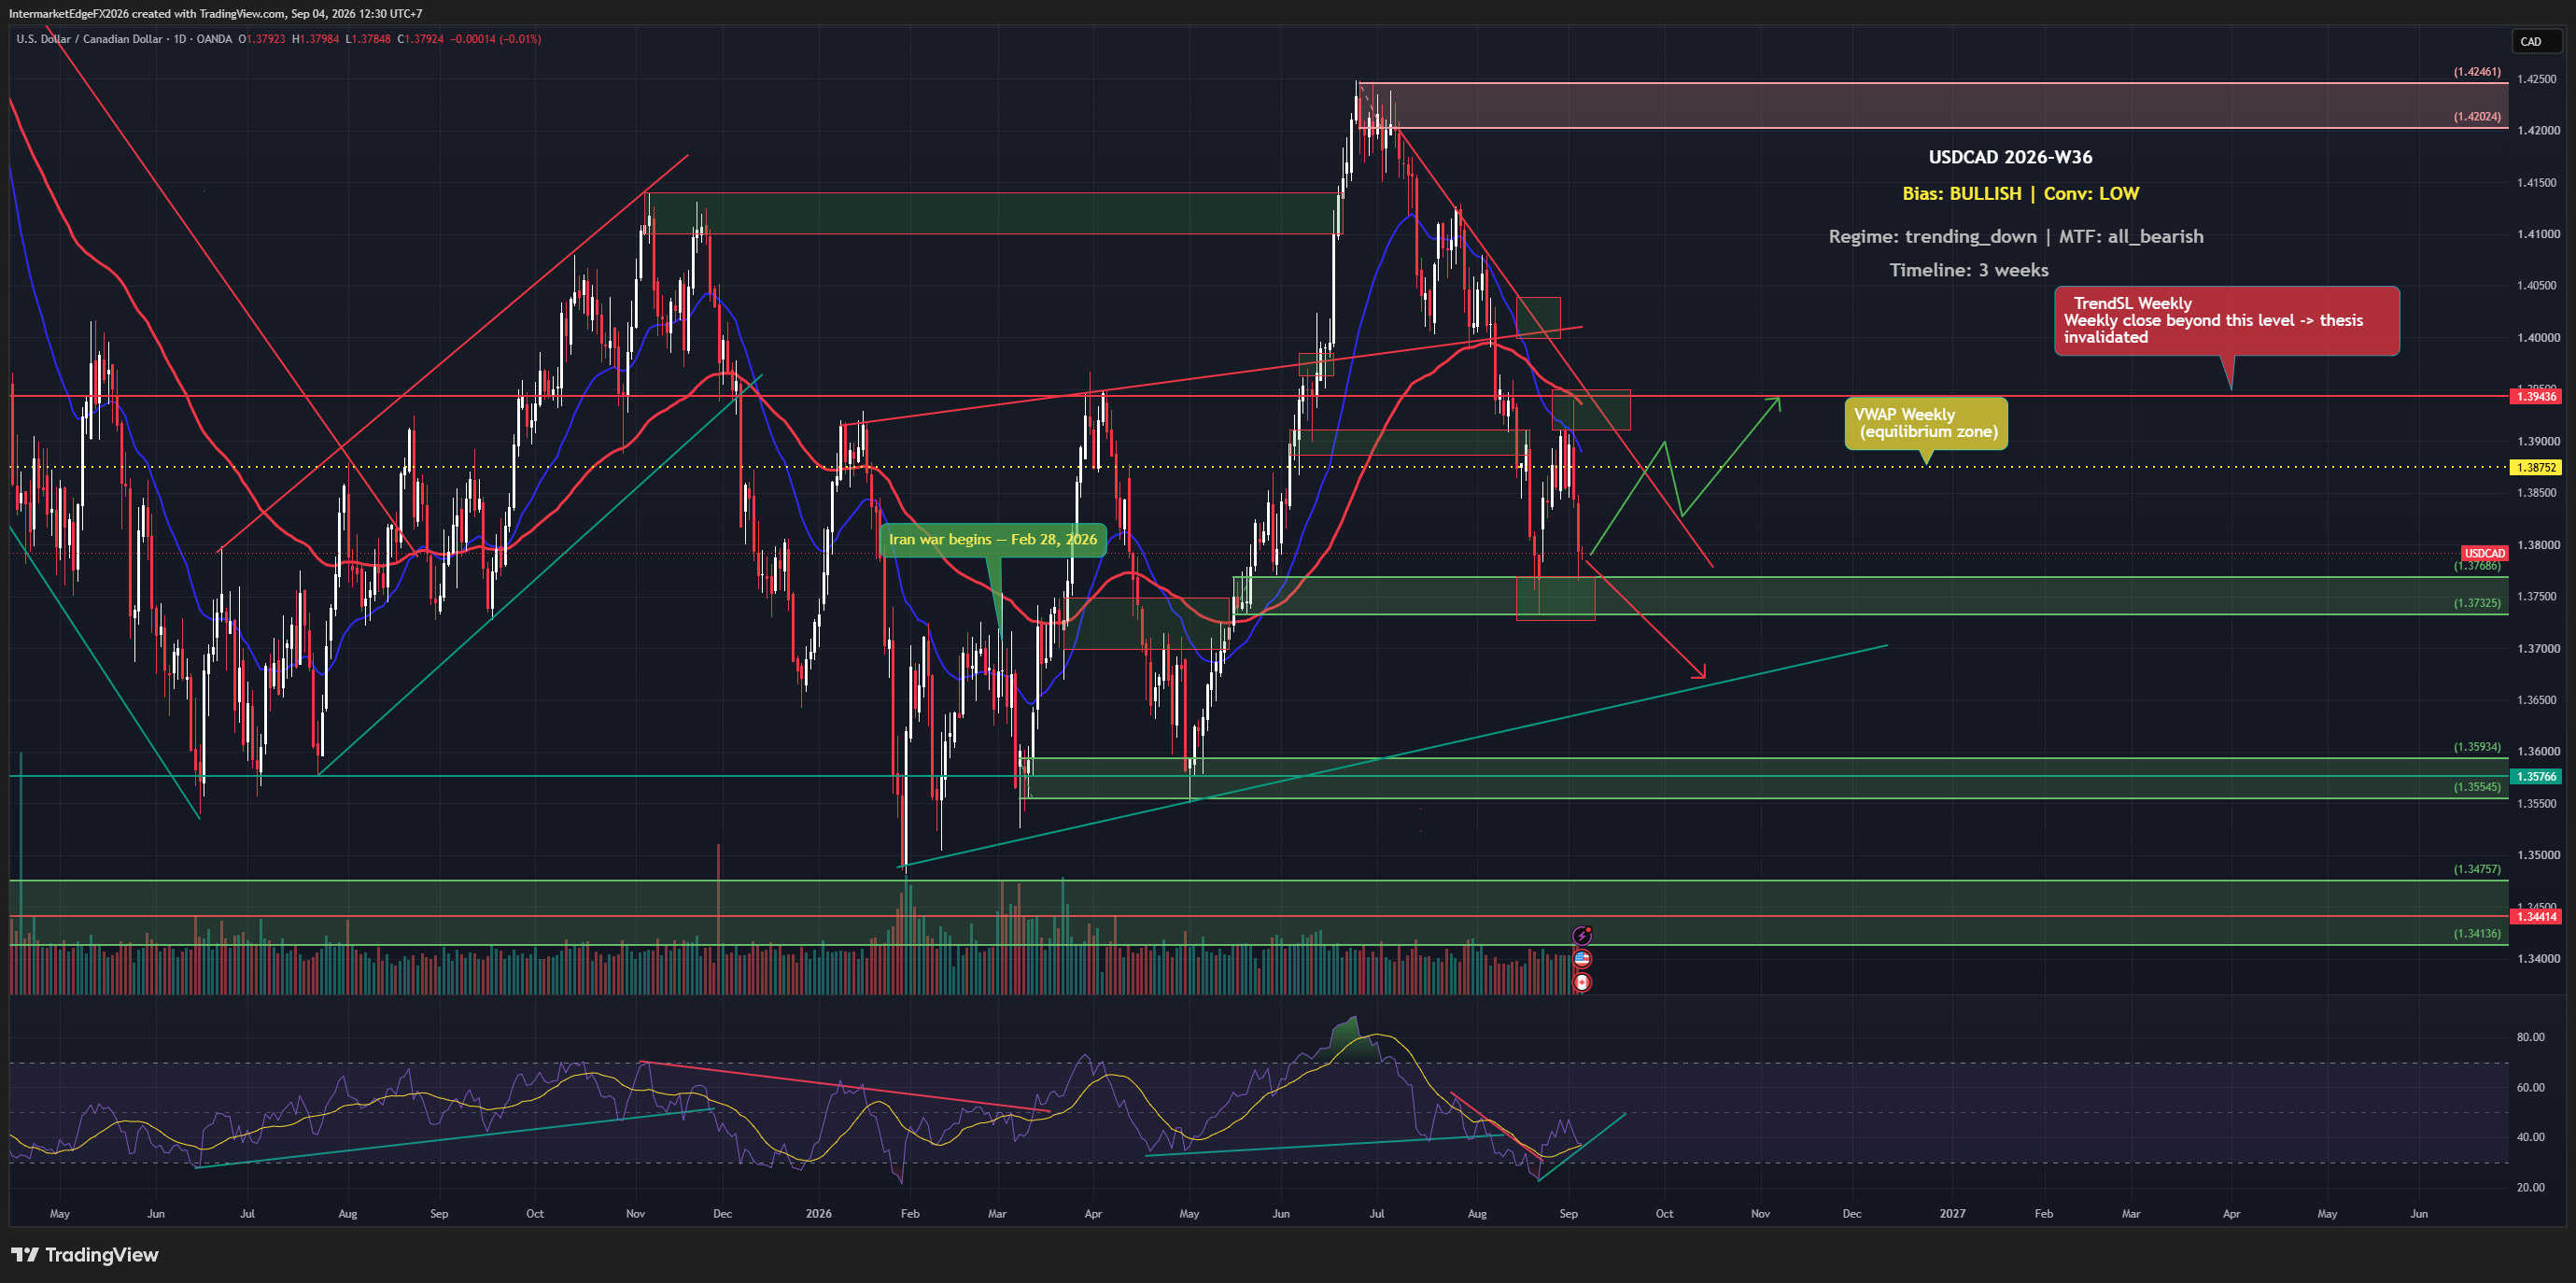
The Bank of Canada just signaled that persistent inflation could force multiple rate hikes, which on paper is a CAD-positive and USDCAD-negative catalyst. Yet as of Friday, 04 September 2026, the pair sits at 1.37896, below both its weekly VWAP and its trend stop-loss level, and the Canadian dollar actually strengthened in the latest session. When a hawkish central bank warning fails to lift the pair, that divergence between narrative and price deserves serious attention before any directional bet is sized. The directional call on USDCAD for this three-week window is bullish, anchored on two structural pillars: the Fed's hawkish posture lifting real yields and widening the rate differential against the BoC, and a COT positioning lean that tilts modestly in the dollar's favor. When the Fed keeps real yields elevated while the BoC sits on hold, the carry dynamic, the return earned by holding the higher-yielding currency, funded by selling the lower-yielding one, mechanically favors USD. That logic is coherent and consistent with past USDCAD behavior during Fed-BoC divergence cycles. The problem is that conviction here is deliberately low, and for reasons that go beyond a single data point. Two of the five analytical pillars, liquidity conditions and market sentiment, produced no usable signal this week. That silence does not mean those factors are neutral; it means the evidence base is incomplete, and sizing a position on three pillars when two are dark is a different risk than sizing on five. More critically, the price itself is already contradicting the thesis at its foundation: at 1.37896, USDCAD is trading below the weekly VWAP at 1.38752 and below the weekly trend stop-loss at 1.39429, meaning the technical structure does not support the bullish label, it actively contradicts it. The bullish bias reflects a macro and positioning overlay, not a technically confirmed setup. -- Intermarket Edge (Note: COT (Commitment of Traders) data is released weekly by the CFTC

XAUUSD Weekly Outlook: Hawkish Shock, Unconfirmed Bull Case

XAUUSD Weekly Outlook: Hawkish Shock, Unconfirmed Bull Case

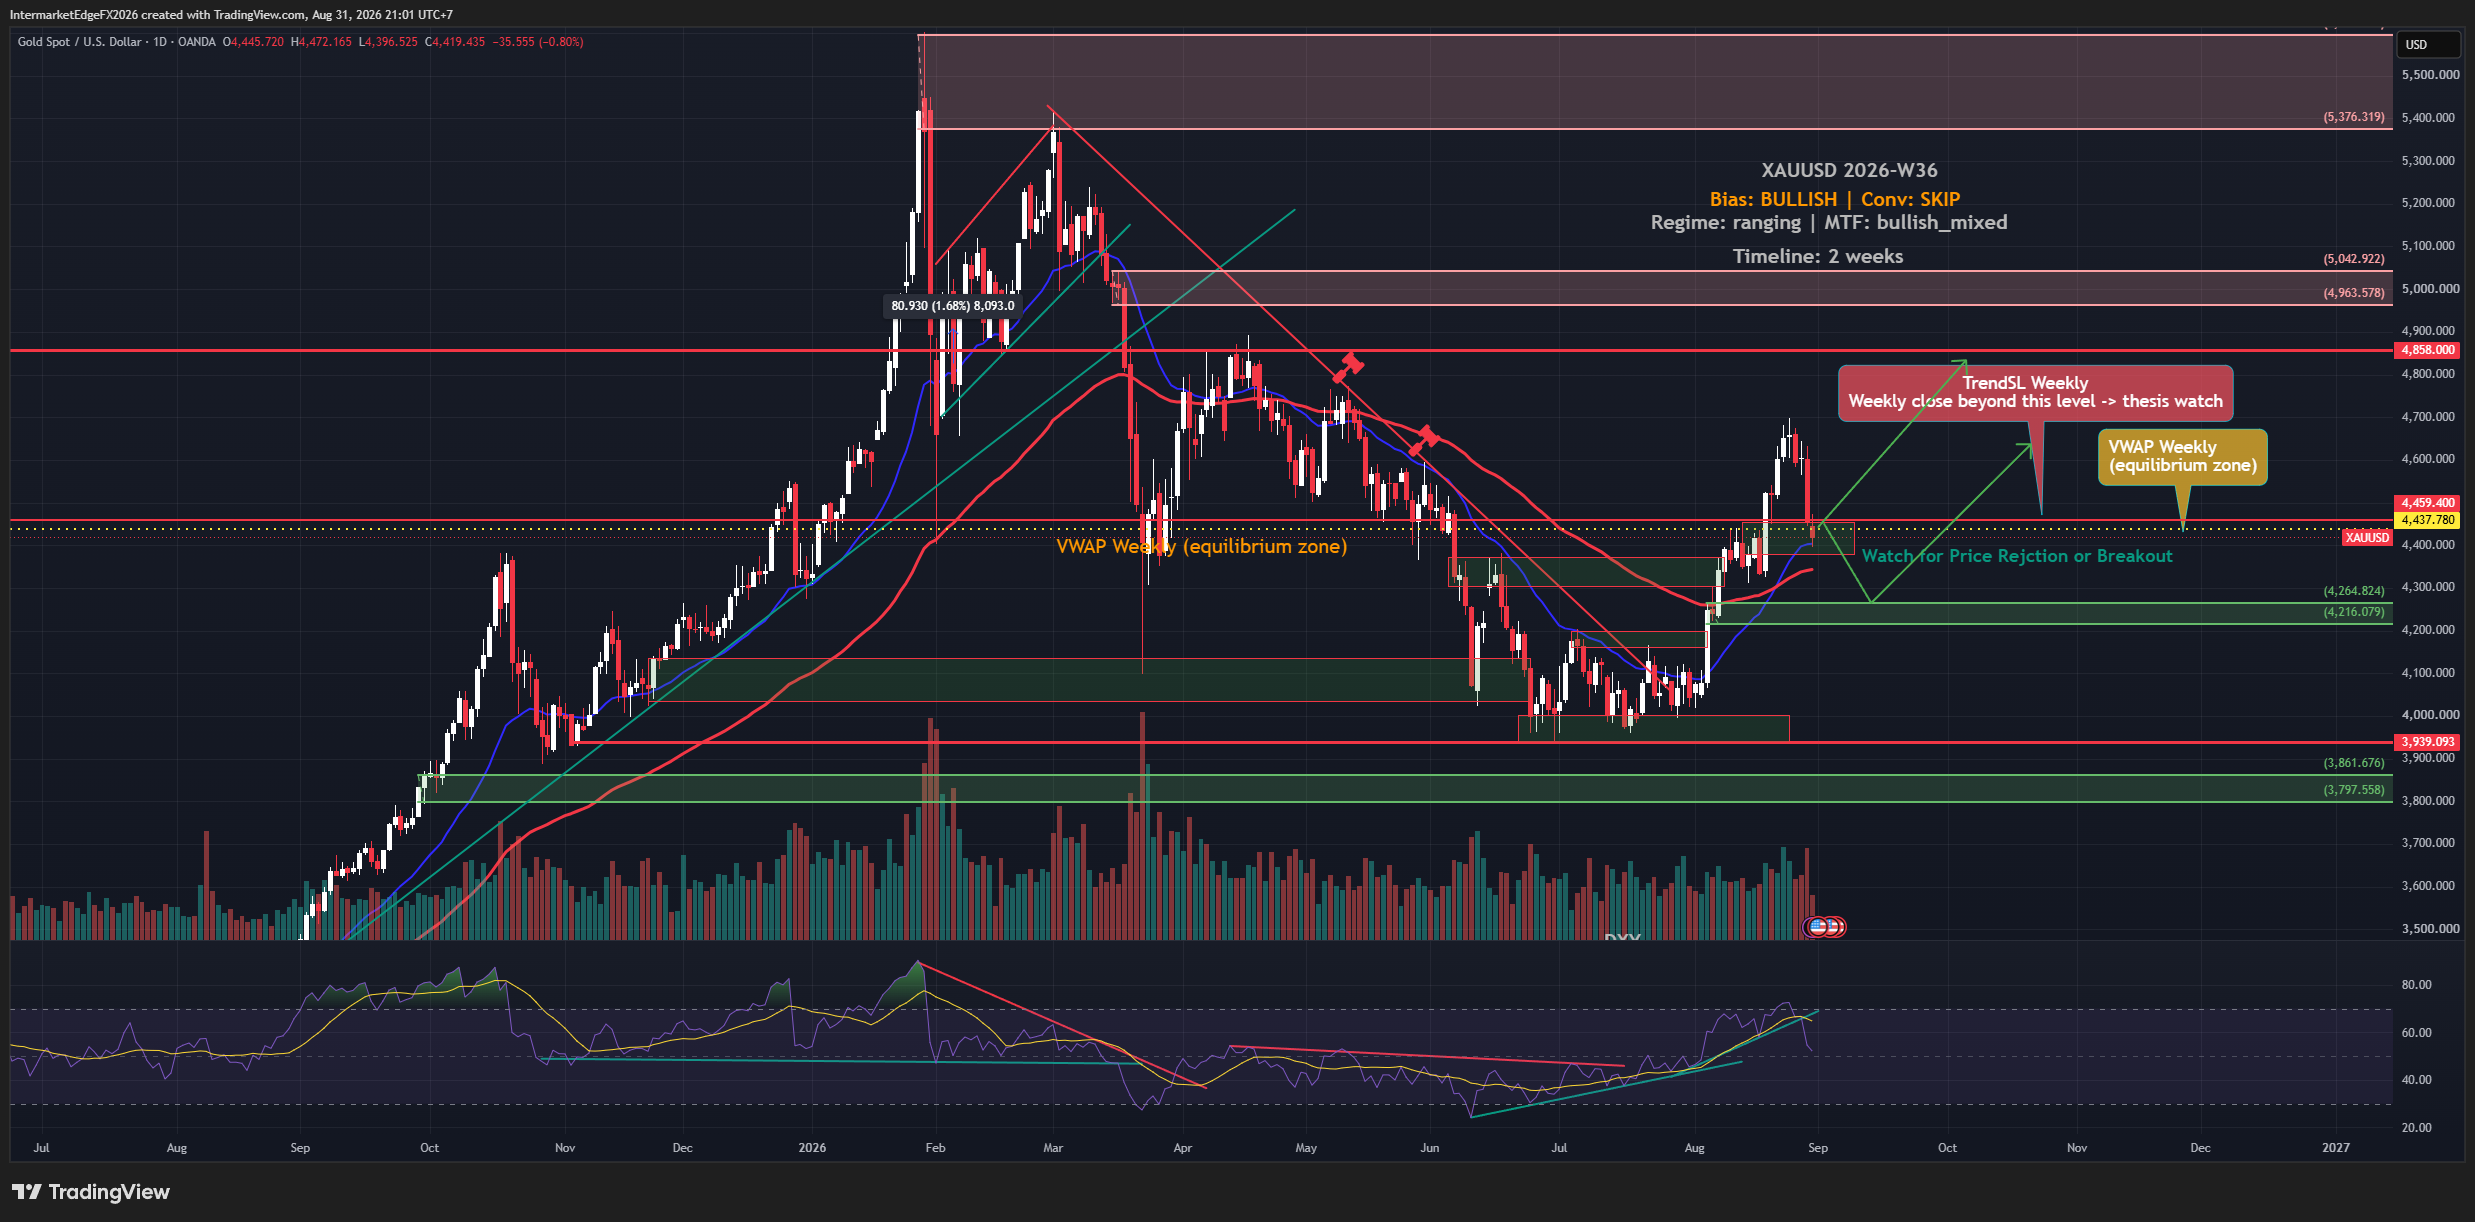
Gold fell more than 3% in a single session after Fed Chair Kevin Warsh signaled further rate hikes if inflation does not clearly return toward 2%, lifting September hike probability from roughly 36% to around 62%. Yet despite that sharp Friday selloff, spot gold near 4,448 dollars remained on course for its strongest monthly gain since January. That contradiction, brutal single-session damage inside a bullish monthly trend, is exactly the kind of setup where traders read the direction right and still get hurt. The framework labels XAUUSD bullish for the two-week window, but deliberately attaches a stand-aside posture to that label, meaning the evidence is not convincing enough to size a position, and that is a considered analytical conclusion rather than an absence of a view. Understanding why that gap exists between the directional label and the action status is the practical takeaway. Price signals, the inputs the analysis weighs most heavily for direction, lean bullish. But the COT data through August 25 showed managed money net long 144,747 COMEX gold contracts, up 3,099 from the prior week. It is worth noting that this COT reading predates Friday's sharp selloff, so the actual positioning picture after that session is unknown and must be treated as lagged. Even before accounting for that lag, the level itself is a crowding risk: when speculative longs are already concentrated at an extreme, the question becomes who is left to push price higher, and the answer often determines whether a bullish thesis accelerates or reverses violently on any negative catalyst. That COT reading conflicts directly with the bullish price signals, and the framework flags this openly rather than resolving the conflict artificially. -- Intermarket Edge (Note: COT (Commitment of Traders) data is released weekly by the CFTC with a reporting-period lag -- it is not a real-time position feed. See cftc.gov for the exact release schedule.)

USDCAD: Bullish Macro Label Meets a Bearish Price Structure

USDCAD: Bullish Macro Label Meets a Bearish Price Structure

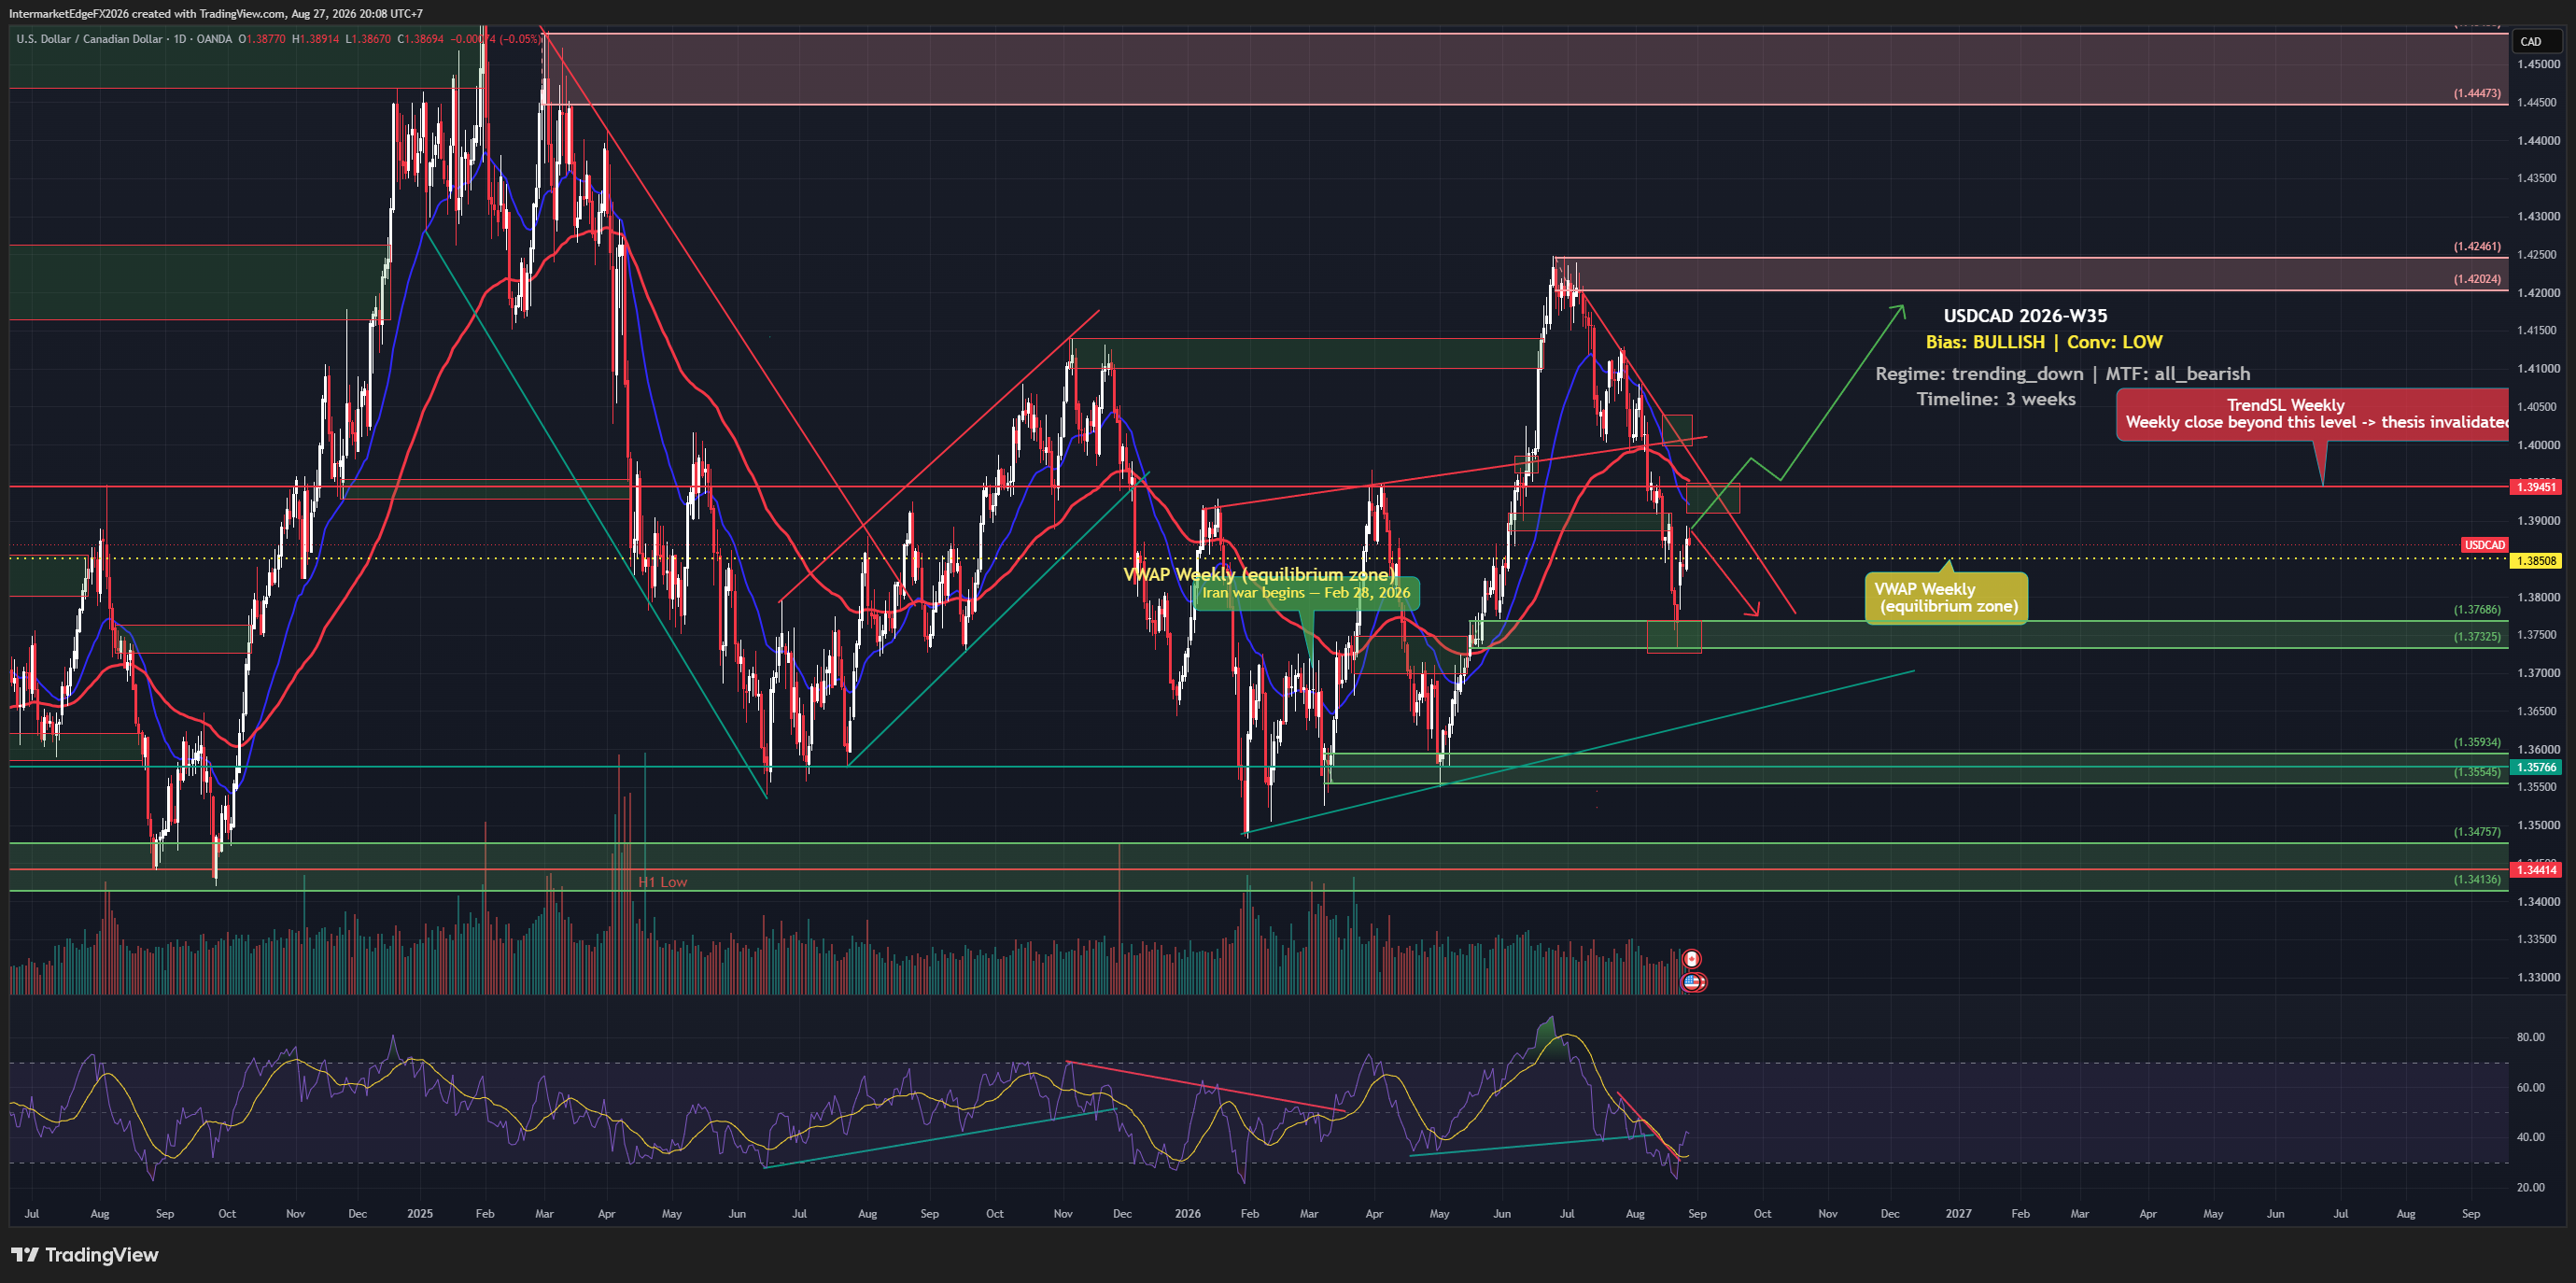
USDCAD is carrying a bullish bias into the final stretch of August 2026, but the pair is trading nearly 63 pips below the weekly TrendSL of 1.39451 as of Thursday, 27 August, meaning the technical structure does not yet support the label it has been given. The Canadian dollar hit a one-week low as a revived trade dispute rekindled economic worries, yet retaliatory tariffs from Canada quickly clawed some of that move back. That push-pull dynamic is precisely the kind of environment where calling a direction early is far easier than timing it correctly. The bullish thesis on USDCAD rests on a causal chain that begins at the Fed: sustained hawkishness has pushed US real yields to 2.32%, which supports dollar demand globally and feeds directly into USDCAD through the rate differential with the Bank of Canada. COT positioning data adds a secondary layer of confirmation, with commercial and speculative data skewing toward USD strength, though the brief does not specify the report week, net-position figure, or sample window, so this should be read as directional corroboration rather than a standalone signal. Macro and positioning therefore rhyme. What they do not resolve is the technical picture. This is where the thesis becomes genuinely complicated. At the time of writing, price at 1.38829 is already below the TrendSL weekly of 1.39451, and that condition was true from the moment the thesis was generated, not something that developed afterward. A bullish bias with price testing from underneath a declining trend stop-loss line is a structural contradiction: the same framework that produces the bullish label is simultaneously flagging that the technical evidence does not support it yet. The conviction level is accordingly low, and that is not a minor disclaimer, it is the honest read of a setup where macro and price structure are pointing in opposite directions. -- Intermarket Edge

Stay in the loop

Get notified about new research, macro insights, and market analysis.

InterMarketEdge

© 2026 InterMarketEdge. Financial intelligence for inter-market traders.