Tag: Commodity — InterMarketEdge

Tag: Commodity

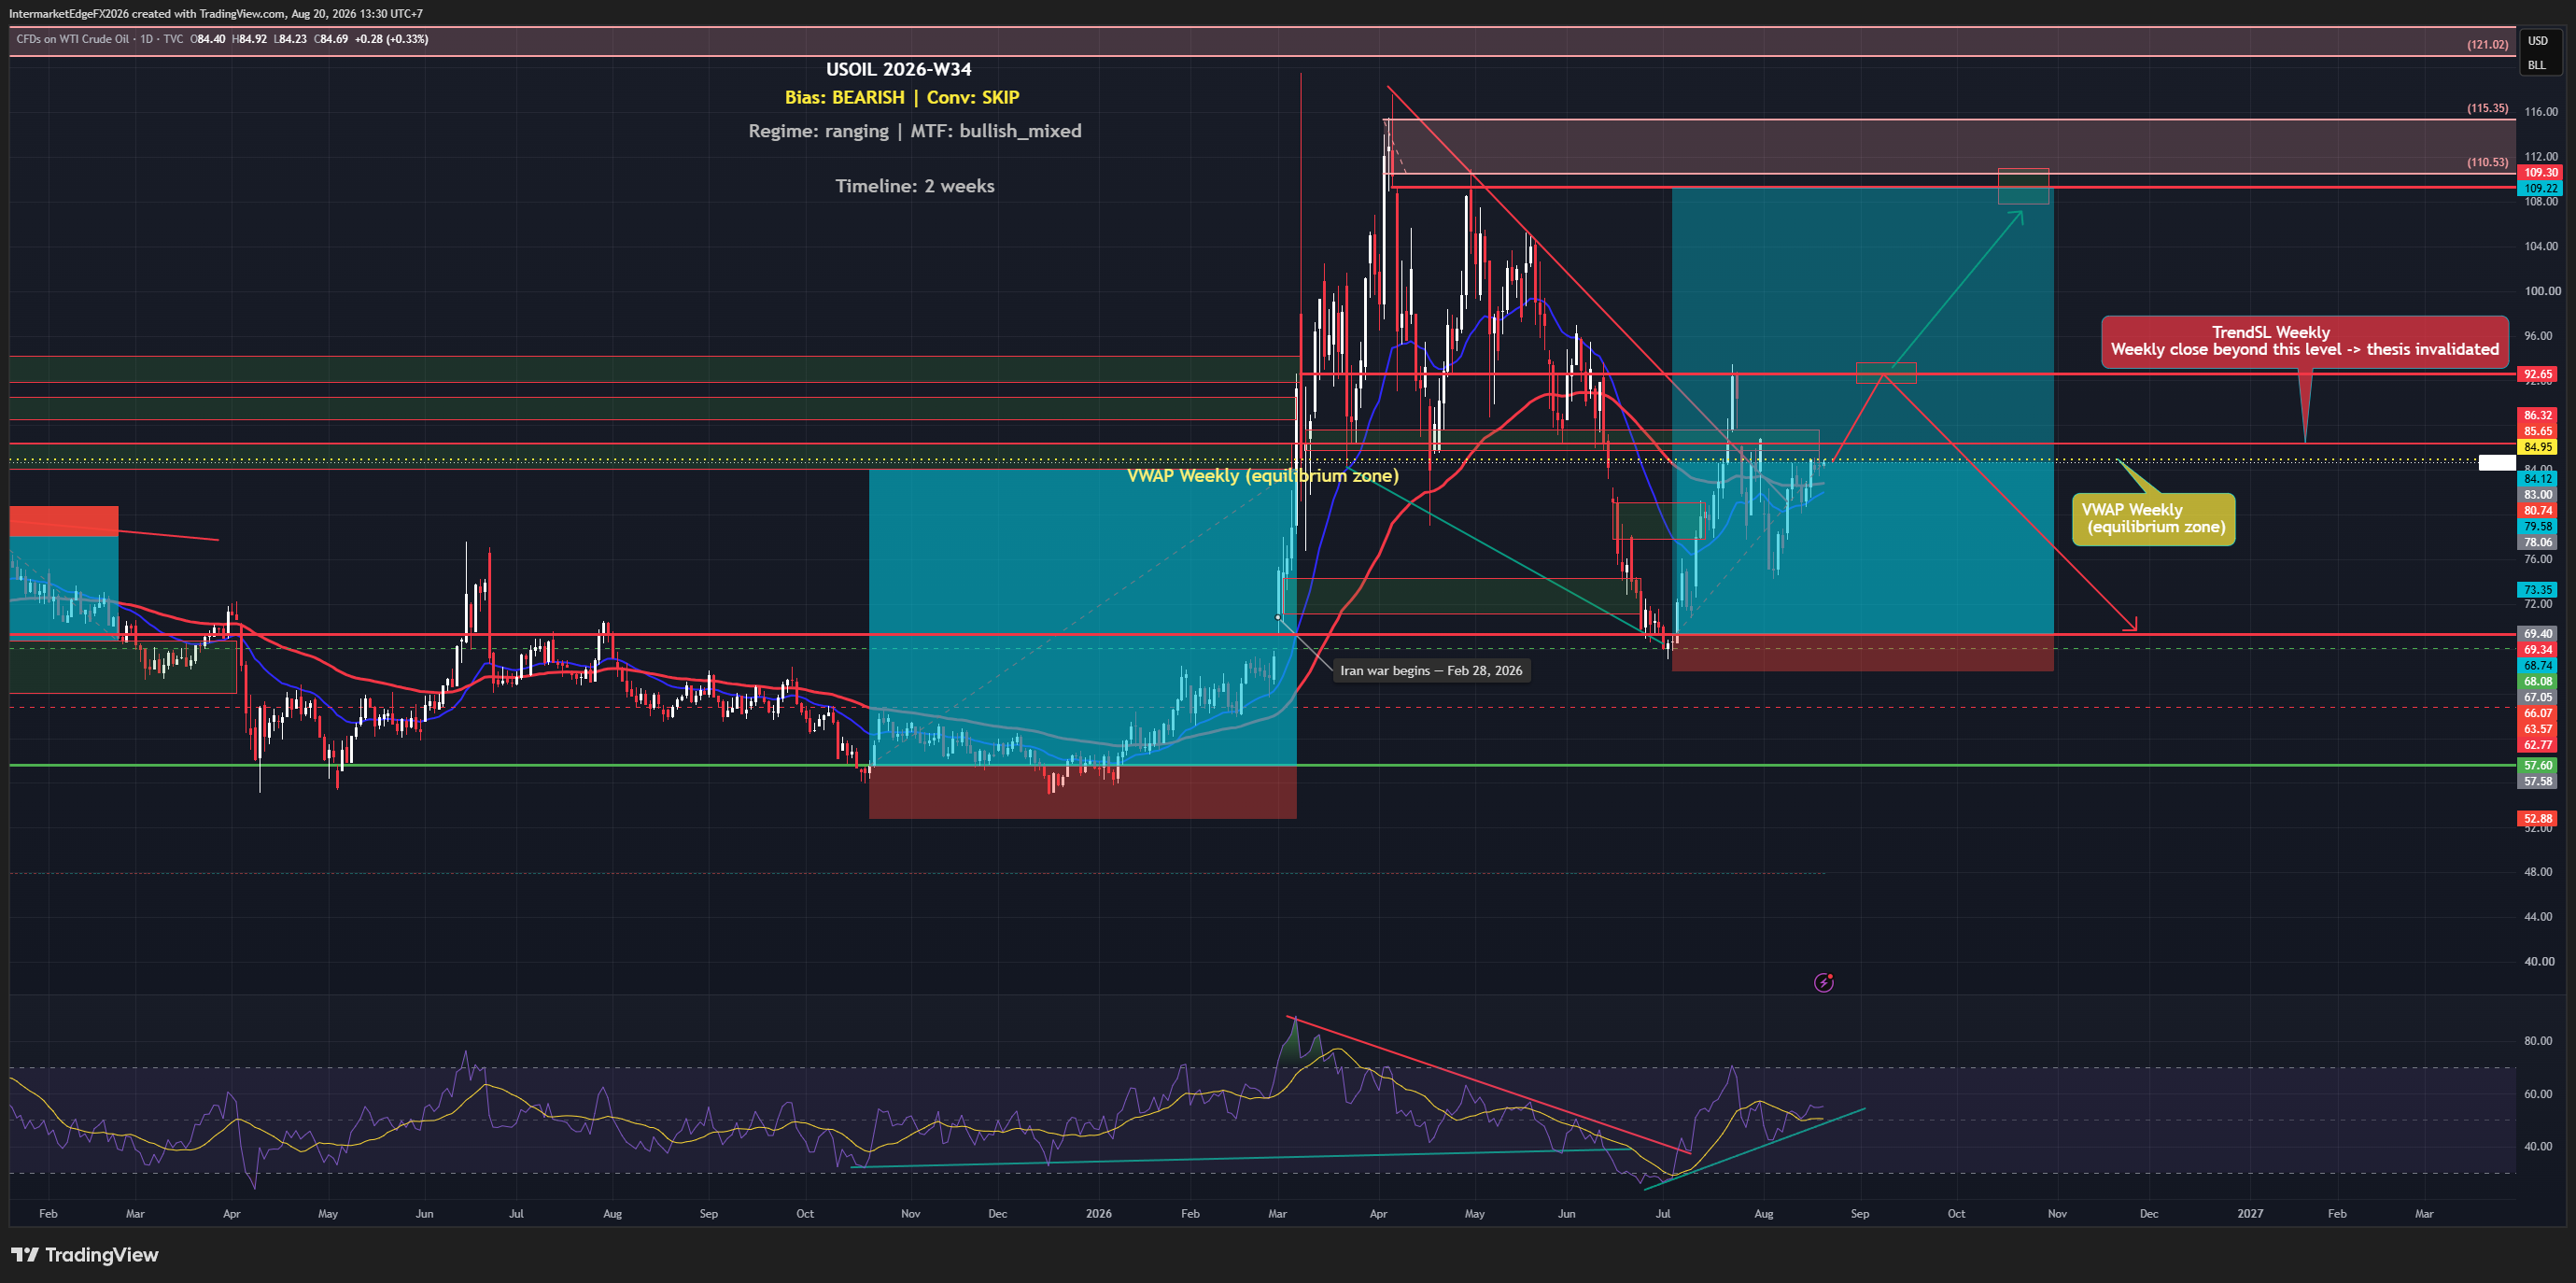
USOIL - Five Consecutive Weekly Draws and Price Keeps Falling: When the Market Ignores Inventory, the Supply Narrative Is Winning Absolutely

USOIL - Five Consecutive Weekly Draws and Price Keeps Falling: When the Market Ignores Inventory, the Supply Narrative Is Winning Absolutely

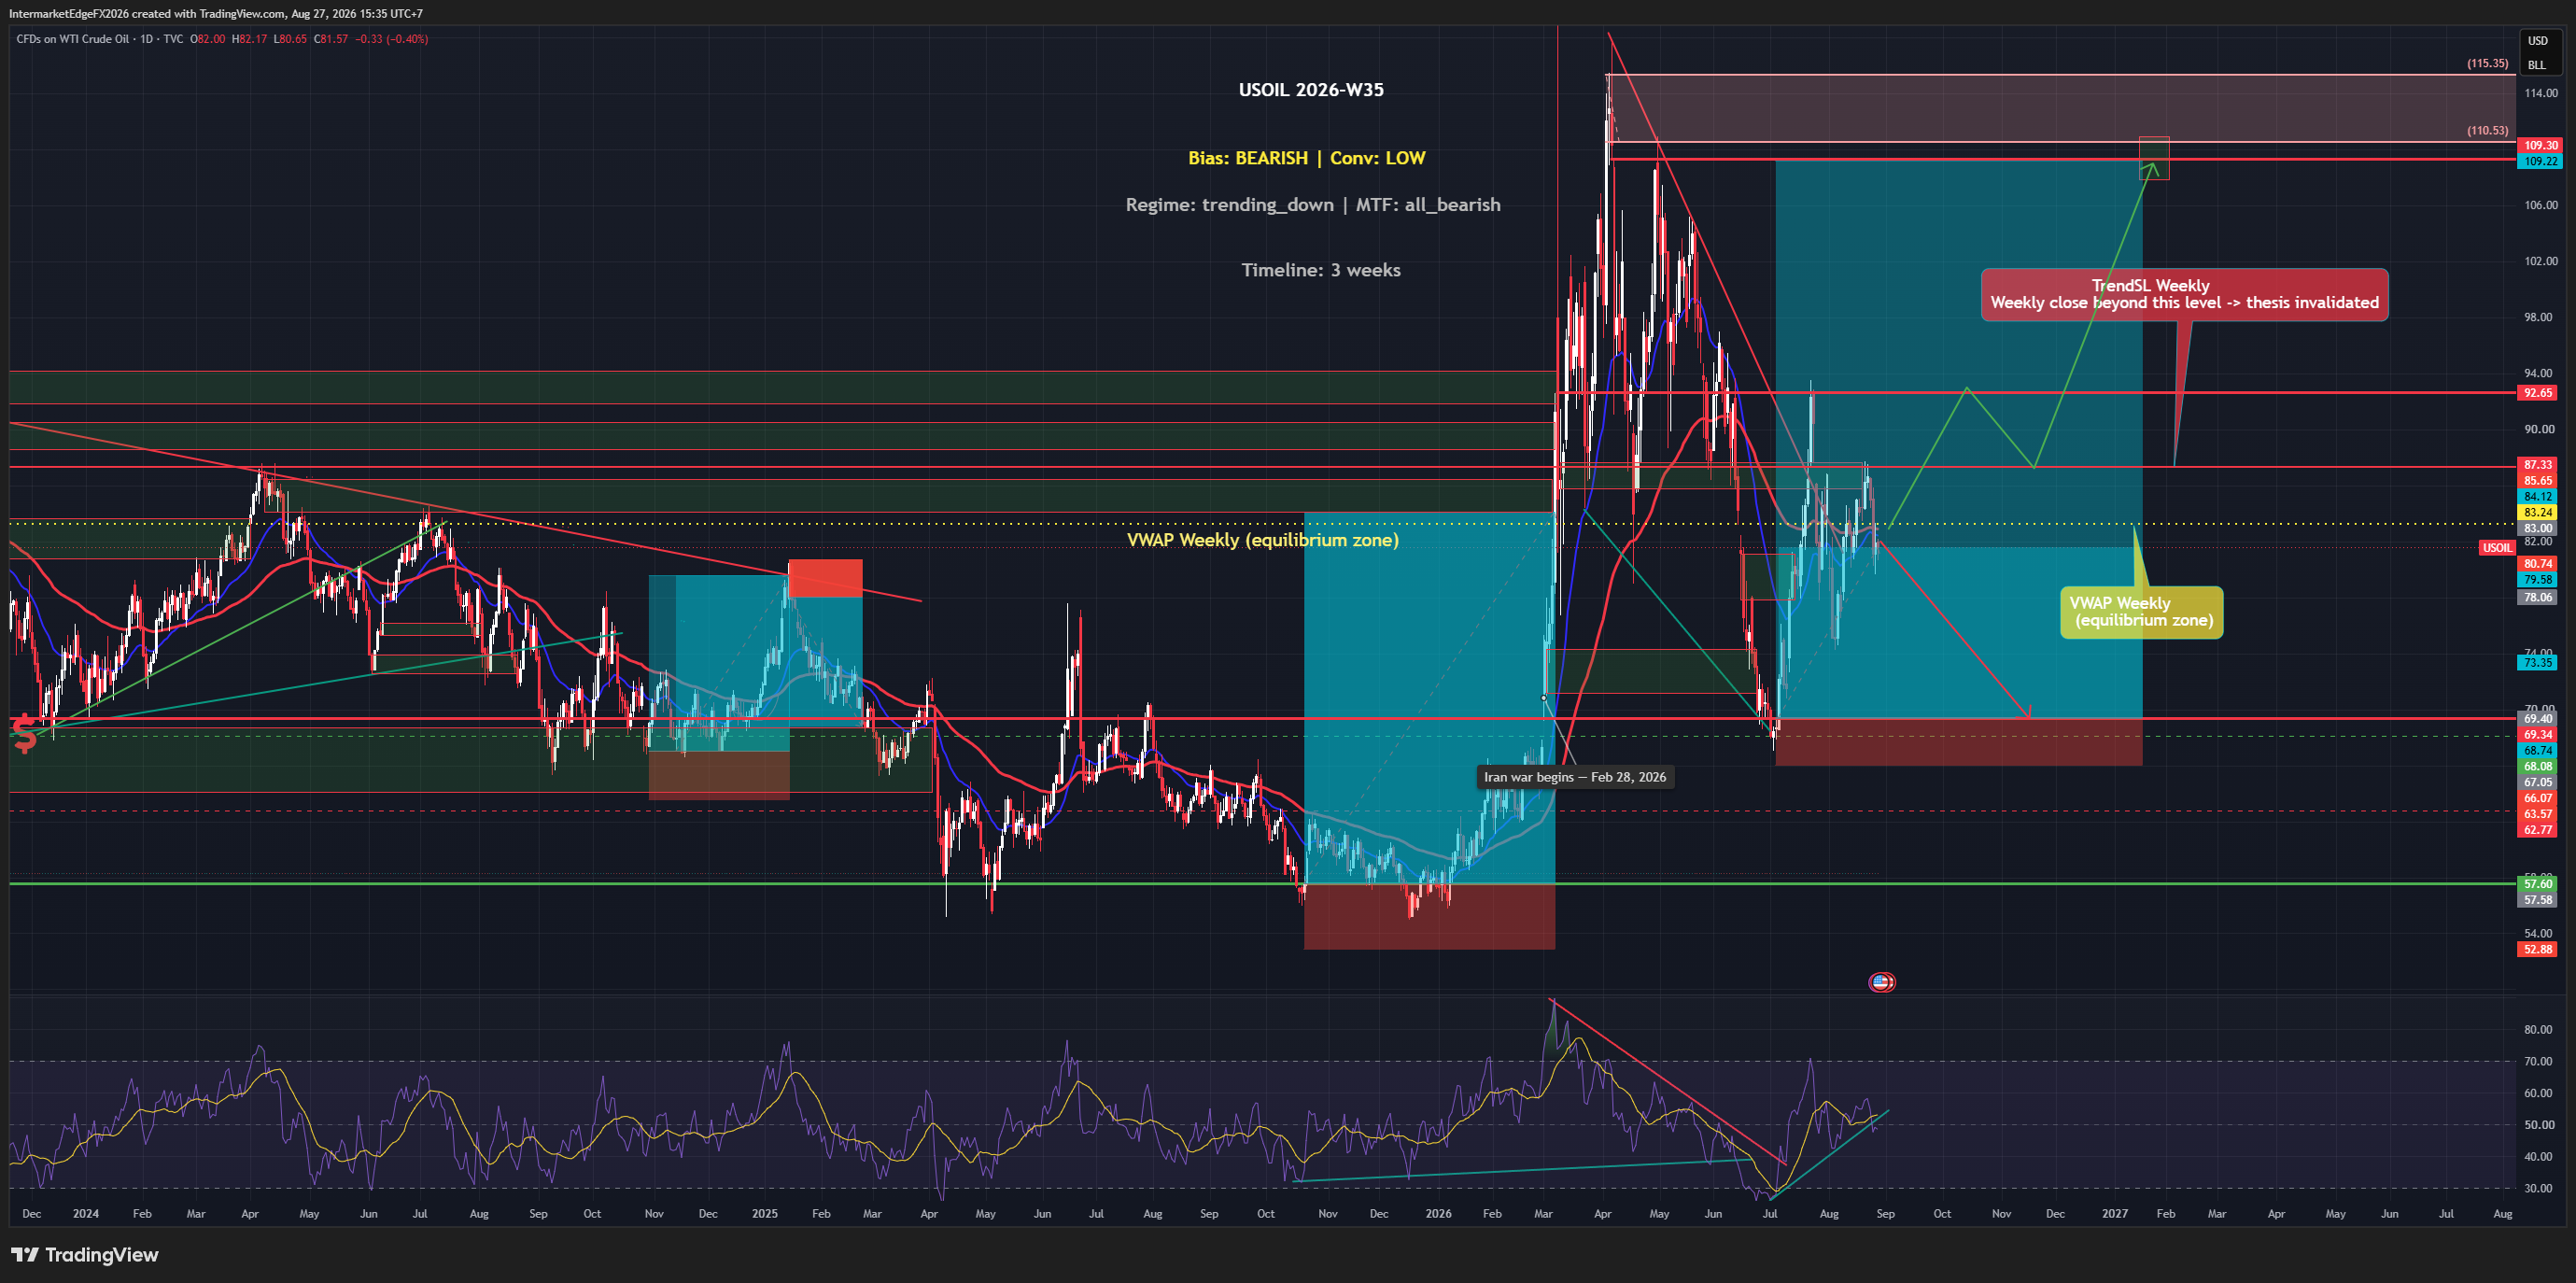
USOIL - SUMMARY 02/07/2026 Regime: High Bear Continues, Supply Narrative in Total Control. USOIL 67.85 (-0.34%), the 67 target from last week's analysis has been hit. Falling channel from the 117.50 war peak remains intact. Bias: High Bear. Core story: 5 consecutive weekly EIA draws totalling -33.3M barrels (1 July: -3.775M vs forecast -2.900M) -- the strongest destocking sequence this year -- and price still fell from 75 to 67.85. When a market ignores the most bullish data available, bulls have lost control. The strongest behavioural bearish signal that exists. Supply narrative: OPEC+ +411kbpd from June, Hormuz flows recovered (OCBC + UBS both cut forecasts), Iran-US talks progressing -- each round another leg lower. Data corrections: EIA -3.775M released (pipeline "awaiting" stale); CPI 4.2% (not 2.4%); real yield +0.28%. D1 structure: 69.34-73.35 support broken. Resistance: 69.34 / 73.35 (channel invalidation). Targets: 63.57 → 62.77 → 57.60 (major support Q4 2025 base -- where OPEC+ fiscal pressure peaks, production-cut intervention likely). Extension: 52.88. Scenarios: downtrend continues to 63.57 (50%); extends to 57.60 (25%); oversold bounce 69-73 then resumes (15%); Iran talks collapse, breakout 73-85 (10%). Event risk: NFP 3 July, EIA 8 July (sixth draw?), OPEC+ communique, Iran talks wildcard. Stops for shorts: above 69.34. For informational purposes only. Not financial advice.

EURJPY - Head & Shoulders Confirmed, DE-JP Spread Collapses to 0.25%, Neckline 181 Is the Trigger for Targets at 177 and 171

EURJPY - Head & Shoulders Confirmed, DE-JP Spread Collapses to 0.25%, Neckline 181 Is the Trigger for Targets at 177 and 171

EURJPY - SUMMARY 01/07/2026 Regime: H&S Confirmed, High Bear. EURJPY 185.058 (-0.35%), Right Shoulder 186.547 rejected, price declining toward neckline 181.018-181.047. Bias: High Bear. Most critical correction: actual DE-JP spread +0.25% (not pipeline's 1.52%). JP10Y 2.70% (not 1.47%), DE10Y 2.95% (not 2.99%). BoJ already hiked to 1.00% (not "Hold"). ECB neutral hold 2.00% (not cutting 2.50%). EUR/JPY carry trade has economically collapsed. Three high-conviction factors: carry collapsed to +0.25%, H&S complete (Head 188.012 / Right Shoulder 186.547 / Neckline 181.018), BoJ hawkish + June TANKAN support today. H&S measured target: neckline 181 → 177 (also Fib 1.618 extension -- confluence). Further support: 175.0-175.5. Invalidation: daily close above 186.547. Scenarios: neckline 181 breaks, wave (c) to 177 (55%); sideways 183-186 (25%); NFP bounce 186-187 then continues (15%); recovery above 186.547 (5%). Do not chase short before neckline 181 breaks. For informational purposes only. Not financial advice.

USDJPY - Wave (5) Exhaustion Confirmed as Price Failed to Break 161.94 for an Entire Week, Tokyo CPI Beat Gives the BoJ More Ammunition

USDJPY - Wave (5) Exhaustion Confirmed as Price Failed to Break 161.94 for an Entire Week, Tokyo CPI Beat Gives the BoJ More Ammunition

USDJPY 161.651 | Wave (5) exhaustion confirmed, Tokyo CPI beats | 26 June 2026 Last week: "Wave (5) exhaustion at the intervention ceiling, expect correction to 155-157." One week later: price stood at 161.6, unable to break 161.94 despite DXY at a 13-month high. Exhaustion is no longer speculation. Then Tokyo CPI June released today. Core-core 1.9% y/y, beat 1.8% forecast, up from 1.6%. The BoJ has fresh ammunition to hike again. Yen-supportive. DXY pulled back from 101.5 to 100.6. VIX jumped to 20.20 (+7.1%). Risk-off intensifying, carry-unwind pressure. Pipeline showed wrong numbers. JP10Y: 1.47% (actual 2.600%). US-JP spread: 2.924% (actual 1.790%). BoJ: "Hold" (actual: hiked to 1.00%). D1 structure: wave (5) at the 161.94 ceiling, failed to break after one full week. Correction targets: 158.953 (0.382), 155.244 (0.5), 153.5 (0.618). Extension if breaks 161.94: 164. Invalidation: below 152. Three scenarios: → Correction (a)(b)(c) to 155-157. Probability: 40% → MOF intervention, sharp drop to 155 then 152. Probability: 25% → DXY bounces, breaks 161.94, extension to 164. Probability: 20% The tell: one week at the ceiling, it didn't break. Then the BoJ's data came in hot. Exhaustion confirmed. Conviction: Medium Bear near-term (shifted from Med Bull correction lean). --- Intermarket Edge | Institutional Macro & Intermarket Analysis For informational purposes only. Not financial advice.

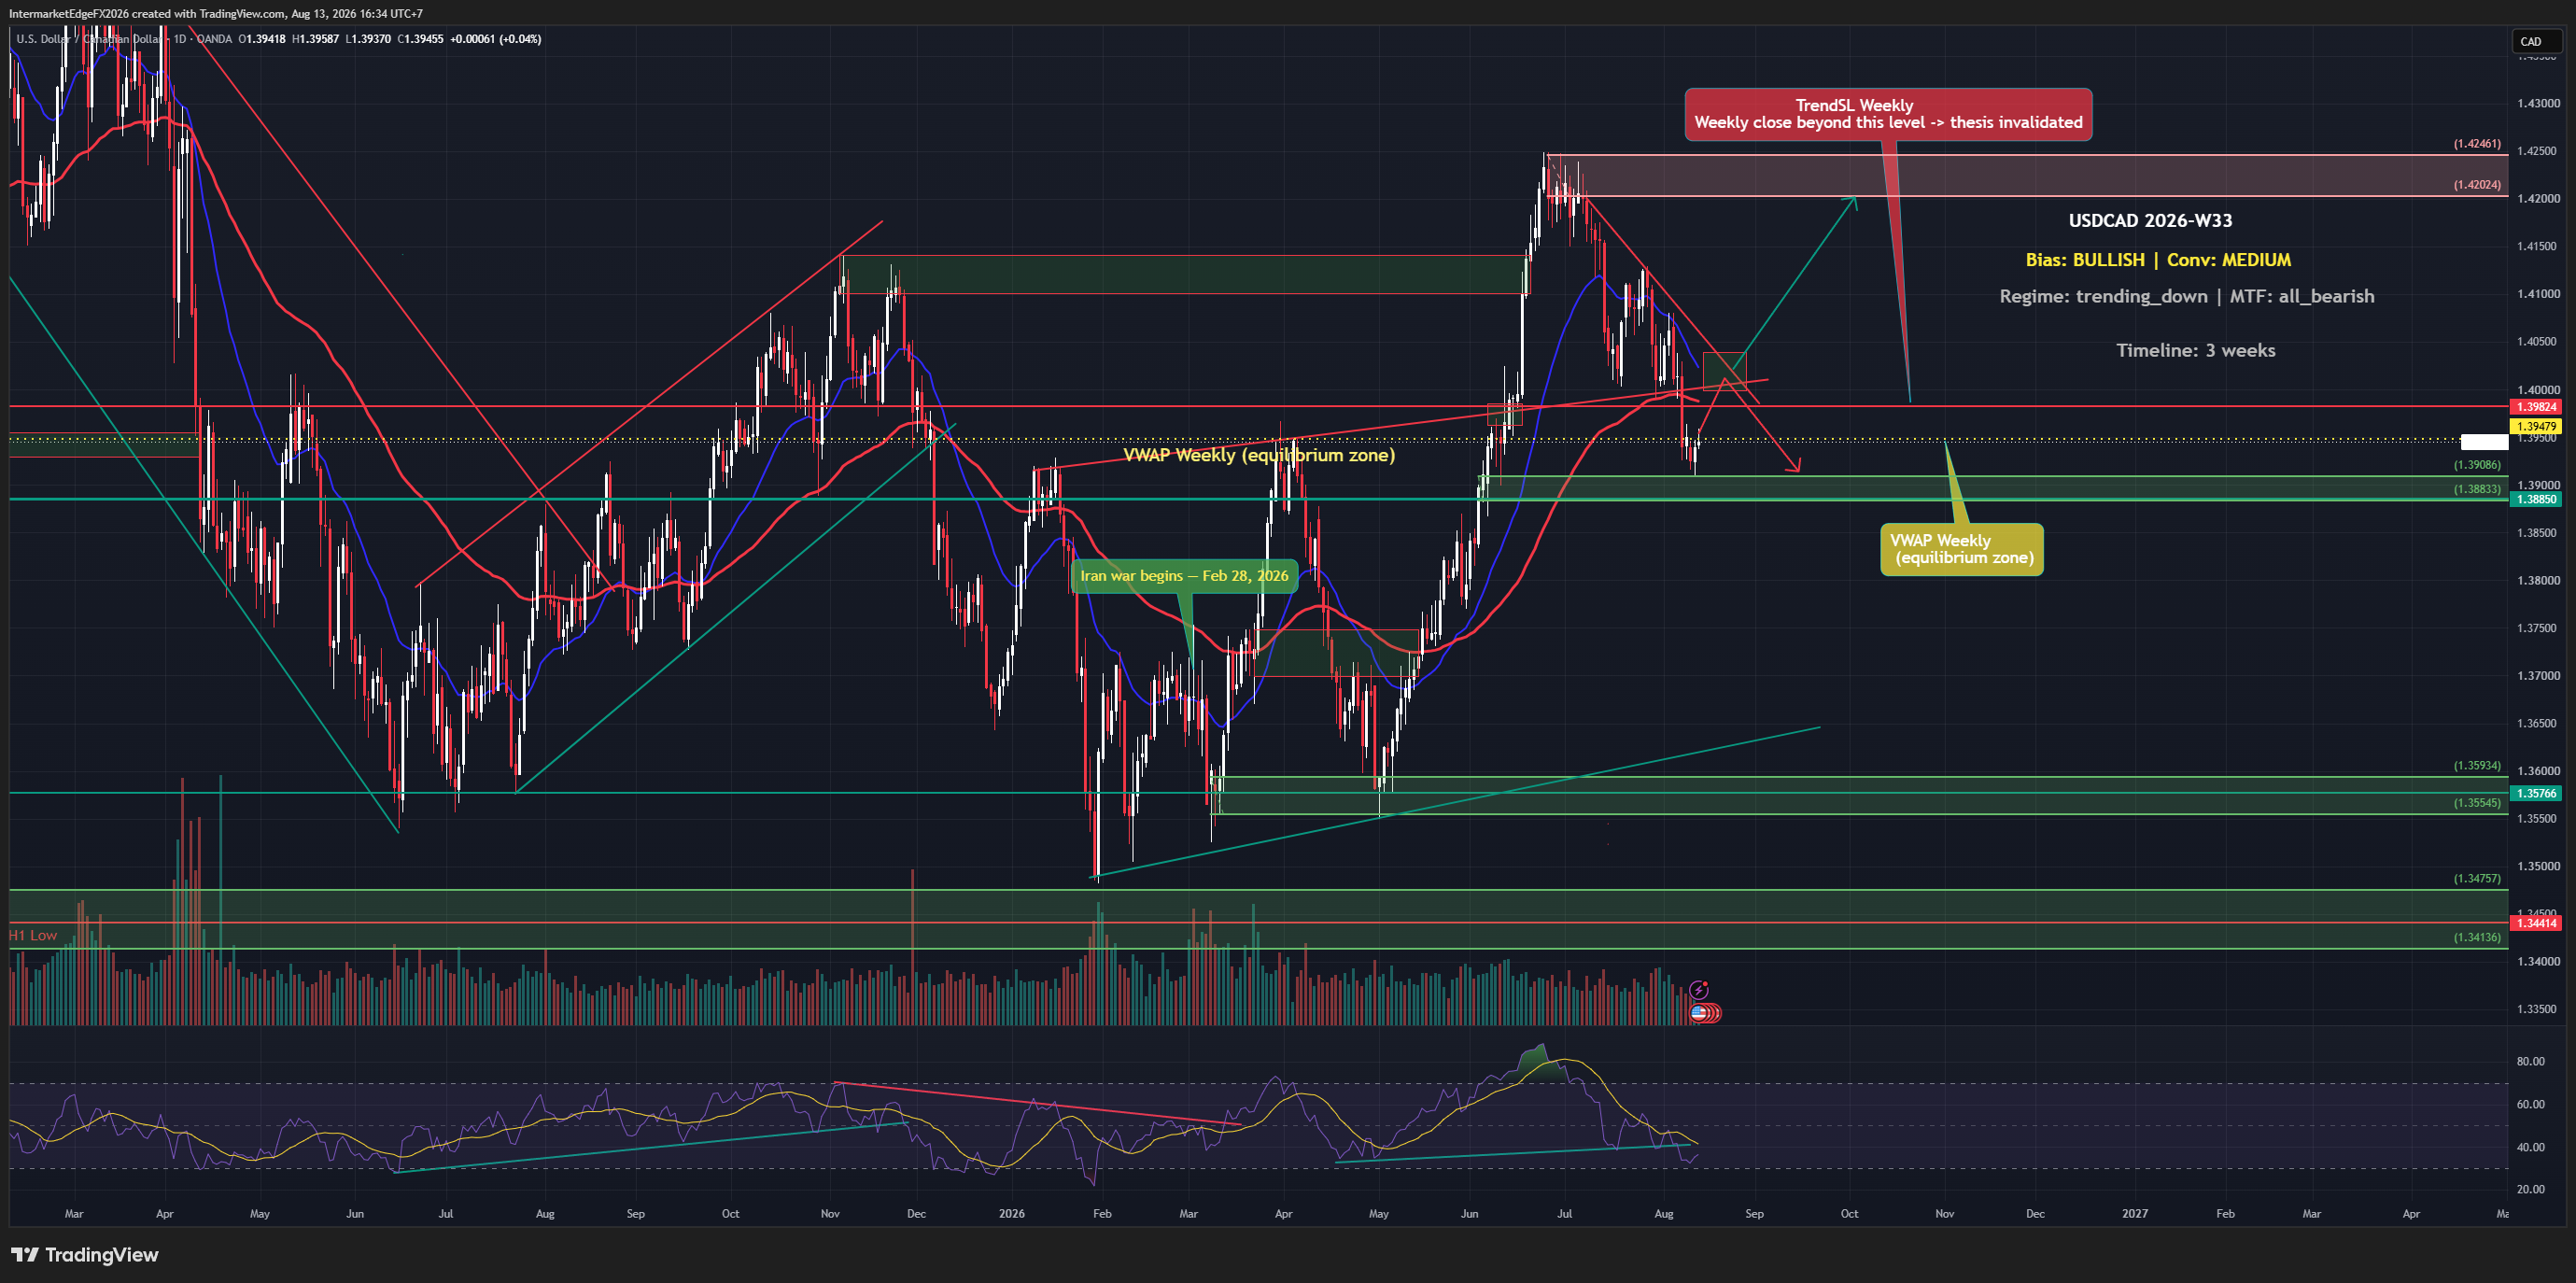
USDCAD - CAD Hits a 14-Month Low as Oil Breaks Below $70 and DXY Holds a 13-Month High, a Double Squeeze Drives Wave (3) Toward 1.4447

USDCAD - CAD Hits a 14-Month Low as Oil Breaks Below $70 and DXY Holds a 13-Month High, a Double Squeeze Drives Wave (3) Toward 1.4447

USDCAD 1.4232 | Double squeeze: 13-month DXY high + oil below $70 | 25 June 2026 CAD hits a 14-month low, pressured from both sides simultaneously. USD leg: 13-month high post-hawkish FOMC. CAD leg: oil broke below $70 and the pre-war 71.11 support. When both legs tilt the same way, this is the strongest bullish configuration. BoC Macklem today: not seeing spillovers from higher oil prices into CPI. Implicitly dovish, BoC in no hurry to hike. Canada benchmark yields slipping. CAD at a 14-month low as tech selloff drives safe-haven into USD. AUDUSD at 0.691, broad commodity FX weakness. CAD weakness is not idiosyncratic. D1 structure: wave (3) impulse running. Target 1.4447 then 1.4540. Support 1.4100 then 1.3993. Invalidation: below 1.3476. Three scenarios: → Wave (3) continues to 1.4447 then 1.4540. Probability: 45% → Sub-wave 4 correction to 1.40 then resumes. Probability: 25% → Oil bounces + dovish Fed, drops to 1.39. Probability: 15% The tell: both legs tilting simultaneously. DXY strongest in 13 months, CAD weakest in 14. Not a coincidence. A double squeeze. Conviction: High Bull (upgraded from Med-High). --- Intermarket Edge | Institutional Macro & Intermarket Analysis For informational purposes only. Not financial advice.

EURGBP - The PM Resigned and the Pair Didn't Flinch, a 1.86% Carry Crushes Political Risk at the 0.86110 Support

EURGBP - The PM Resigned and the Pair Didn't Flinch, a 1.86% Carry Crushes Political Risk at the 0.86110 Support

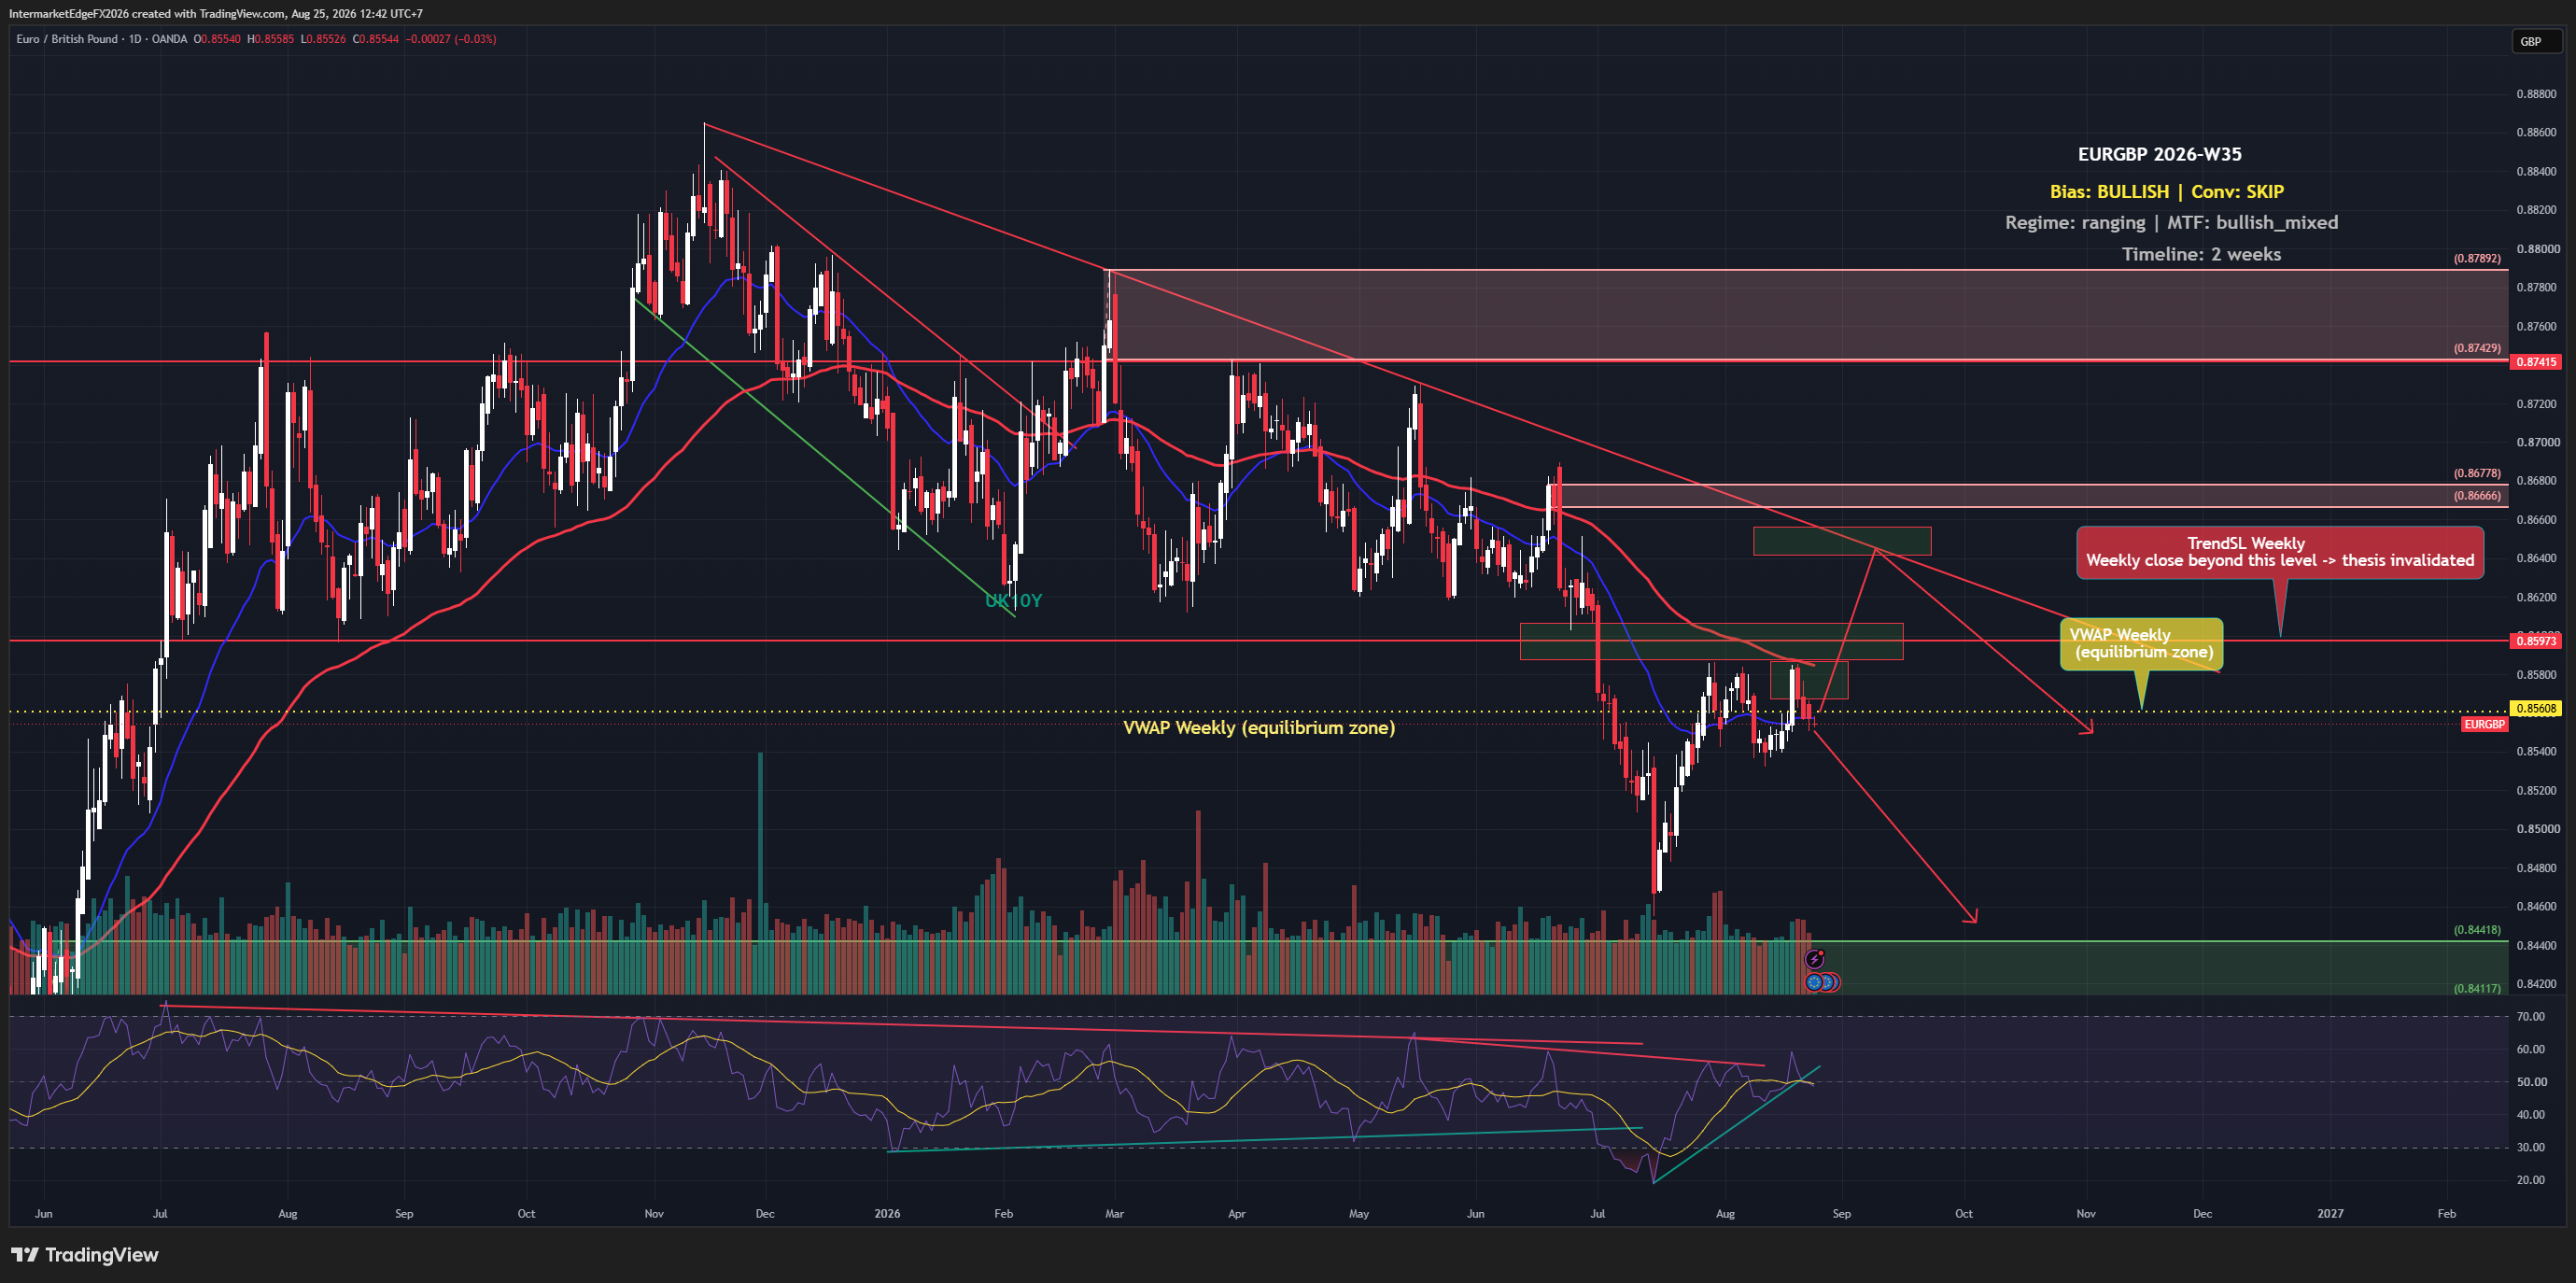
EURGBP 0.8622 | 1.86% carry crushes political risk | 23 June 2026 The UK Prime Minister just resigned. The pound should be weaker. EURGBP should be bouncing. But the pair barely moved, still pinned at the 0.86110 support. This is not an anomaly. This is the strongest bear signal of the week. Carry decides. UK10Y 4.770% above DE10Y 2.910% by 1.860 percentage points. The spread is nearly identical to last week (1.862%). Starmer's exit did not narrow carry, and when a pair doesn't react to a PM-level shock, the structural force is overwhelming. EUR is not strong enough to push it higher either. EURUSD 1.1392 falling. ECB neutral at 2.00%. Lane/Lagarde rhetoric mixed. The pipeline showed wrong numbers. UK10Y: 4.50% (actual 4.770%). DE10Y: 2.99% (actual 2.910%). ECB: 2.50% (actual 2.00%). D1 structure: descending channel intact from the 0.888 top. Wave (c) testing the 0.86110 support. A break opens 0.84418 then 0.84117. Invalidation: 0.87415. Three scenarios: → Break 0.86110, wave (c) to 0.84418 then 0.84117. Probability: 40% → Hold 0.86110, carry pins, range 0.860-0.865. Probability: 25% → Political crisis escalates, UK yields drop, delayed bounce to 0.87415. Probability: 20% The tell: EURGBP didn't react to a PM resignation. The 1.86% carry controls this pair. As long as it holds, the downside has the higher probability. Conviction: Medium-High Bear, increased versus last week. --- Intermarket Edge | Institutional Macro & Intermarket Analysis For informational purposes only. Not financial advice.

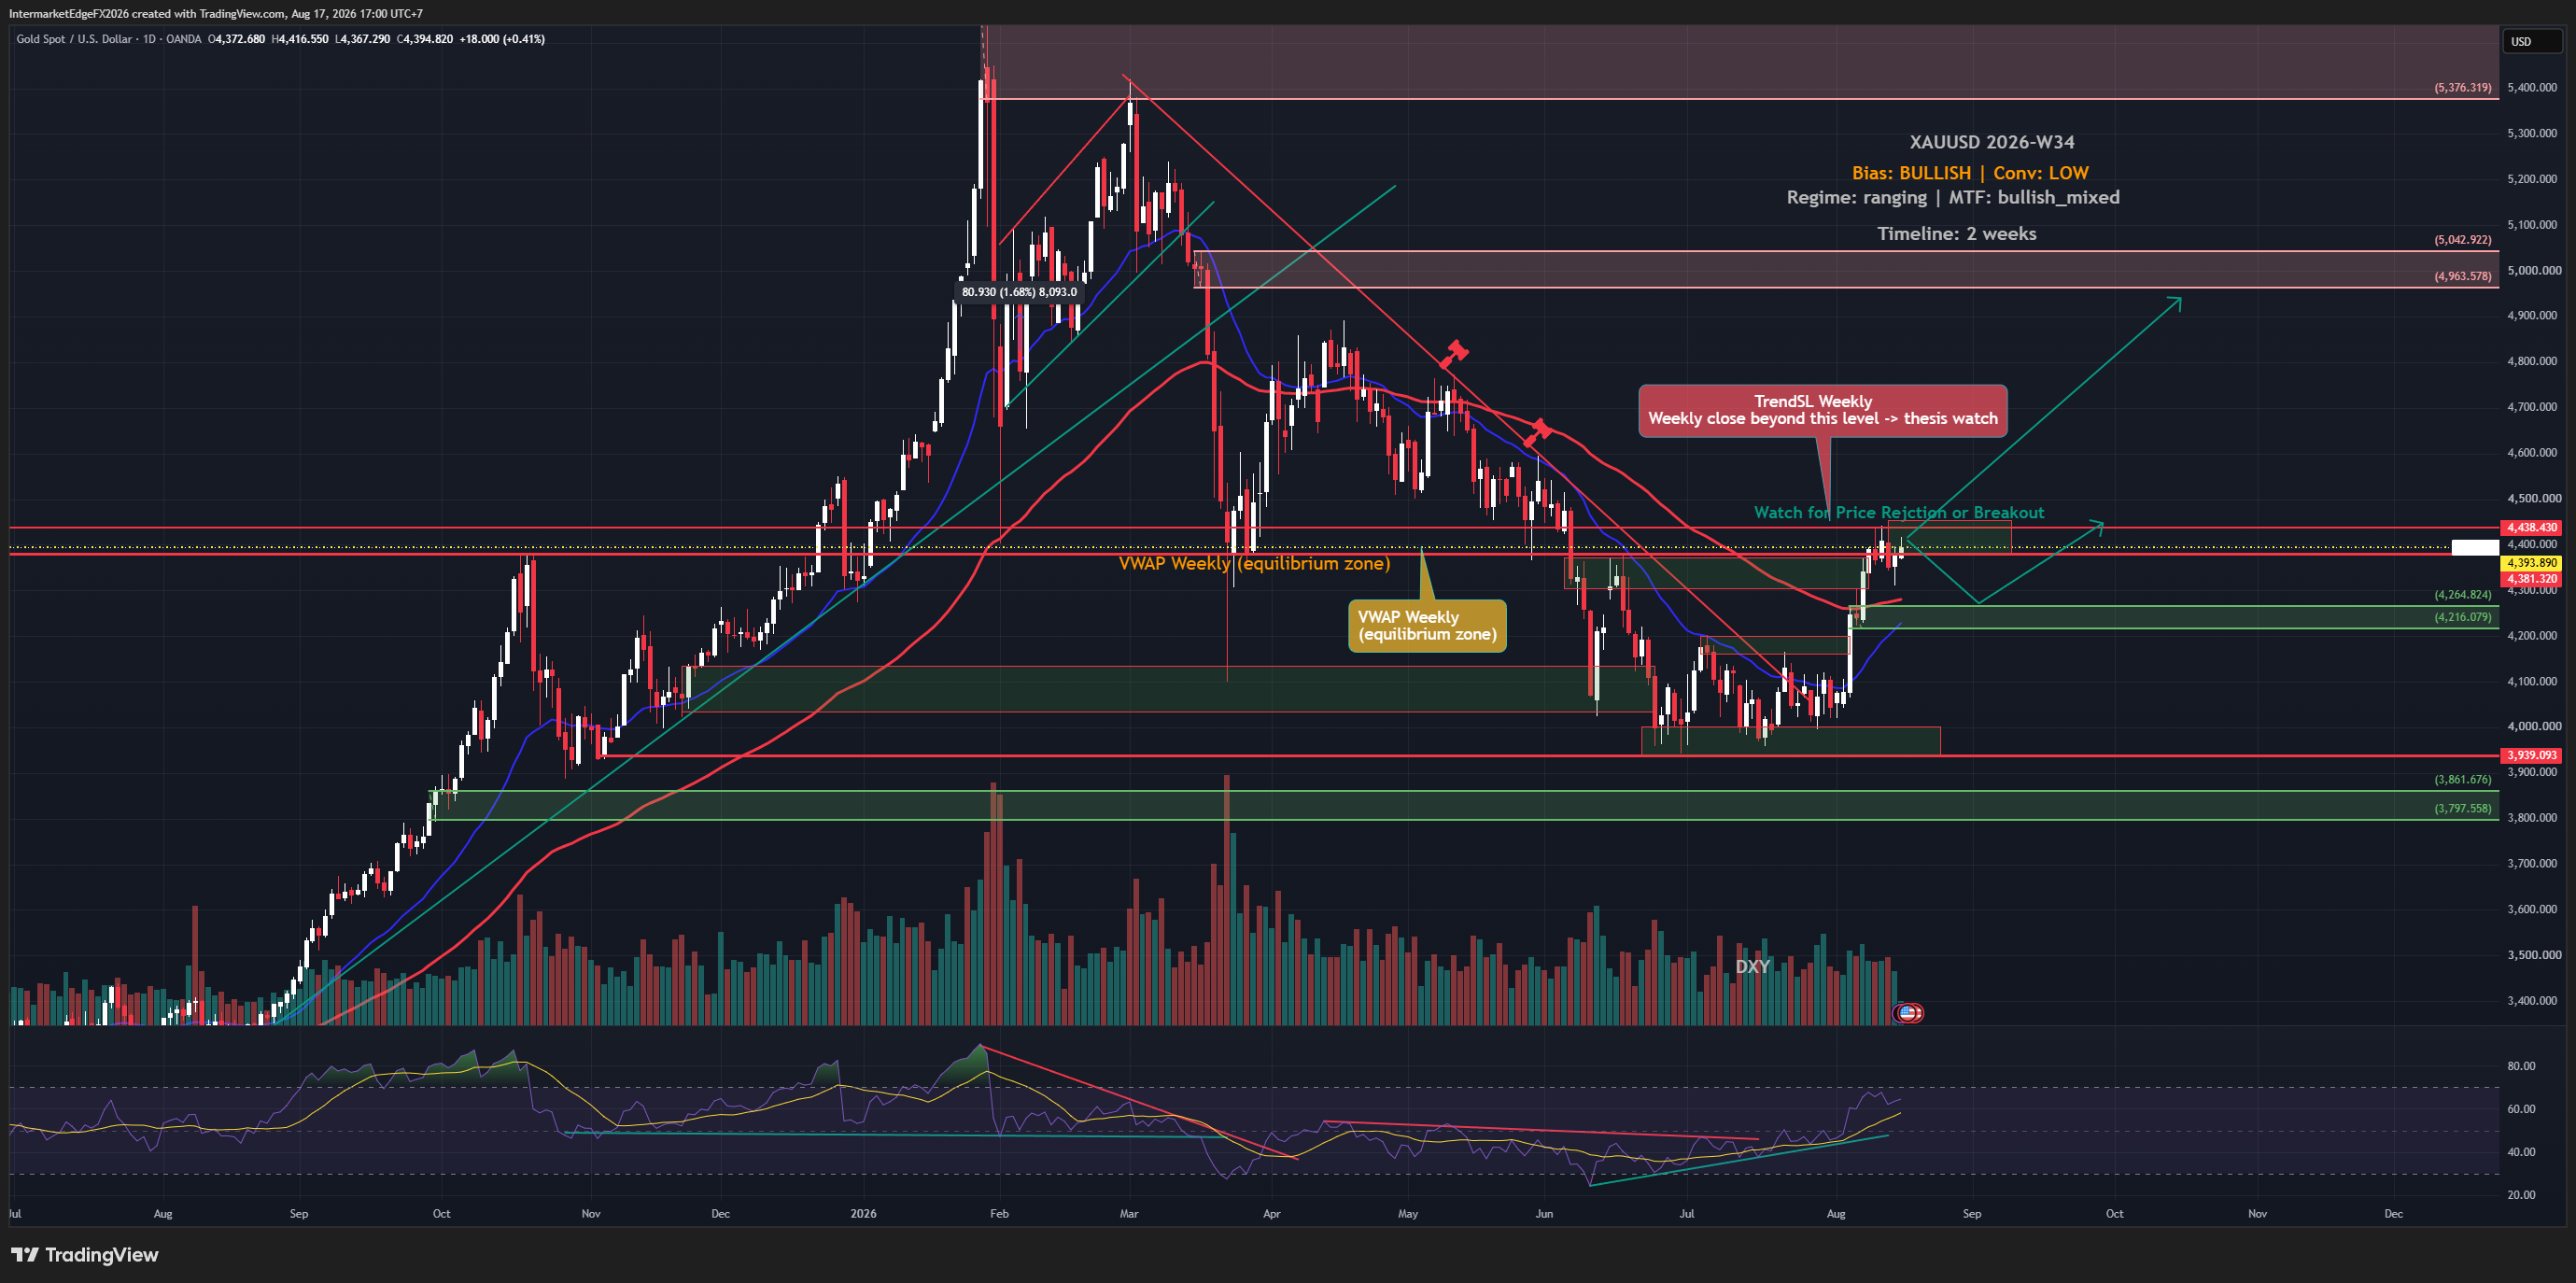
XAUUSD - Wave c of Correction (4) Running, the Hawkish FOMC and a 13-Month DXY High Press Gold Toward the 4,036 Completion Zone

XAUUSD - Wave c of Correction (4) Running, the Hawkish FOMC and a 13-Month DXY High Press Gold Toward the 4,036 Completion Zone

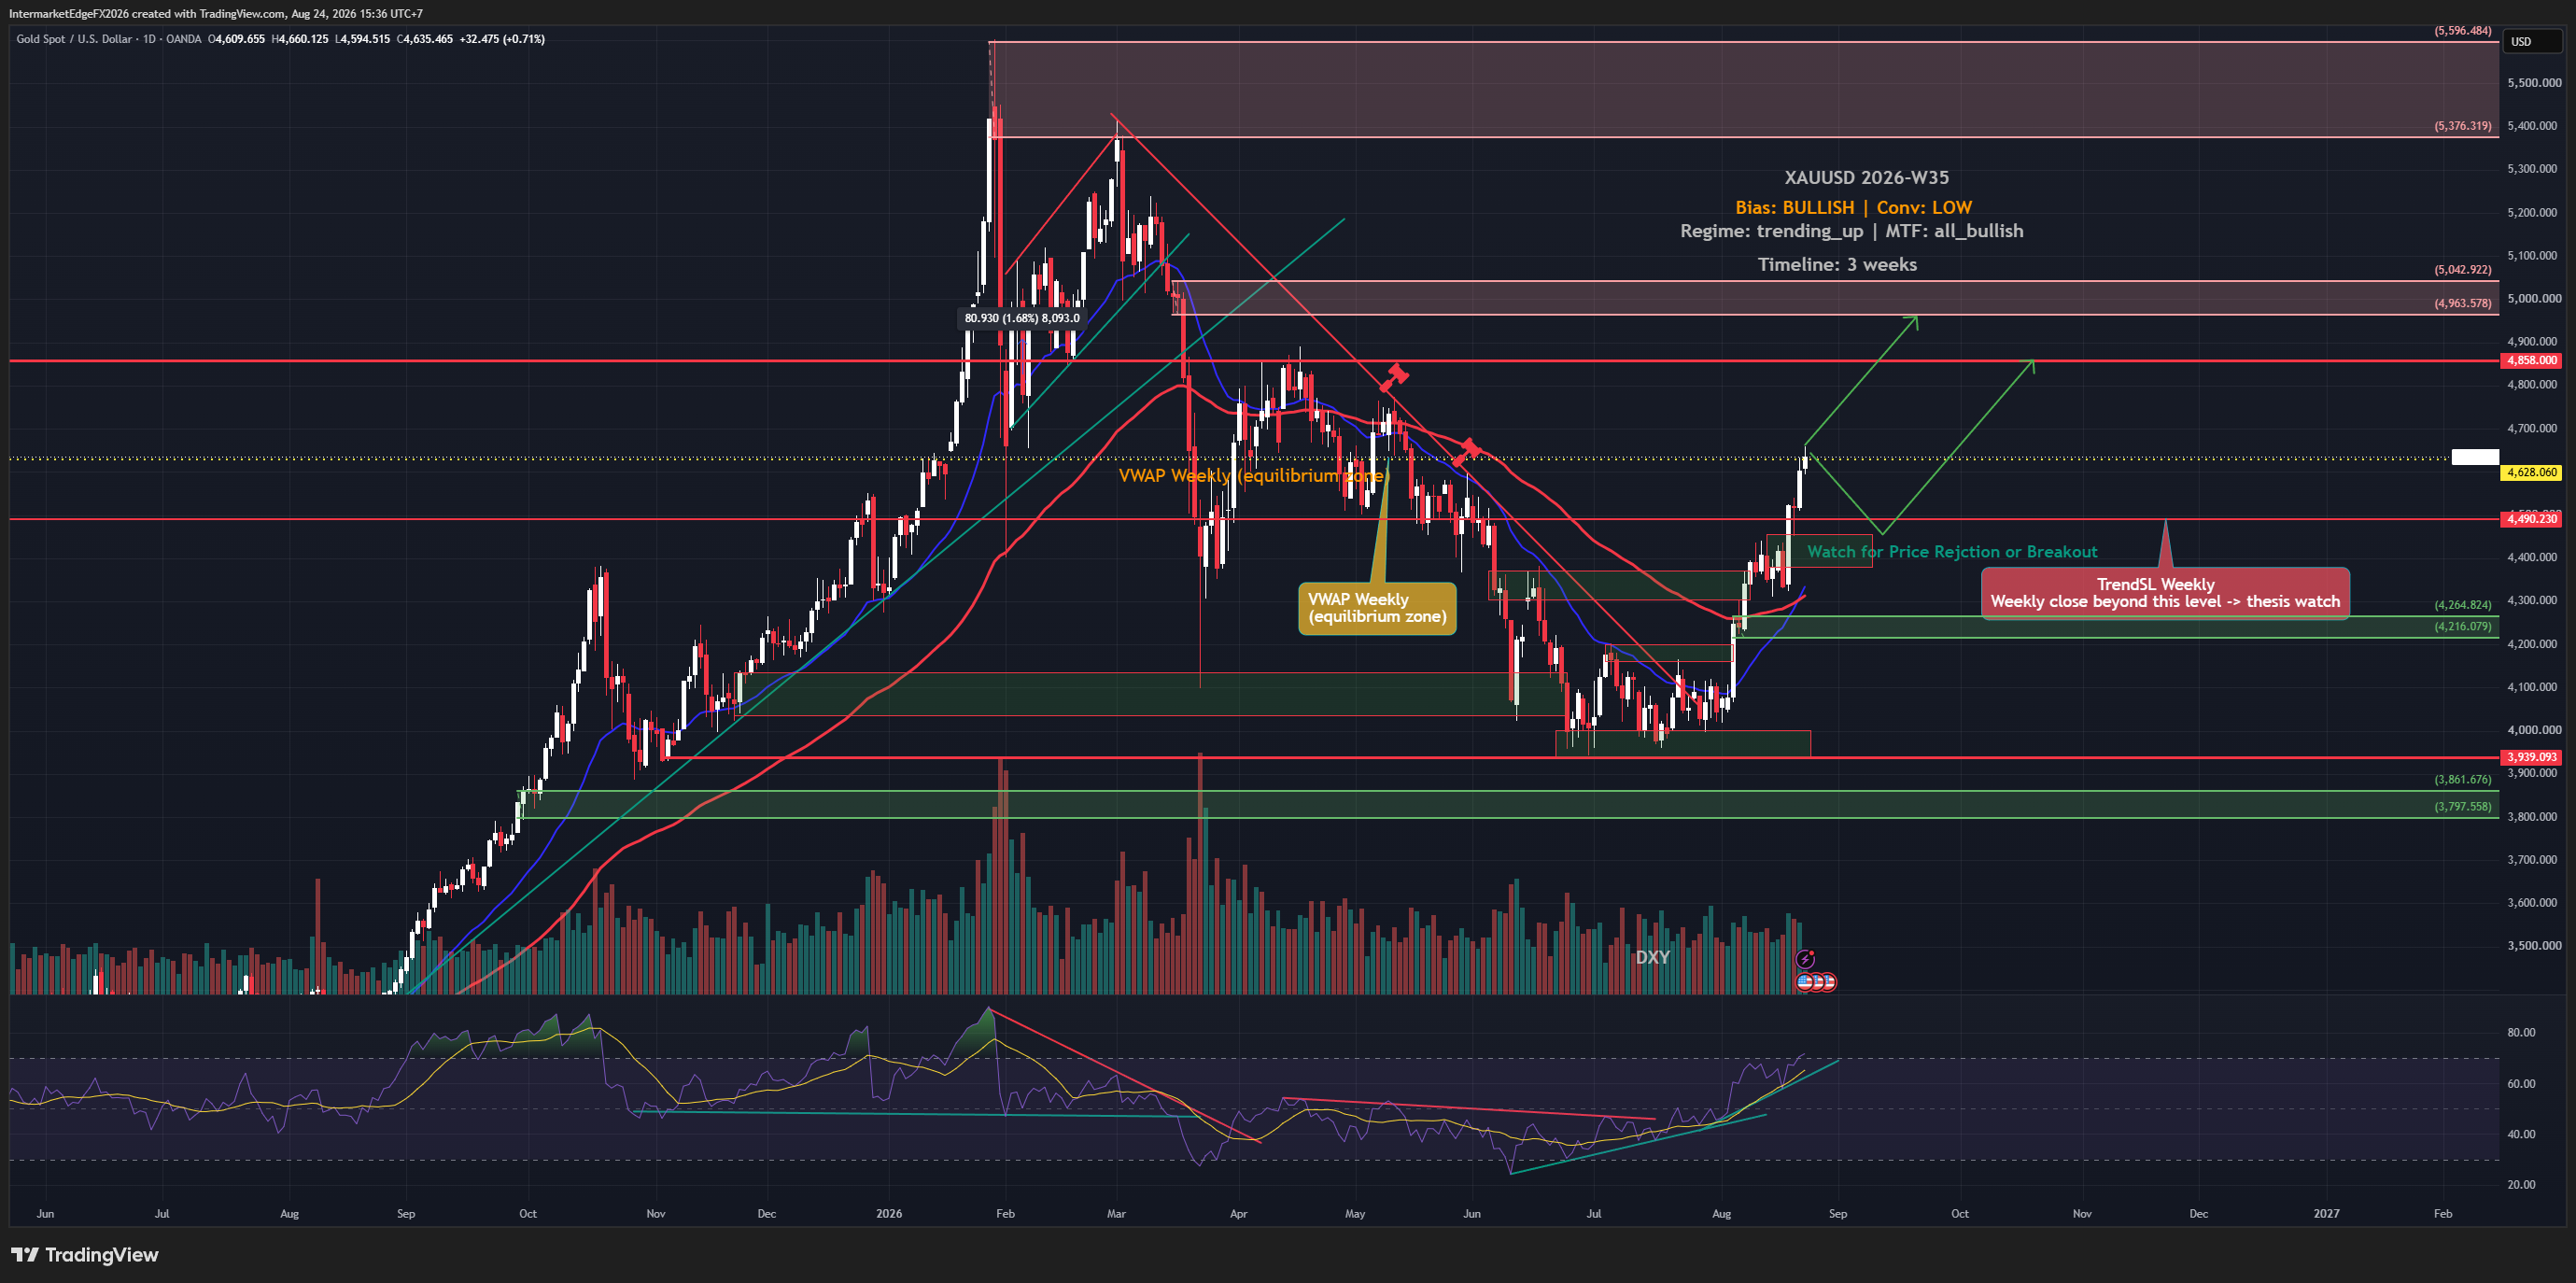
XAUUSD $4,191 | Wave c running, nearing the wave (4) floor | 22 June 2026 Last week gold was mildly bullish as Iran peace drained dollar haven premium. This week the thesis reversed entirely: hawkish FOMC, DXY at a 13-month high, positive real yield 0.290% -- all pressing gold. But price is approaching structural floor. Large wave count: wave (3) topped ~5,596, now in wave (4) correction. Inside (4): a ~4,400, b ~5,370, wave c running lower. Price $4,191, below the 4,381 pivot ("Watch for Price Rejection or Breakout"). Wave c target: 4,036. Deeper: 3,861-3,797 (green box). After wave (4) completes, wave (5) above 5,596 is the long-term picture. The pipeline showed wrong numbers. CPI US 2.4% (actual 4.2%, real yield 0.290%). Fed pipeline: "Hold ~40% hike Apr 2027" (actual: hold + projected hike later 2026). Chart header 2,763 is an artifact; actual $4,191. Also today: UK PM Starmer resigned, VIX jumped to 17.62, silver surged +1.6% -- partial safe-haven flow and precious metals bid despite the strong dollar. Three scenarios: → Wave c continues to 4,036, wave (4) completes. Probability: 40% → Weak data or Iran collapse, break above 4,381. Probability: 25% → Wave c deeper to 3,861-3,797. Probability: 20% The tell: the 4,381 pivot. A rejection keeps wave c alive; a breakout signals wave (4) done. Conviction: Medium Bear near-term, approaching floor. --- Intermarket Edge | Institutional Macro & Intermarket Analysis For informational purposes only. Not financial advice.

USDJPY - Wave (5) Exhaustion at the 161.94 Intervention Ceiling, the BoJ Hike Compresses the Spread to 1.81% as the Yen Hits a 23-Month Low

USDJPY - Wave (5) Exhaustion at the 161.94 Intervention Ceiling, the BoJ Hike Compresses the Spread to 1.81% as the Yen Hits a 23-Month Low

USDJPY 161.354 | Wave (5) exhaustion at the 161.94 intervention ceiling | 19 June 2026 The foundation says bullish. The ceiling says caution. Three capping forces converge at exactly the level where Japan's MOF has intervened before -- and the wave count says the impulse is running out of room. USD leg strong: FOMC 17/06 held + projected hike later this year, DXY ~101. Japan May CPI subdued (core +1.4%, core-core +1.8%), less BoJ urgency. Three capping forces: First, acute MOF intervention risk. The yen hit a 23-month low, Japan warned verbally, USDJPY beyond 160. When triggered: 300-500 pips in hours. Second, the BoJ hiked to 1.00% with hawkish guidance. JP10Y jumped to 2.640% (not the stale 1.47%). The real US-JP spread is just 1.811% -- nearly a third narrower than the pipeline's 2.981%. Third, wave (5) exhaustion at the 161.940 ceiling. The wave count expects completion then an (a)(b)(c) correction. The pipeline showed you the wrong number. JP10Y: 1.47% (stale). Actual: 2.640%. US-JP spread: 2.981%. Actual: 1.811%. D1 structure: impulse (1)~149, (2)~140, (3)~159, (4)~152, (5) now ~161.35, ceiling 161.940. Correction targets: 157.2 (0.382) / 155.2 (0.5) / 153.5 (0.618). Above 161.94 opens extension to 164. Three scenarios: → Wave (5) completes then correction to 155-157. Probability: 35% → MOF intervention, sharp drop to 155 then 152. Probability: 25% → Break above 161.94, extension to 164. Probability: 25% The tell: three forces at one ceiling. Wave (5), the MOF warning, and the compressed spread all point to 161.94. Above it, 164; below 160, the correction begins. Do not chase longs at 161. Conviction: Medium Bull structural, near-term correction lean. --- Intermarket Edge | Institutional Macro & Intermarket Analysis For informational purposes only. Not financial advice.

USDCAD - Wave (3) Impulse on Post-FOMC Dollar Strength, CAD at a 7-Month Low, a Wave (4) Pullback Sets Up the Wave (5) Push Toward 1.45

USDCAD - Wave (3) Impulse on Post-FOMC Dollar Strength, CAD at a 7-Month Low, a Wave (4) Pullback Sets Up the Wave (5) Push Toward 1.45

USDCAD 1.4115 | Wave (3) impulse on post-FOMC dollar strength | 18 June 2026 Two currencies moving in opposite directions met in one pair: the Fed projected a hike, and the Canadian dollar hit a 7-month low. The wave count says the big move hasn't started yet. USD leg: the FOMC on 17/06 held rates but projected a hike later in 2026 -- a hawkish dot plot. The dollar extended gains, DXY to a two-month high near 100.6. EUR/GBP/AUD all falling, confirming broad USD strength. CAD leg: the Canadian dollar at a 7-month low (newsfeed: "Canadian Dollar Hits 7-Month Low"). Crude ticked up to 74.46 but stays low after the war premium unwound -- pressure on CAD. The pipeline showed you the wrong numbers. Fed pipeline: "Hold 2026, hike Apr 2027." Actual: hold + projected hike later 2026 (hawkish, done). Pipeline CPI US 2.4%. Actual 4.2%, real yield 0.263%. D1 structure: a bullish Elliott impulse. (1) ~1.38, (2) ~1.347, (3) now ~1.414. Price at 1.4115, just below the 1.41388 resistance. The chart expects a wave (4) pullback to the fib region 1.39 (0.382) / 1.385 (0.5) / 1.378 (0.618), pivot 1.39660. Then wave (5) up to 1.44473 → 1.45400. Three scenarios: → Wave (4) to 1.39-1.385 then wave (5) up to 1.44473. Probability: 40% → Direct break above 1.41388 toward 1.44473, shallow pullback. Probability: 25% → Deeper wave (4) to 1.378 then resume up. Probability: 20% Invalidation: daily close below 1.347 (early warning: a break of 1.378). The tell: the wave (4) pullback. A hold above 1.378 with the dollar firm keeps the path to 1.45 alive. Position around the 1.39-1.385 fib region rather than chasing at the top. Conviction: Medium-High Bull. --- Intermarket Edge | Institutional Macro & Intermarket Analysis For informational purposes only. Not financial advice.

EURUSD - Wave (c) Correction Lower After the 1.21 Top, the DE-US Spread at -1.51% Reinforces the USD Carry Advantage Into the FOMC

EURUSD - Wave (c) Correction Lower After the 1.21 Top, the DE-US Spread at -1.51% Reinforces the USD Carry Advantage Into the FOMC

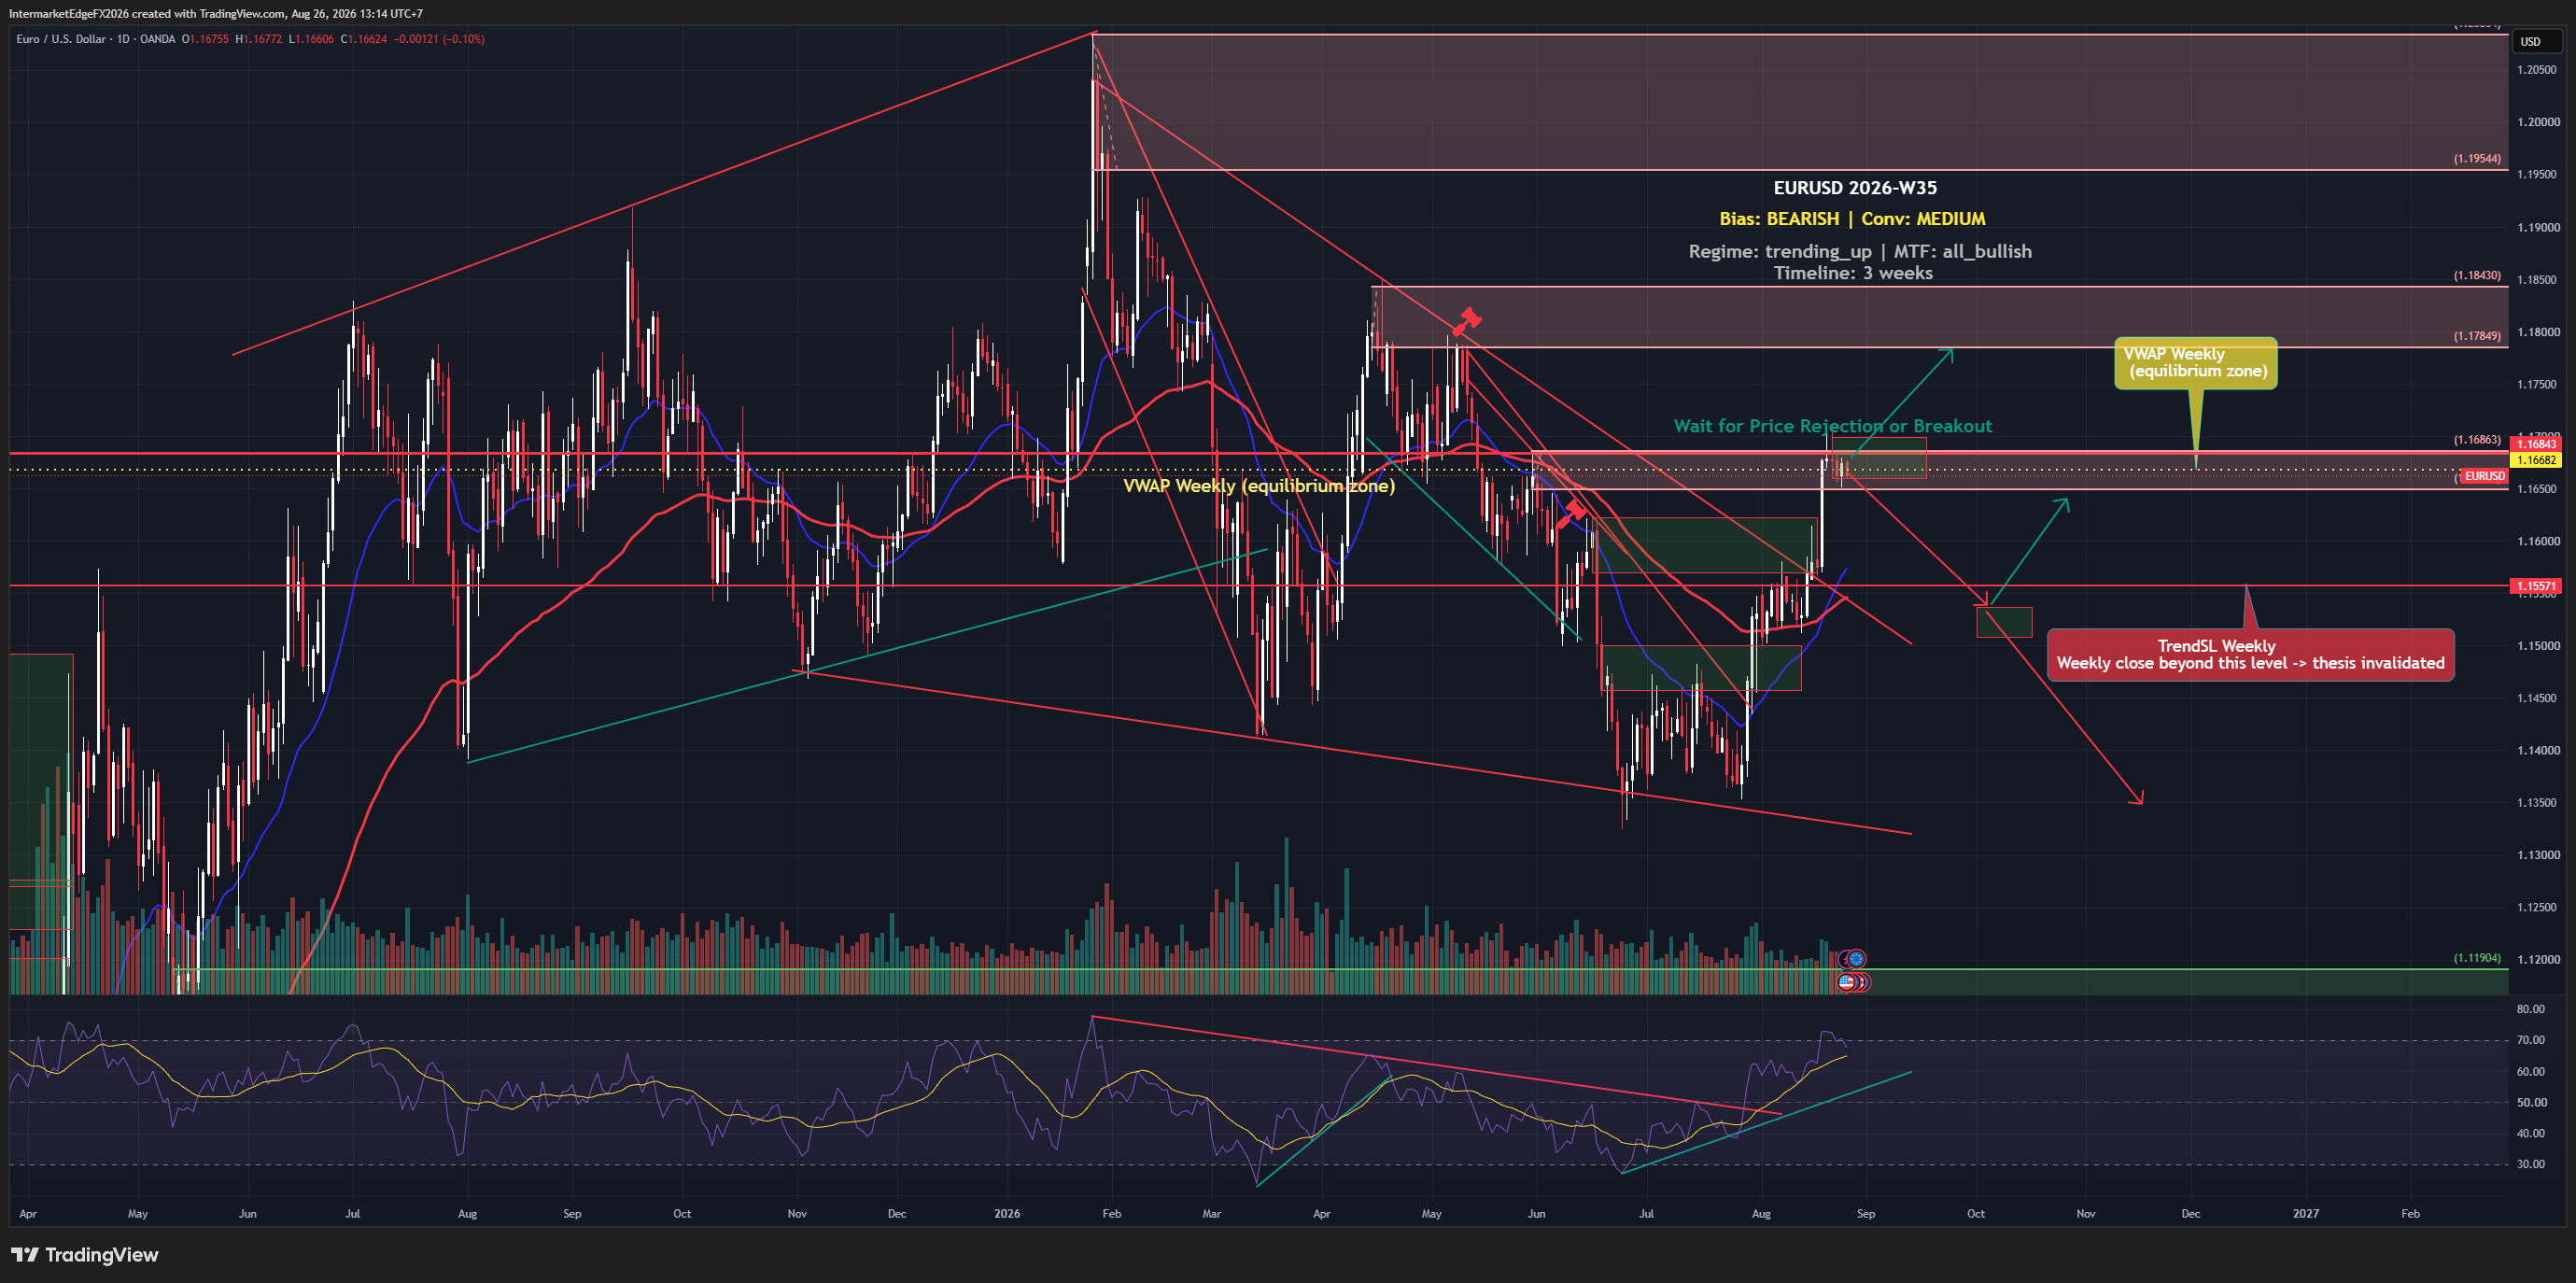
EURUSD 1.1595 | Wave (c) lower meets the Warsh dot plot tonight | 17 June 2026 The structure and the yield spread both point down. One event tonight decides the pace. The Elliott Wave count on the D1 is clean: EURUSD completed a five-wave impulse to the wave (5) top near 1.21 (Feb), then an ABC correction: (a) ~1.142, (b) ~1.182, and wave (c) now running lower. Price at 1.1595 sits inside wave (c). The yield foundation reinforces the decline. The DE-US spread is -1.510% -- US yields 1.51 points above German, a strong USD carry advantage. The ECB at 2.00% sits below the Fed. The pipeline is showing you the wrong numbers. Pipeline CPI US: 2.4% (stale). Actual: 4.2%, real yield 0.238%. Pipeline ECB: 2.50% cutting. Actual: 2.00% neutral hold. Chart header price 1.16416 is an artifact -- actual ~1.1595. D1 structure: key support 1.14100 (wave a low). Near wave (c) target: 1.145 → 1.141. A break opens the deeper projection 1.10-1.105. Resistance: descending trendline 1.165-1.168, then the wave (b) top ~1.182. Pre-FOMC EUR scenarios: → Hawkish, hike dot: break below 1.145 toward 1.141 then 1.10-1.105. Probability: 40% → Dovish, no hike dot: bounce to the trendline 1.165-1.168. Probability: 25% → Neutral, balanced dots: drift in wave (c) 1.155-1.165. Probability: 25% Wave-count invalidation: daily close above ~1.182. The tell: tonight's dot plot. A hike dot accelerates wave (c) toward 1.141; a dovish hold bounces EURUSD to the trendline. Do not chase ahead of the dot plot. Conviction: Medium-High Bear. Intermarket Edge | Institutional Macro & Intermarket Analysis For informational purposes only. Not financial advice.

Stay in the loop

Get notified about new research, macro insights, and market analysis.

InterMarketEdge

© 2026 InterMarketEdge. Financial intelligence for inter-market traders.