Intermarket Analysis — InterMarketEdge

Intermarket Analysis

Cross-asset correlation studies — how oil, yields, equities, and FX interact and what divergences signal

USDCAD Week W36-2026: CAD Strengthens Despite a Hawkish Bank of Canada

USDCAD Week W36-2026: CAD Strengthens Despite a Hawkish Bank of Canada

The Bank of Canada just signaled that persistent inflation could force multiple rate hikes, which on paper is a CAD-positive and USDCAD-negative catalyst. Yet as of Friday, 04 September 2026, the pair sits at 1.37896, below both its weekly VWAP and its trend stop-loss level, and the Canadian dollar actually strengthened in the latest session. When a hawkish central bank warning fails to lift the pair, that divergence between narrative and price deserves serious attention before any directional bet is sized. The directional call on USDCAD for this three-week window is bullish, anchored on two structural pillars: the Fed's hawkish posture lifting real yields and widening the rate differential against the BoC, and a COT positioning lean that tilts modestly in the dollar's favor. When the Fed keeps real yields elevated while the BoC sits on hold, the carry dynamic, the return earned by holding the higher-yielding currency, funded by selling the lower-yielding one, mechanically favors USD. That logic is coherent and consistent with past USDCAD behavior during Fed-BoC divergence cycles. The problem is that conviction here is deliberately low, and for reasons that go beyond a single data point. Two of the five analytical pillars, liquidity conditions and market sentiment, produced no usable signal this week. That silence does not mean those factors are neutral; it means the evidence base is incomplete, and sizing a position on three pillars when two are dark is a different risk than sizing on five. More critically, the price itself is already contradicting the thesis at its foundation: at 1.37896, USDCAD is trading below the weekly VWAP at 1.38752 and below the weekly trend stop-loss at 1.39429, meaning the technical structure does not support the bullish label, it actively contradicts it. The bullish bias reflects a macro and positioning overlay, not a technically confirmed setup. -- Intermarket Edge (Note: COT (Commitment of Traders) data is released weekly by the CFTC

EURGBP Week W36-2026: Technicals Hold Bullish Structure Above 0.85647, But the Macro Story Has a Hole in It

EURGBP Week W36-2026: Technicals Hold Bullish Structure Above 0.85647, But the Macro Story Has a Hole in It

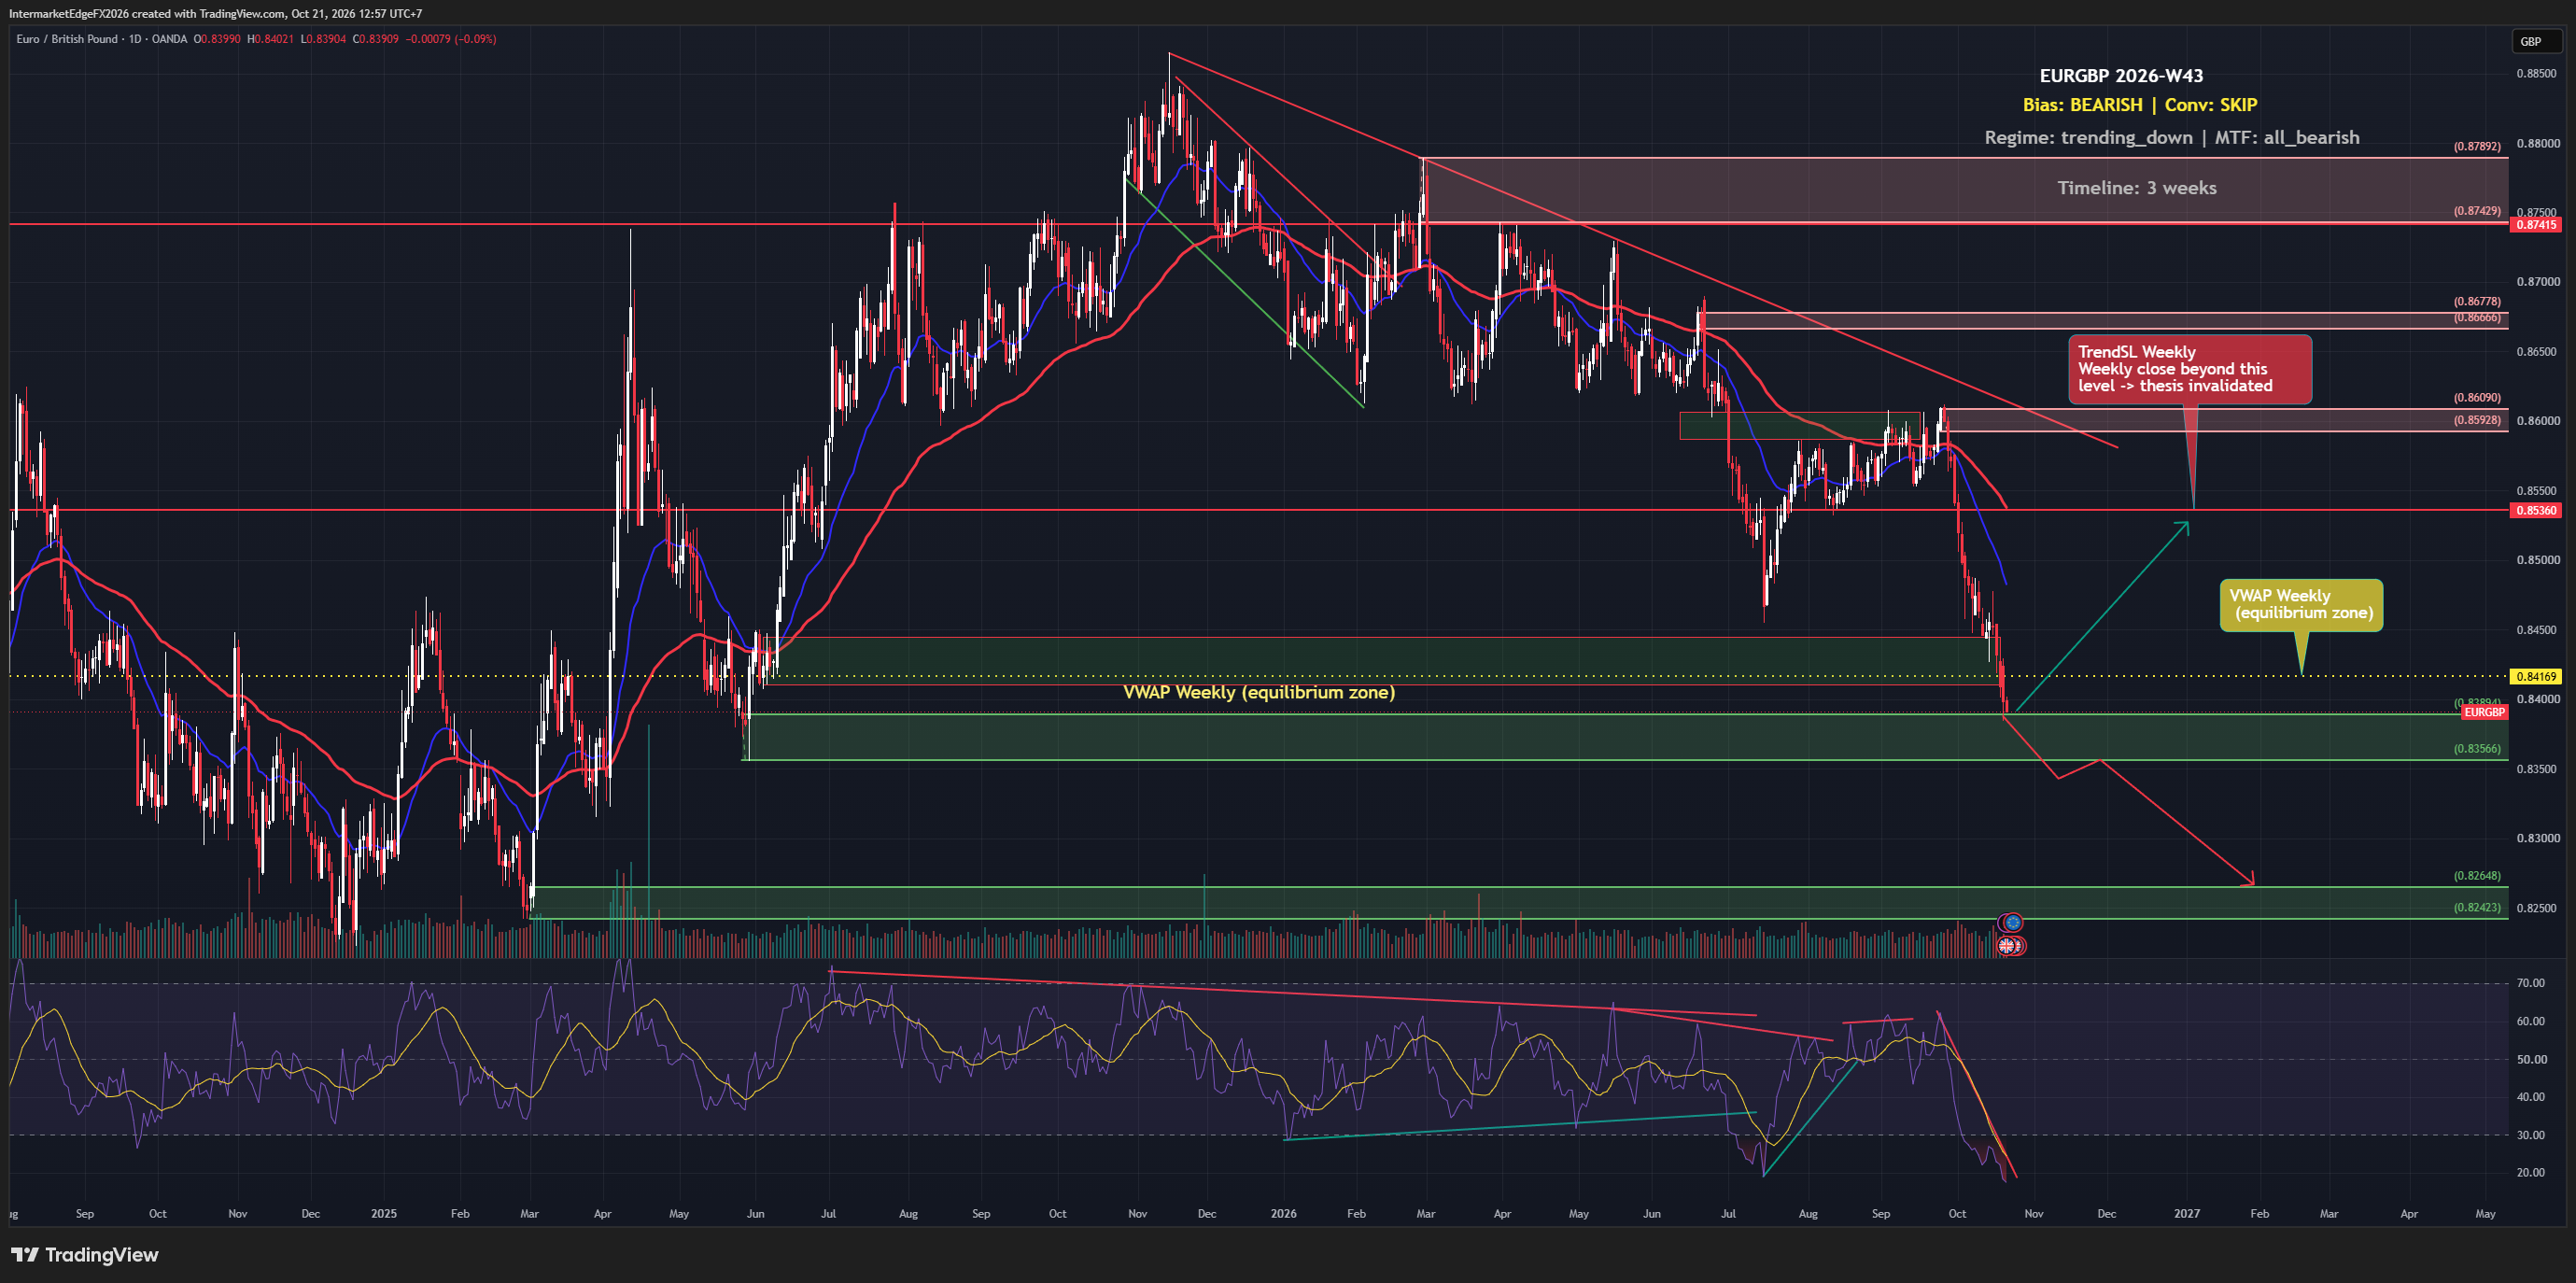
EURGBP is trading above its weekly VWAP at 0.8577 as of Wednesday, 02 September 2026, with charts aligned bullish across every timeframe. The catch: the entire bullish case rests on technical structure alone, no macro confirmation, no positioning signal, nothing beyond price telling you which way to lean. That narrow foundation is exactly what makes this week's setup worth watching carefully rather than trading aggressively. The bullish bias on EURGBP this week is real but structurally thin. Daily, weekly, and monthly technical trend signals are all pointing the same direction, that multi-timeframe alignment, where price structure agrees across short, medium, and long horizons, is the strongest argument for the upside case. It reduces the probability that you are catching a random short-term noise move against a larger trend. What it does not do is tell you why the move should continue or how far it goes. The stated fundamental driver for this pair is the ECB versus BoE rate differential, the gap between where the two central banks are setting rates and where markets expect them to go, which directly affects the relative attractiveness of holding euros versus pounds. That differential is a plausible and historically significant driver for EURGBP. The problem this week is that the macro evidence has produced no confirming signal. The rate differential is the narrative, but the data behind it has not fired. That gap between a coherent story and an absent signal is the defining tension. The practical consequence is that the conviction level here amounts to a deliberate decision to stand aside. The technical foundation is present; everything else that would normally underpin a higher-confidence directional trade, positioning data, a macro catalyst, sentiment confirmation, is not contributing. -- Intermarket Edge

EURJPY Week W36-2026: Technicals Hold Above 185.37 as Japan's Retail Sales Surge Meets a Dollar Bidding for Rate Hikes

EURJPY Week W36-2026: Technicals Hold Above 185.37 as Japan's Retail Sales Surge Meets a Dollar Bidding for Rate Hikes

EURJPY is trading at 185.6 as of Tuesday, 01 September 2026, sitting just above its weekly VWAP at 185.37 with every timeframe technically aligned to the upside. Japan just delivered a retail sales print of 4.0% YoY, nearly double the forecast, and industrial output surprised to the upside as well. Yet the overall bullish conviction here is deliberately low, and that gap between clean technicals and absent macro support is exactly the tension worth understanding before sizing any exposure. The bullish bias on EURJPY for week W36-2026 rests on a single, structurally sound but narrowly sourced pillar: every technical timeframe, daily, weekly, and monthly, is aligned to the upside. That kind of multi-timeframe agreement is not common and is not trivial; it indicates the dominant trend is consistently reproduced at every analytical resolution, which reduces the probability that any one signal is noise. The practical effect is that the path of least resistance, absent a disrupting catalyst, points higher. What complicates this is that technical alignment is the only signal firing. COT positioning, which measures how leveraged and institutional accounts are positioned and would indicate whether professional capital is actually behind the move, has returned neutral with no directional read this week, so it is not possible to say the trend is being driven by the kind of committed positioning that sustains extended moves. Macro signals, sentiment gauges, and liquidity conditions have all returned similarly flat. This matters because a trend that rests solely on price-derived signals, without confirmation from who is positioned and why, carries crowding risk in a different form: the risk that the apparent trend is thin and vulnerable to a rapid unwind the moment a real macro trigger appears. The BOJ policy trajectory is the most direct potential disruptor on the JPY leg. -- Intermarket Edge (Note: COT (Commitment of Traders) data is released weekly by the CFTC with a report

XAUUSD Weekly Outlook: Hawkish Shock, Unconfirmed Bull Case

XAUUSD Weekly Outlook: Hawkish Shock, Unconfirmed Bull Case

Gold fell more than 3% in a single session after Fed Chair Kevin Warsh signaled further rate hikes if inflation does not clearly return toward 2%, lifting September hike probability from roughly 36% to around 62%. Yet despite that sharp Friday selloff, spot gold near 4,448 dollars remained on course for its strongest monthly gain since January. That contradiction, brutal single-session damage inside a bullish monthly trend, is exactly the kind of setup where traders read the direction right and still get hurt. The framework labels XAUUSD bullish for the two-week window, but deliberately attaches a stand-aside posture to that label, meaning the evidence is not convincing enough to size a position, and that is a considered analytical conclusion rather than an absence of a view. Understanding why that gap exists between the directional label and the action status is the practical takeaway. Price signals, the inputs the analysis weighs most heavily for direction, lean bullish. But the COT data through August 25 showed managed money net long 144,747 COMEX gold contracts, up 3,099 from the prior week. It is worth noting that this COT reading predates Friday's sharp selloff, so the actual positioning picture after that session is unknown and must be treated as lagged. Even before accounting for that lag, the level itself is a crowding risk: when speculative longs are already concentrated at an extreme, the question becomes who is left to push price higher, and the answer often determines whether a bullish thesis accelerates or reverses violently on any negative catalyst. That COT reading conflicts directly with the bullish price signals, and the framework flags this openly rather than resolving the conflict artificially. -- Intermarket Edge (Note: COT (Commitment of Traders) data is released weekly by the CFTC with a reporting-period lag -- it is not a real-time position feed. See cftc.gov for the exact release schedule.)

USDCAD: Bullish Macro Label Meets a Bearish Price Structure

USDCAD: Bullish Macro Label Meets a Bearish Price Structure

USDCAD is carrying a bullish bias into the final stretch of August 2026, but the pair is trading nearly 63 pips below the weekly TrendSL of 1.39451 as of Thursday, 27 August, meaning the technical structure does not yet support the label it has been given. The Canadian dollar hit a one-week low as a revived trade dispute rekindled economic worries, yet retaliatory tariffs from Canada quickly clawed some of that move back. That push-pull dynamic is precisely the kind of environment where calling a direction early is far easier than timing it correctly. The bullish thesis on USDCAD rests on a causal chain that begins at the Fed: sustained hawkishness has pushed US real yields to 2.32%, which supports dollar demand globally and feeds directly into USDCAD through the rate differential with the Bank of Canada. COT positioning data adds a secondary layer of confirmation, with commercial and speculative data skewing toward USD strength, though the brief does not specify the report week, net-position figure, or sample window, so this should be read as directional corroboration rather than a standalone signal. Macro and positioning therefore rhyme. What they do not resolve is the technical picture. This is where the thesis becomes genuinely complicated. At the time of writing, price at 1.38829 is already below the TrendSL weekly of 1.39451, and that condition was true from the moment the thesis was generated, not something that developed afterward. A bullish bias with price testing from underneath a declining trend stop-loss line is a structural contradiction: the same framework that produces the bullish label is simultaneously flagging that the technical evidence does not support it yet. The conviction level is accordingly low, and that is not a minor disclaimer, it is the honest read of a setup where macro and price structure are pointing in opposite directions. -- Intermarket Edge

EURGBP Week W35-2026: Sterling Pauses Its Four-Week Rally, but the Bullish Case Sits Below Every Key Level

EURGBP Week W35-2026: Sterling Pauses Its Four-Week Rally, but the Bullish Case Sits Below Every Key Level

EURGBP is sitting below its weekly VWAP of 0.85608 as of Tuesday, 25 August 2026, and the technical structure already contradicts the tentative bullish lean this week carries. Sterling just paused a four-week rally as investors repositioned around US sanctions on Iran, while the ECB is signaling caution on rates even as the eurozone shows unexpected resilience. The pair is caught between two central banks pulling in different directions, and right now, neither side has won. The framework labels EURGBP bullish for the two-week horizon beginning W35-2026, but the honest description of that label is that it rests on a single thin pillar: price action alone. Every other input, positioning data, macro signals, liquidity conditions, sentiment, is neutral and contributing nothing to the directional call. That kind of setup, where one source carries the entire argument, is precisely where conviction becomes a problem, and this analysis treats it as such. The decision here is deliberately to stand aside rather than size a position, because the evidence is not yet convincing enough to justify the directional risk. The stated primary driver is the ECB versus Bank of England rate differential, the practical meaning of which is that when the ECB is expected to hold or cut while the BOE is expected to hike, Sterling strengthens relative to the euro, pushing EURGBP down, and vice versa. But here is the disconnect that matters: no rate-specific or macro-specific signals have actually fired in support of the bullish label. The driver is named but not confirmed by the inputs. Compounding that, the structural or longer-term bias is neutral, which conflicts with the short-term bullish lean. -- Intermarket Edge

XAUUSD Week W35-2026: Gold Hits a Three-Month High as Fiscal Fears Collide With a Real Yield Warning

XAUUSD Week W35-2026: Gold Hits a Three-Month High as Fiscal Fears Collide With a Real Yield Warning

Gold traded at 4641.1 on Monday, 24 August 2026, reaching levels not seen in over three months ahead of a week packed with US inflation and labor data. The move is real, daily, weekly, and monthly structure all point the same direction. But the macro headwind is equally real: a US 10-year real yield of 2.35% is the kind of opportunity cost that historically slows gold rallies. Knowing which force wins this week is the actual question. The bullish bias on gold this week rests on two pillars: price structure and derivatives-market positioning, specifically the COT signal. Every major timeframe, daily, weekly, monthly, has its trend stop-loss pointing in the same direction, which is the highest form of technical agreement the framework registers. That kind of multi-timeframe alignment (MTF all_bullish) means trend-following systems and discretionary traders anchored to weekly and monthly structure are pulling in the same direction, reducing the probability of sharp mean-reversion moves against the trend. The COT signal adds a second, independent layer. When the positioning pattern currently active has fired historically, over 41 observed weeks, the bullish outcome was correct roughly 70.7% of the time, with average conviction rising substantially across those instances. That figure should be read as a directional probability, not a guarantee; the sample size is moderate and the methodology details are not fully disclosed in what is available here, so treat it as supporting evidence, not standalone proof. What keeps conviction at the low end despite these positives is the absence of any sentiment or liquidity confirmation. The bullish case is built entirely on price structure and COT; neither sentiment flow nor liquidity conditions are contributing. -- Intermarket Edge

EURJPY Week W34-2026: Trend Holds Above 184.86, But a BOJ Carry-Unwind Warning Keeps Buyers Cautious

EURJPY Week W34-2026: Trend Holds Above 184.86, But a BOJ Carry-Unwind Warning Keeps Buyers Cautious

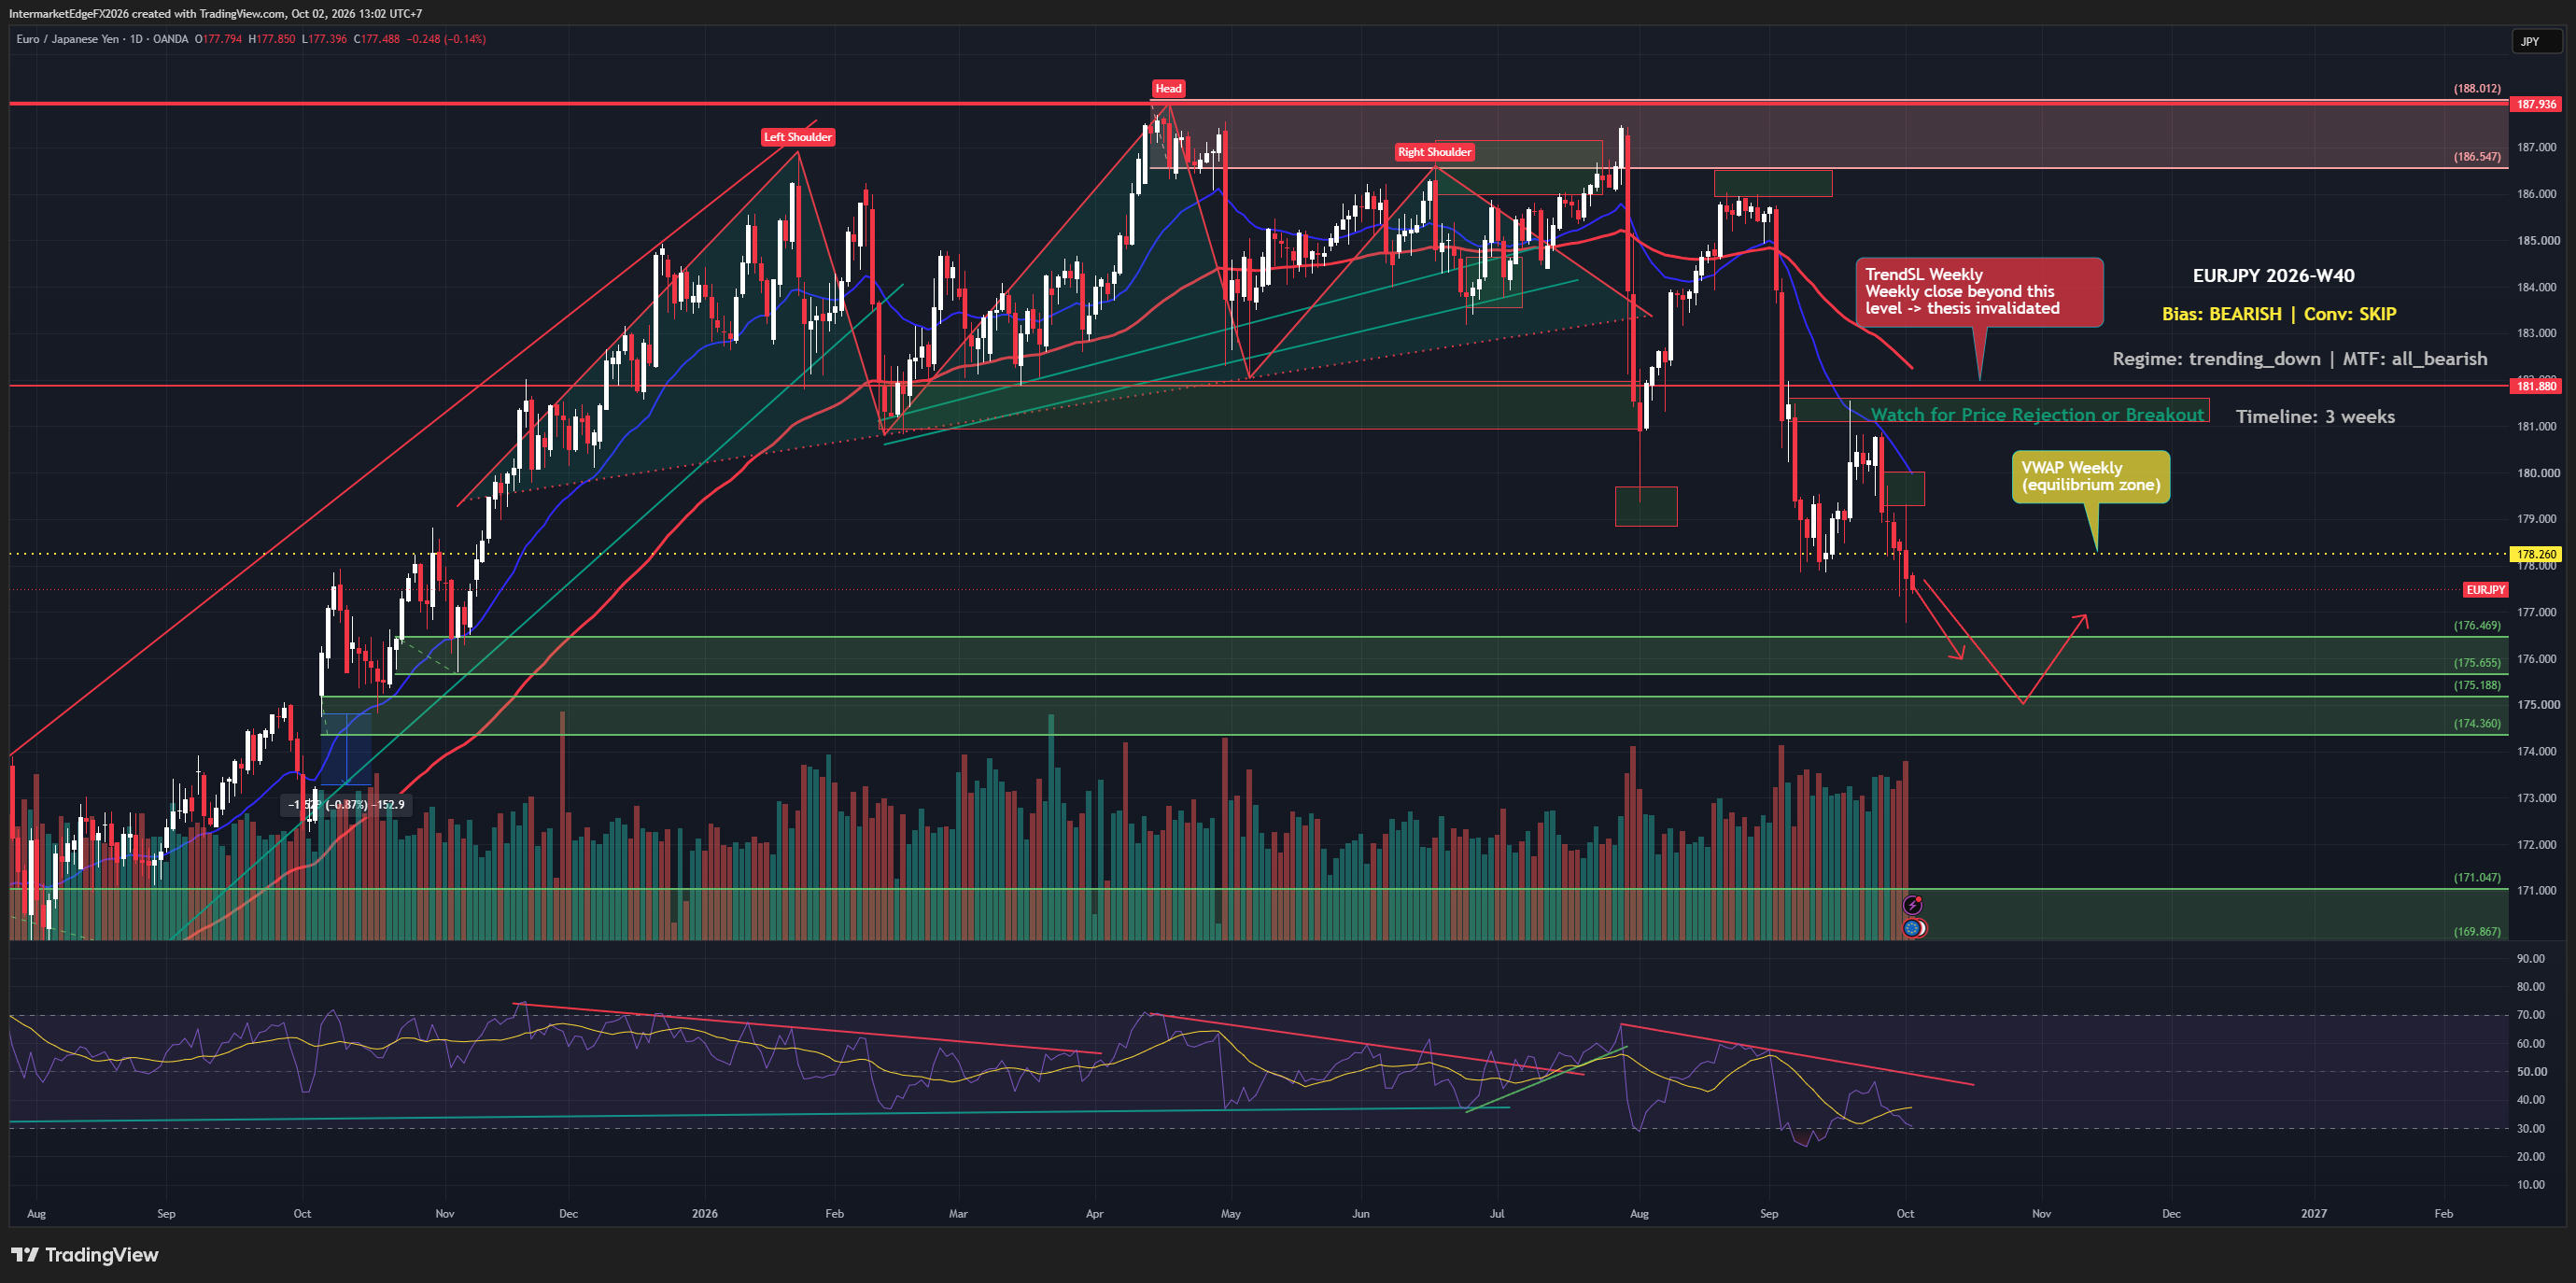
EURJPY is trading at 185.65 as of Friday, 21 August 2026, above its weekly VWAP at 184.86, with daily, weekly, and monthly trend all pointing the same direction. That alignment sounds clean, but Japan's 52nd consecutive Core-Core CPI increase is keeping BOJ rate-hike expectations alive, and a carry unwind triggered by BOJ policy tightening could erase a technically sound bullish setup faster than most traders anticipate. The structure is bullish. The macro is not cooperating. The structural bias for EURJPY through the next three weeks is bullish, and that verdict rests entirely on price action: daily, weekly, and monthly trend are all aligned upward simultaneously, which is the highest-conviction technical signal this framework can register. When all three timeframes agree, trend-following logic argues for giving the move room to continue rather than fighting it. The current market price of 185.65, recorded on Friday, 21 August 2026, sits above both the weekly VWAP of 184.86 and the weekly trend stop-loss at 183.54, meaning the price structure has not yet given a technical reason to abandon the bullish read. The honest complication is that price action is operating in isolation here. COT positioning, liquidity signals, and sentiment data are all neutral, no confirming flows are reinforcing what the charts suggest. That leaves the bull case technically sound but fundamentally thin. More significantly, macro signals are leaning bearish, driven by BOJ hawkishness carry-unwind risk carrying a meaningful weight in the overall picture. A carry unwind, where yen funding costs rise enough to force traders out of long EURJPY positions regardless of chart structure, does not care about multi-timeframe alignment; it can override technical setups quickly and with little warning. The result is a bullish directional bias that the framework cannot yet support with enough confirming evidence to justify sizing a position. -- Intermarket Edge (Note: COT (Commitment of Traders) data

XAUUSD Week W34-2026: Fed-Hike Bets Collapse and Gold Climbs, But the Structural Ceiling at 4438 Remains Unbroken

XAUUSD Week W34-2026: Fed-Hike Bets Collapse and Gold Climbs, But the Structural Ceiling at 4438 Remains Unbroken

Gold is climbing toward $4,400 as Fed rate-hike bets collapse and the dollar softens, yet the bullish structure is not yet confirmed. Price on Monday, 17 August 2026 sits at 4394.5, marginally above the weekly VWAP but still well below the key trend structure level at 4438.43. The driver that was supposed to cap gold, Fed hawkishness, has been largely invalidated by the market itself, flipping the conventional bearish narrative on its head. The framework's bias for XAUUSD this week is bullish, but that label requires immediate qualification: conviction is low, and the structural picture at the time of thesis generation actually argues against the bullish call rather than supporting it. The reference close price of 4397.83 was already sitting below the weekly trend structure level at 4438.43 when the thesis was set, which means the bullish label is a directional lean, driven primarily by price action and COT positioning, not a technically confirmed trend. That distinction matters because it changes how much weight any given piece of confirming evidence should carry. The two active pillars supporting the bullish case are price behavior and COT positioning. On the COT side, commercial and speculative positioning in Comex gold futures and options as of the August 14 report leans bullish, but the specific net-position figure and the precise breakdown between commercial hedgers and large speculators are not available here, so this should be read as directional evidence, not a citable standalone number. On price, the multi-timeframe alignment is described as bullish-mixed: some shorter timeframes confirm the directional lean, others do not. Cutting across both pillars is a live Fed-hawkish causal chain that argues the opposite direction, rising real yields reducing gold's appeal, and these forces are partially offsetting each other right now. -- Intermarket Edge (Note: COT (Commitment of Traders) data is released weekly by the CFTC with a reporting-period lag -- it is no

Stay in the loop

Get notified about new research, macro insights, and market analysis.

InterMarketEdge

© 2026 InterMarketEdge. Financial intelligence for inter-market traders.