Tag: WTI — InterMarketEdge

Tag: WTI

USDCAD — BoC Fifth Consecutive Hold, Macklem Admits Stagflationary Dilemma, and Oil Rising Is No Longer Bullish for CAD

USDCAD — BoC Fifth Consecutive Hold, Macklem Admits Stagflationary Dilemma, and Oil Rising Is No Longer Bullish for CAD

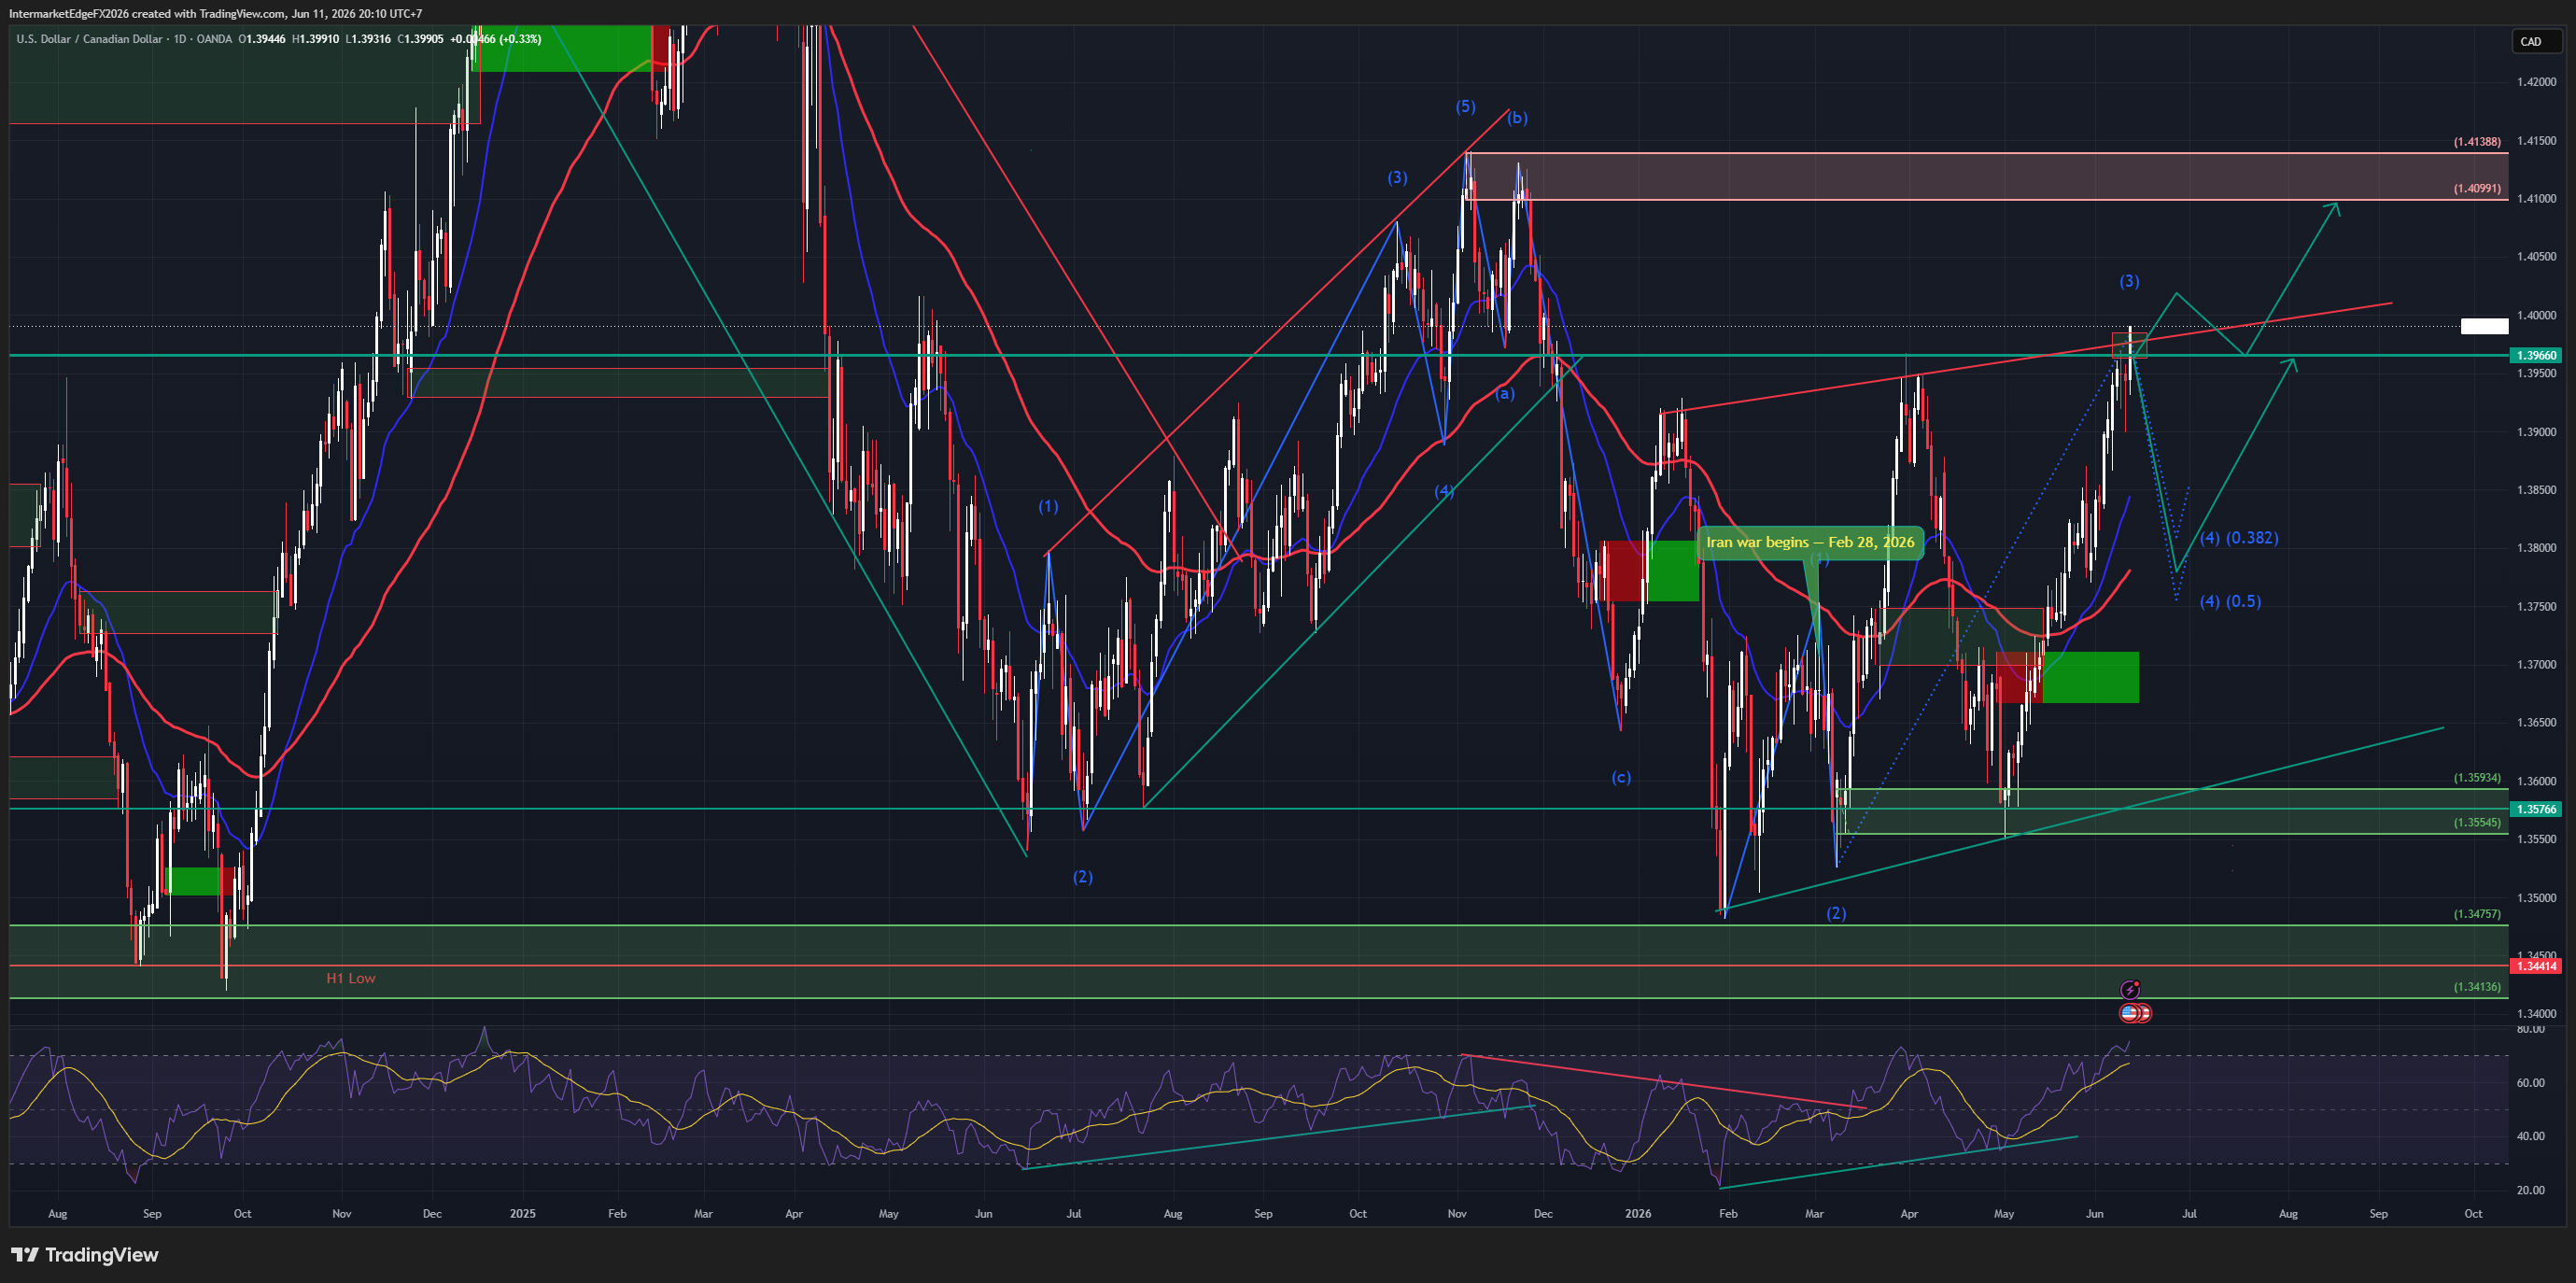
USDCAD 1.3984 | Oil rising, CAD weakening | 11 June 2026 Oil rose $2.50 today on Iran-Hormuz news. The Canadian dollar weakened. The oil-CAD channel has inverted — and understanding why is the entire analytical framework for this pair right now. The current oil spike is geopolitical risk premium, not demand-driven. Geopolitical oil creates safe-haven dollar demand simultaneously. The dollar safe-haven channel is dominant. Standard oil-CAD heuristic = systematically wrong in this regime. BoC held for the fifth consecutive time at 2.25% on June 10. The language change matters more than the decision. April: "changes can be expected to be small." June: "economic weakness combined with rising inflation is a dilemma." Macklem also explicitly opened the cut door: "we may need to cut further if US trade restrictions intensify." Most dovish BoC forward guidance since the current hold cycle began. Result: BoC in stagflationary paralysis. Fed pricing a hike at 40%. Forward curves diverging further. BoC-Fed differential structural, not just cyclical. AUDCAD at 0.9773 — below 1.000 for 21 consecutive sessions. USMCA discount: structural and persistent. Bull confirmation: daily close above 1.4099. Targets: 1.4099 → 1.4139 → 1.4200. Invalidation: Iran MOU approved. Warsh FOMC June 16-17 is the gating event. Conviction: Medium-High Bull.

USOIL — Sixth Consecutive Draw, Iran Fires Missiles, Lebanon Complicates the Deal, and $92 Is the Floor That Matters

USOIL — Sixth Consecutive Draw, Iran Fires Missiles, Lebanon Complicates the Deal, and $92 Is the Floor That Matters

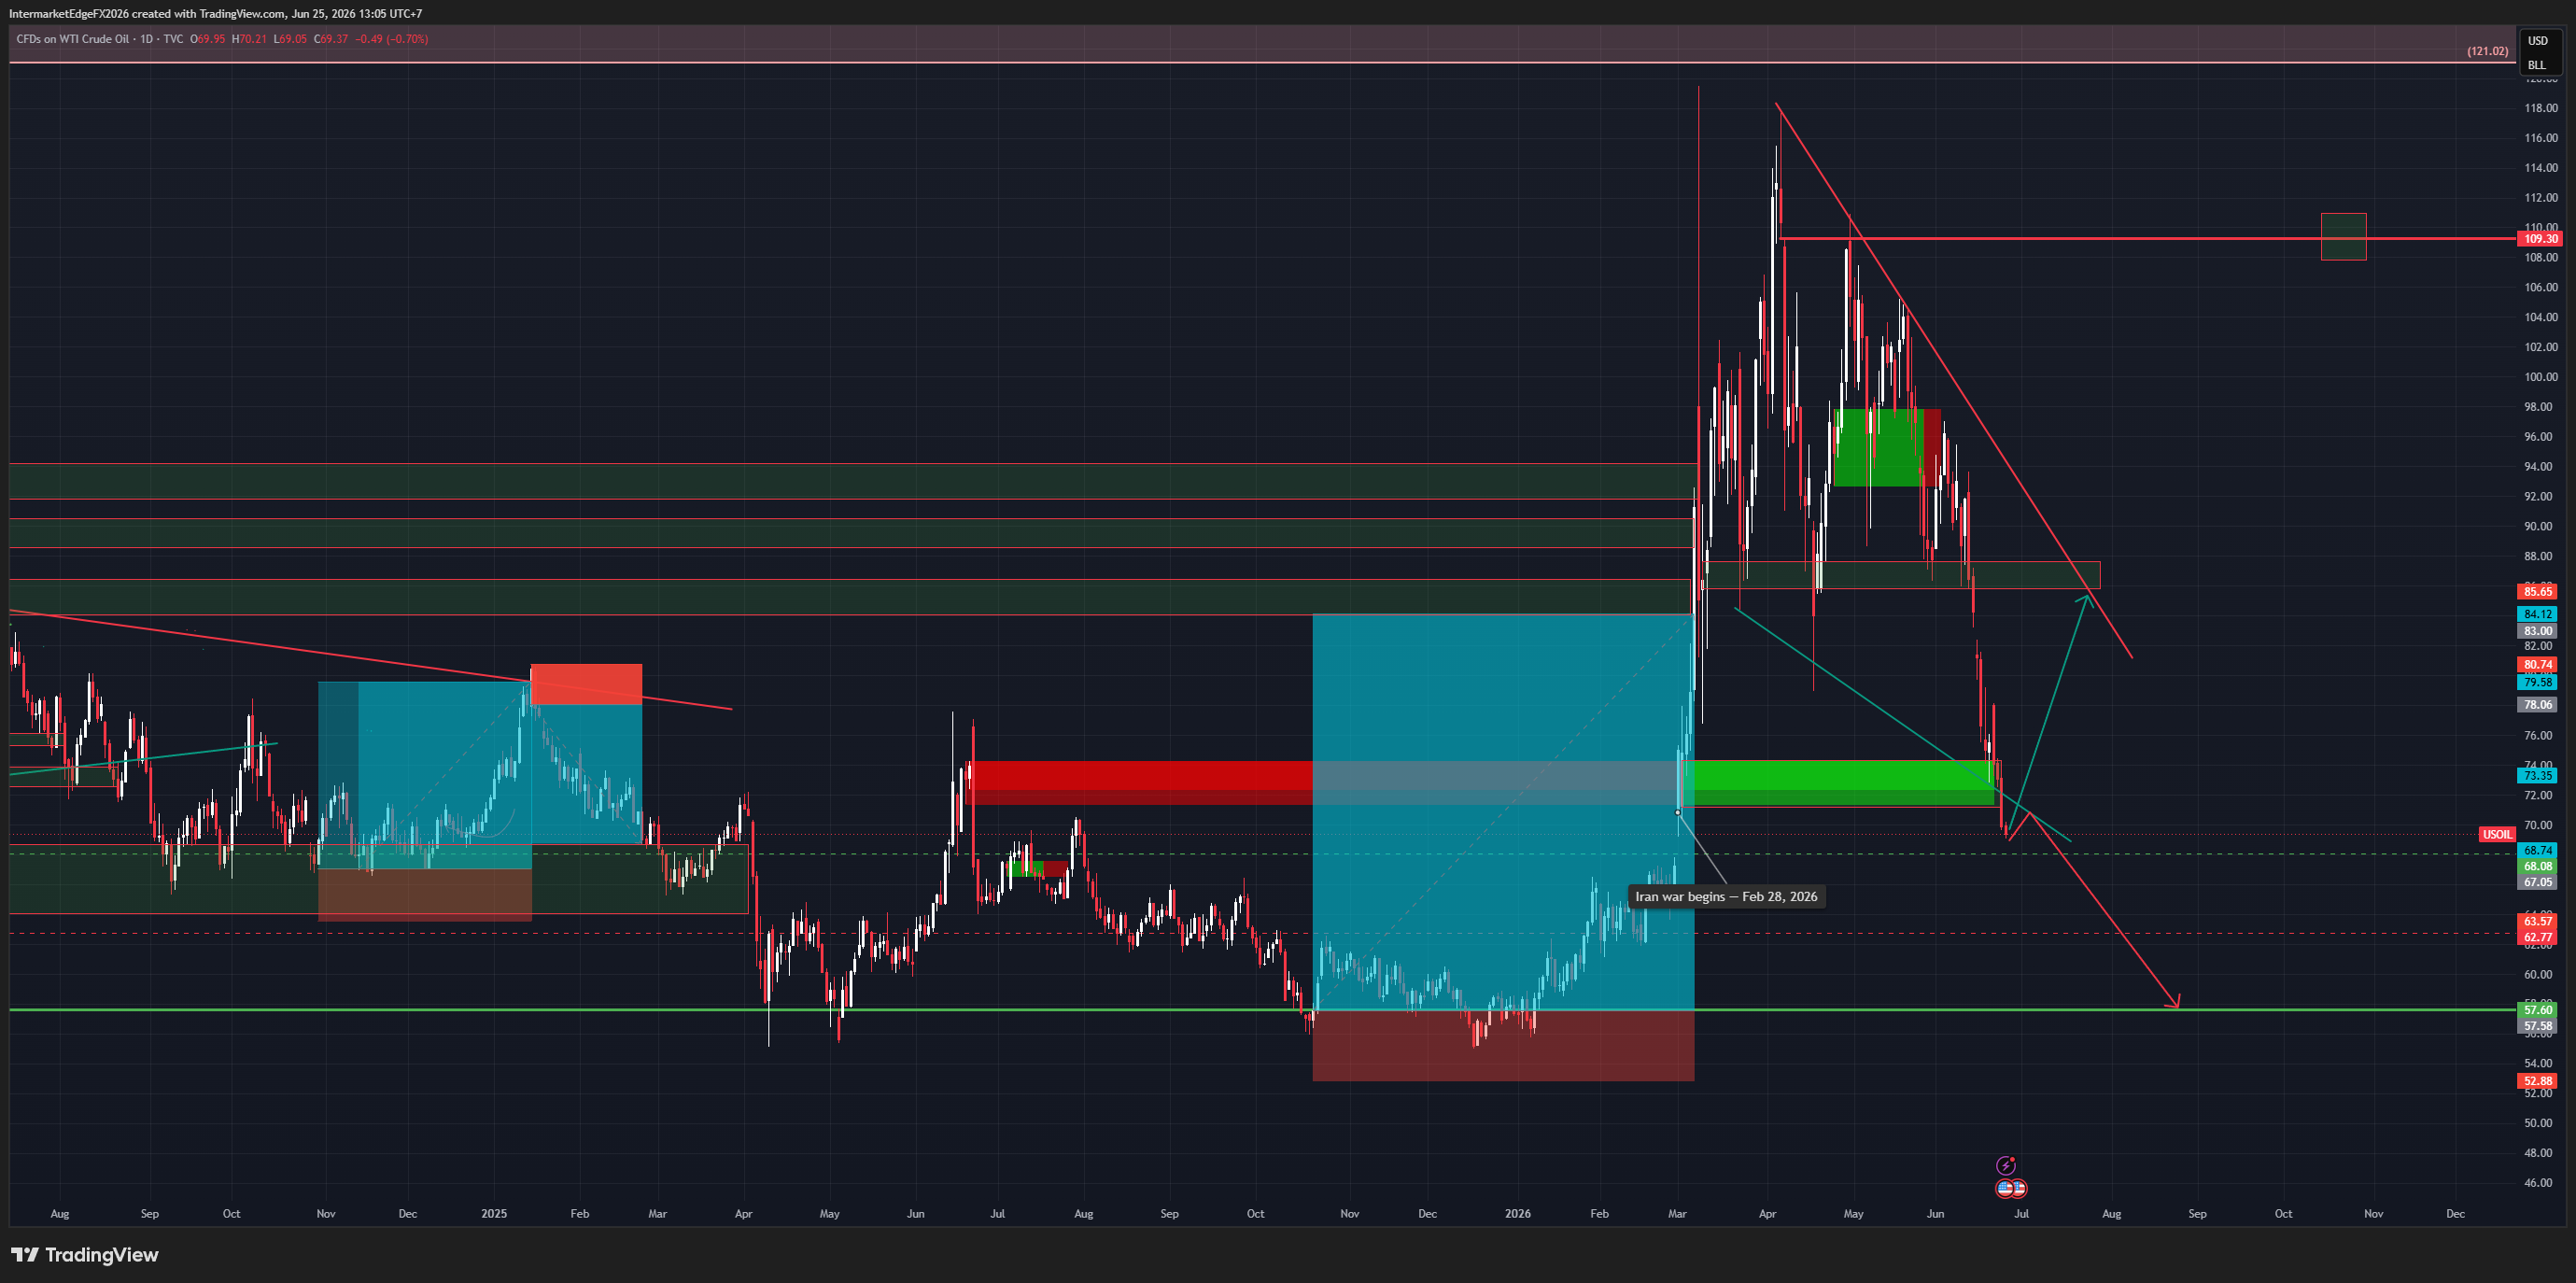
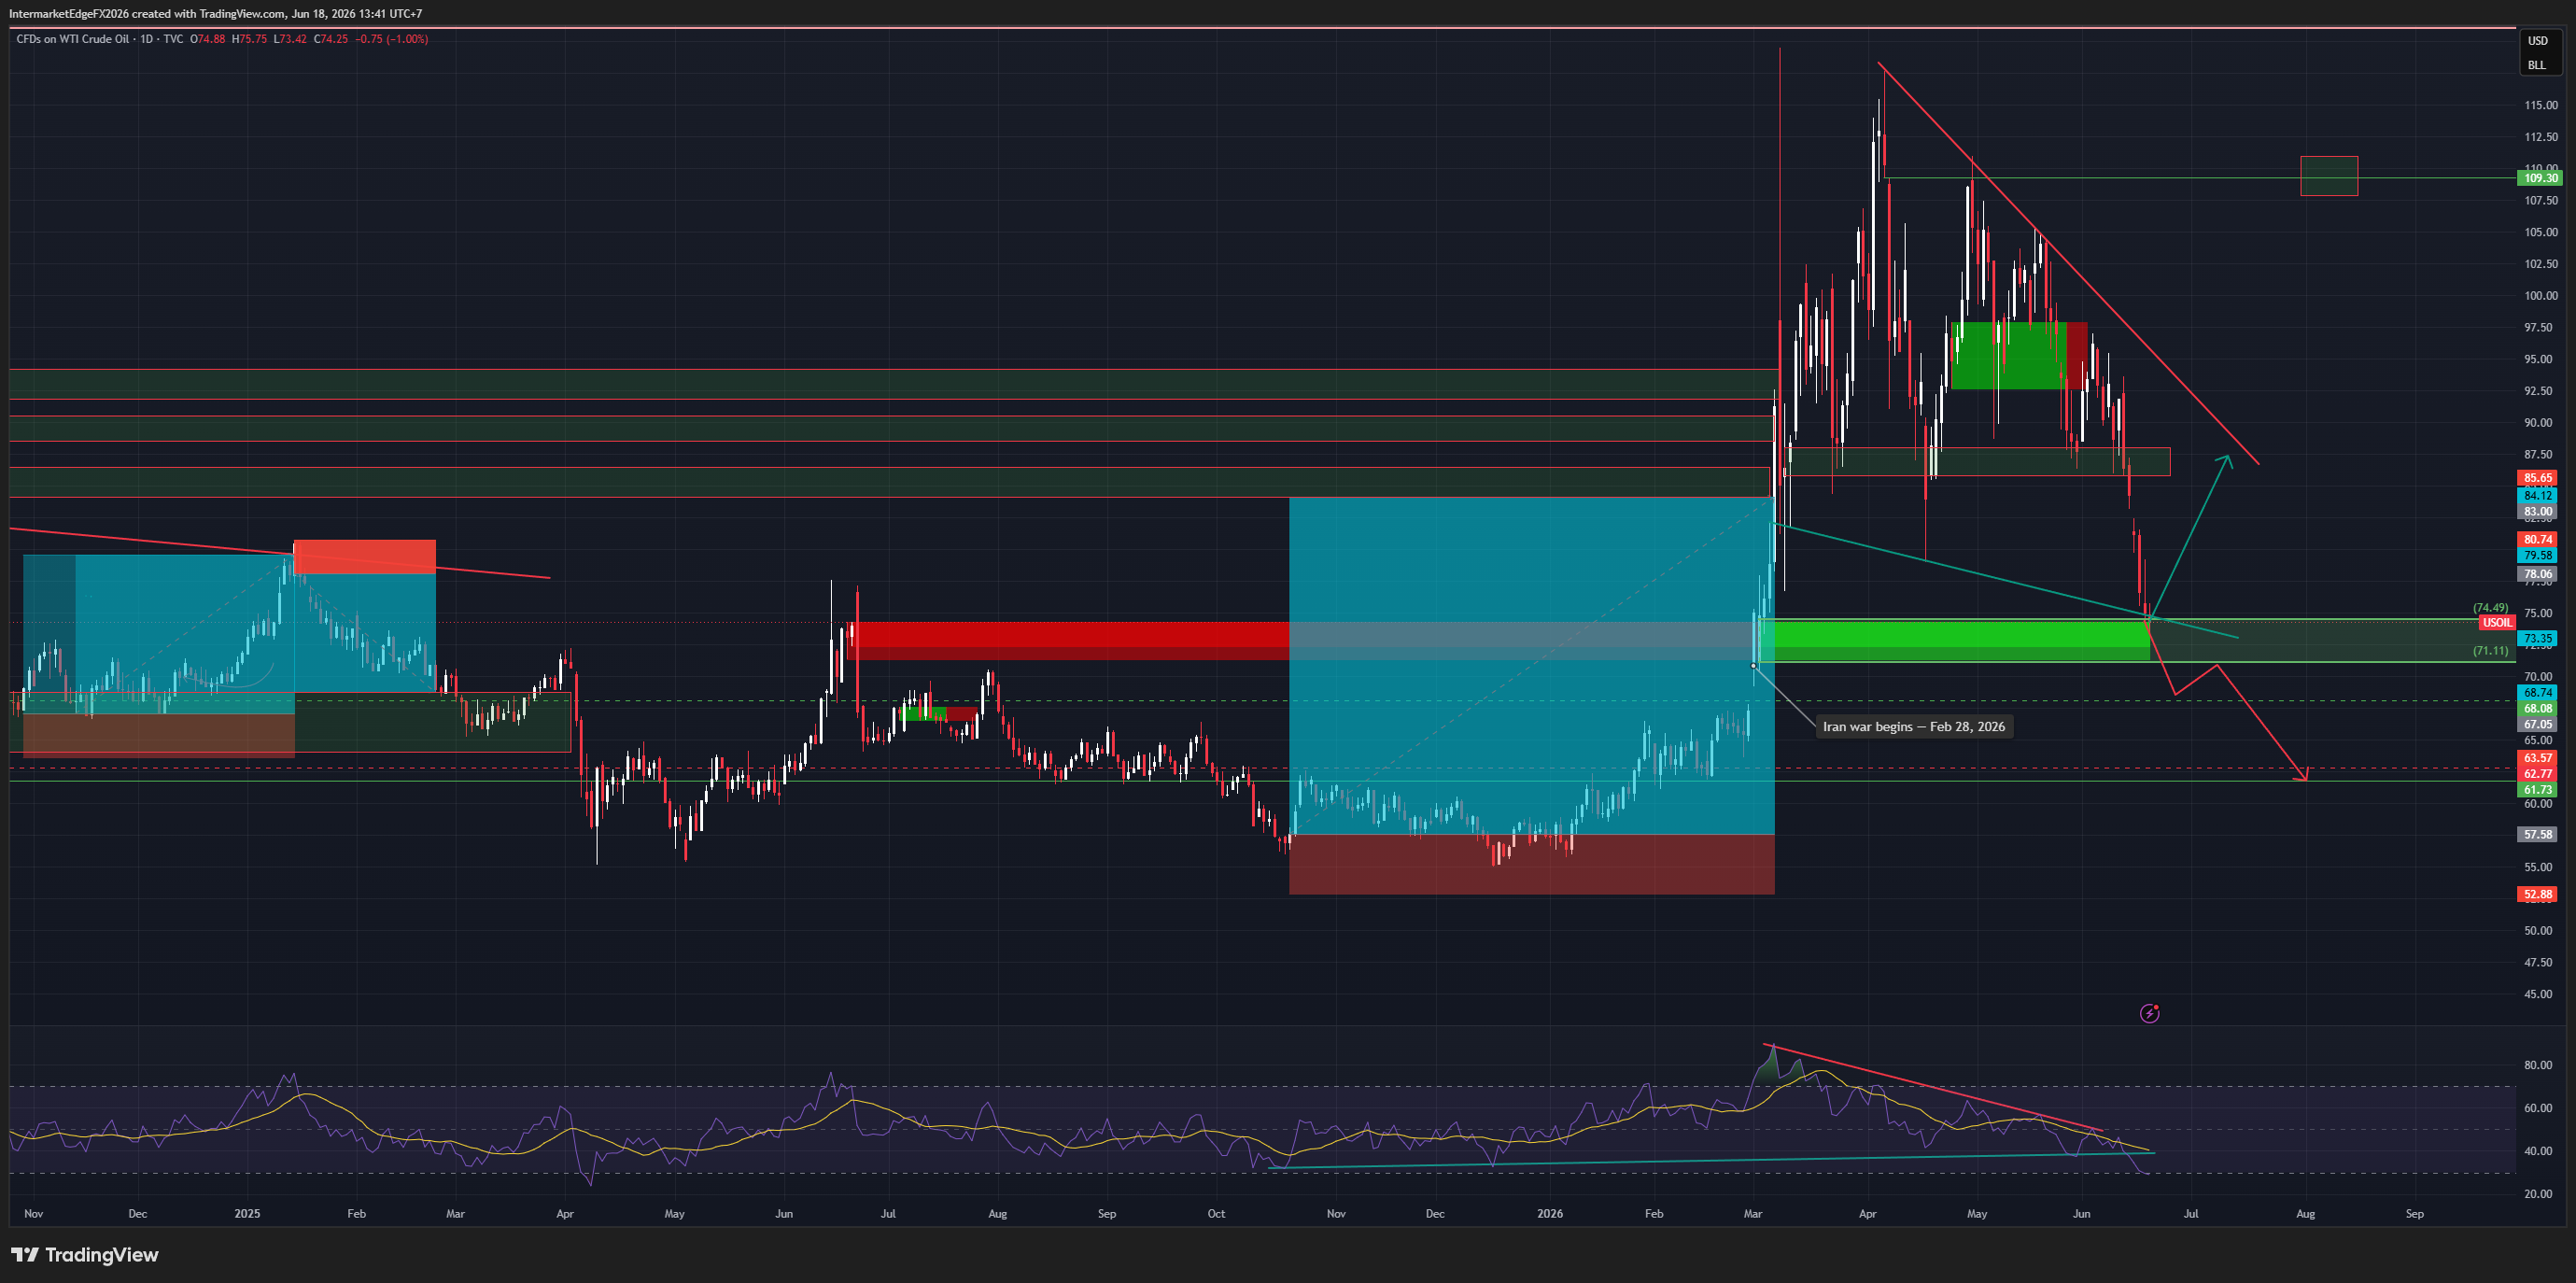
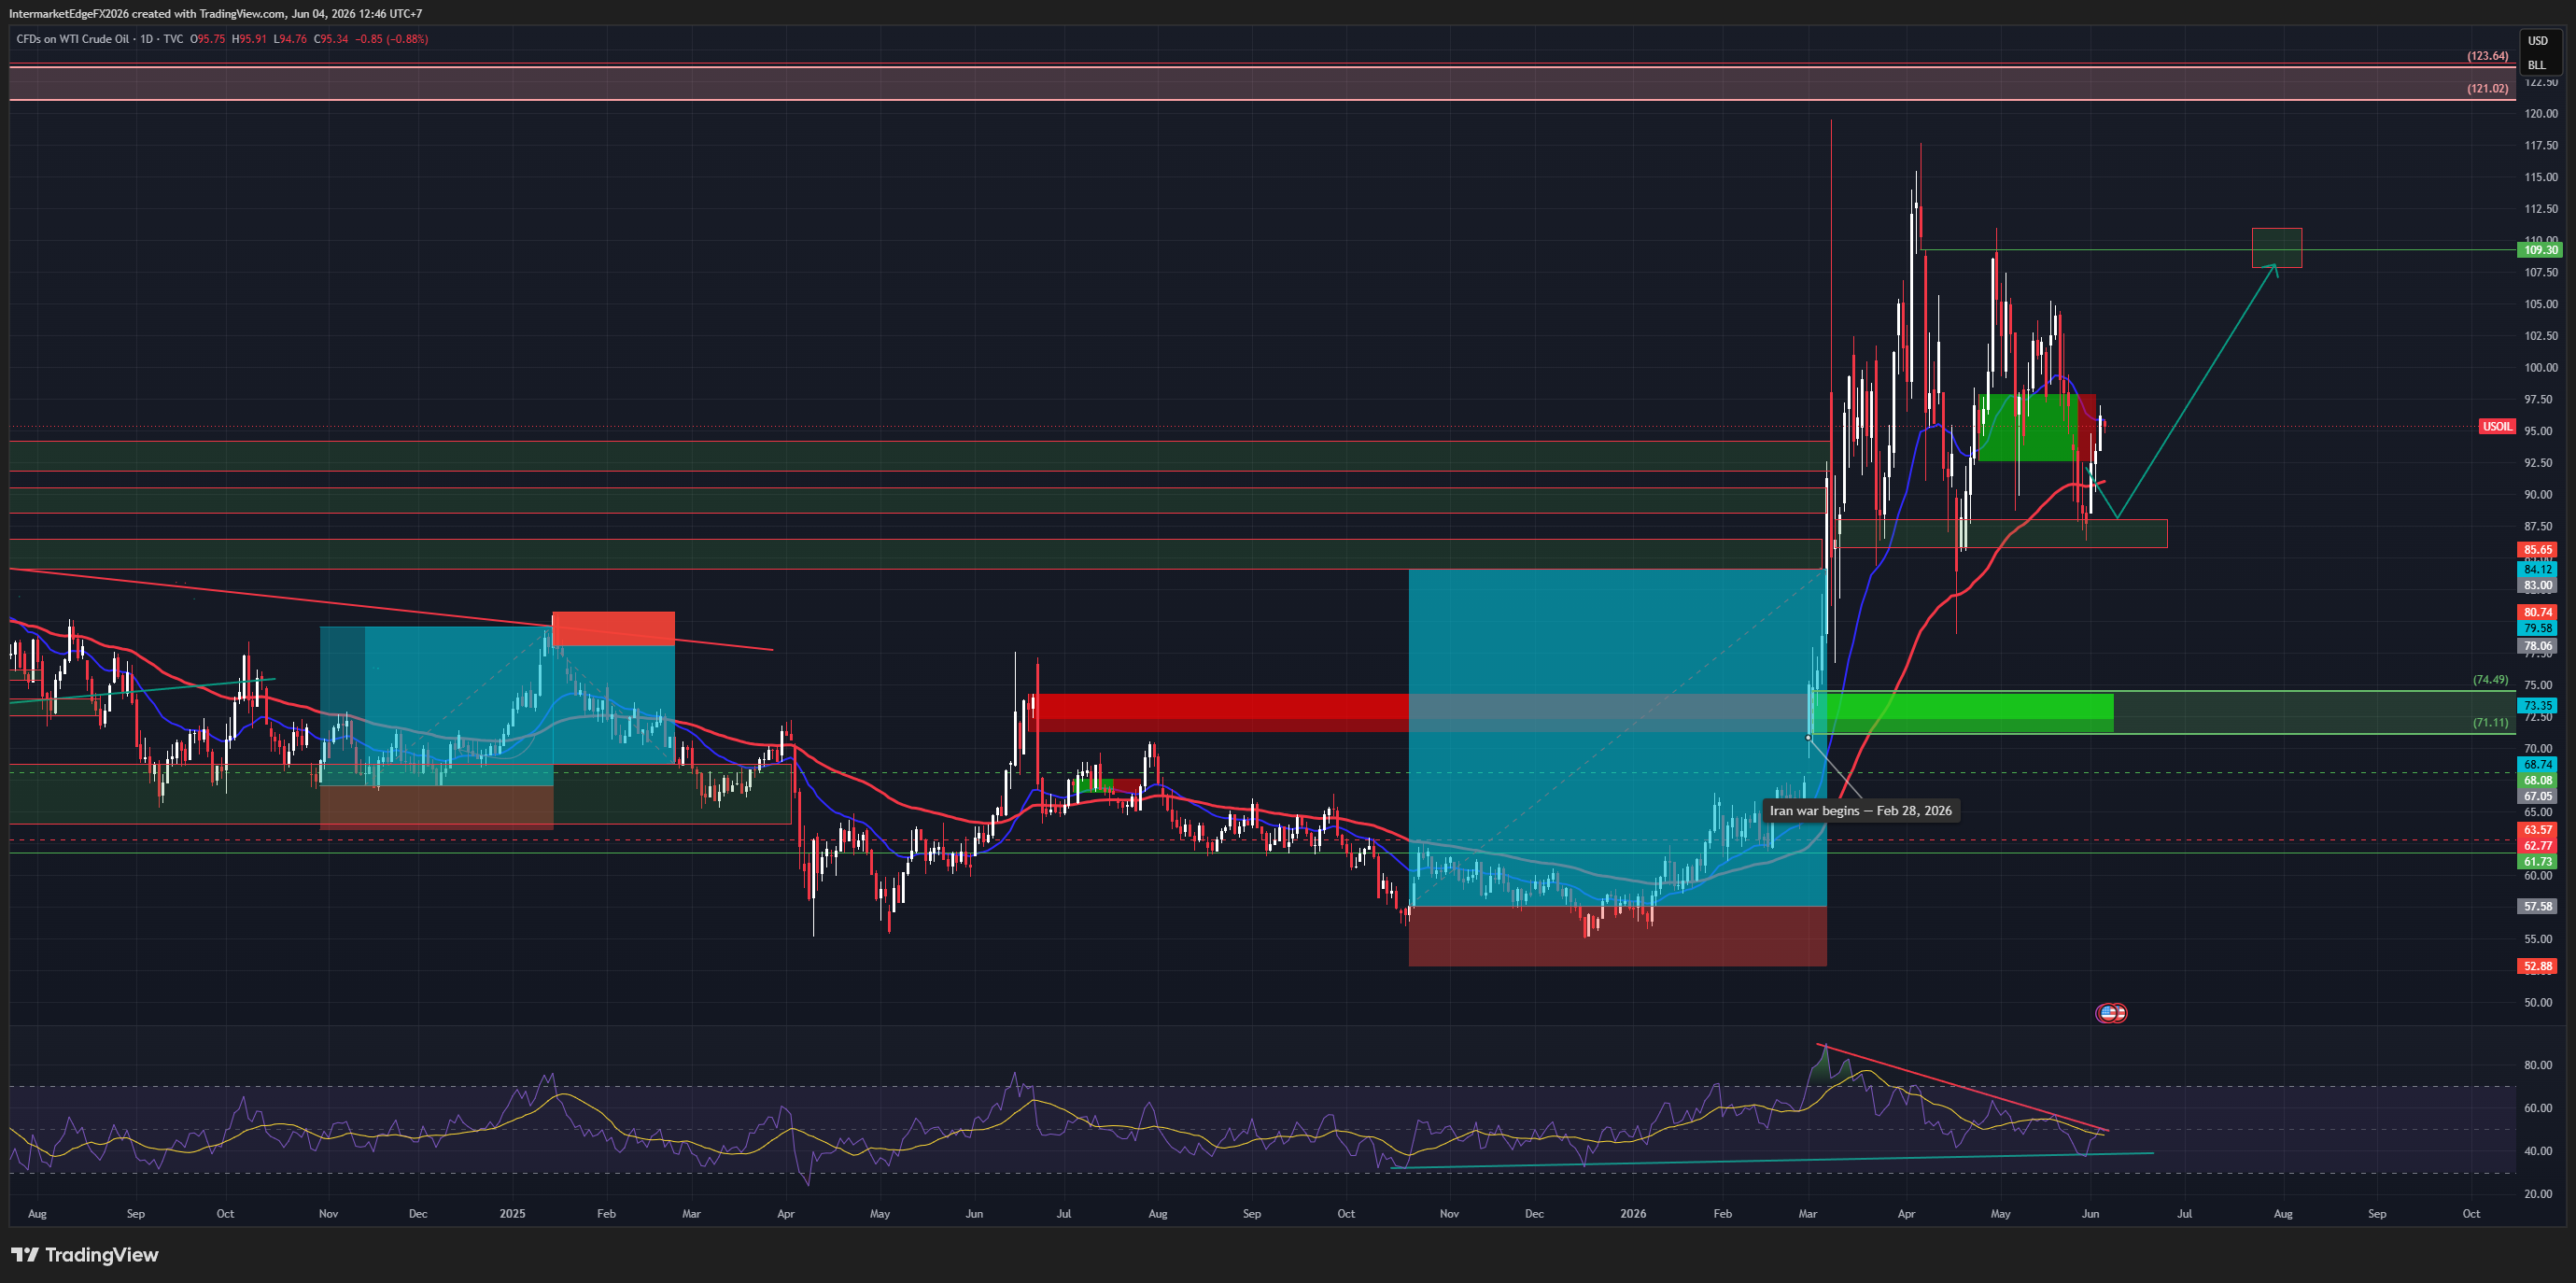
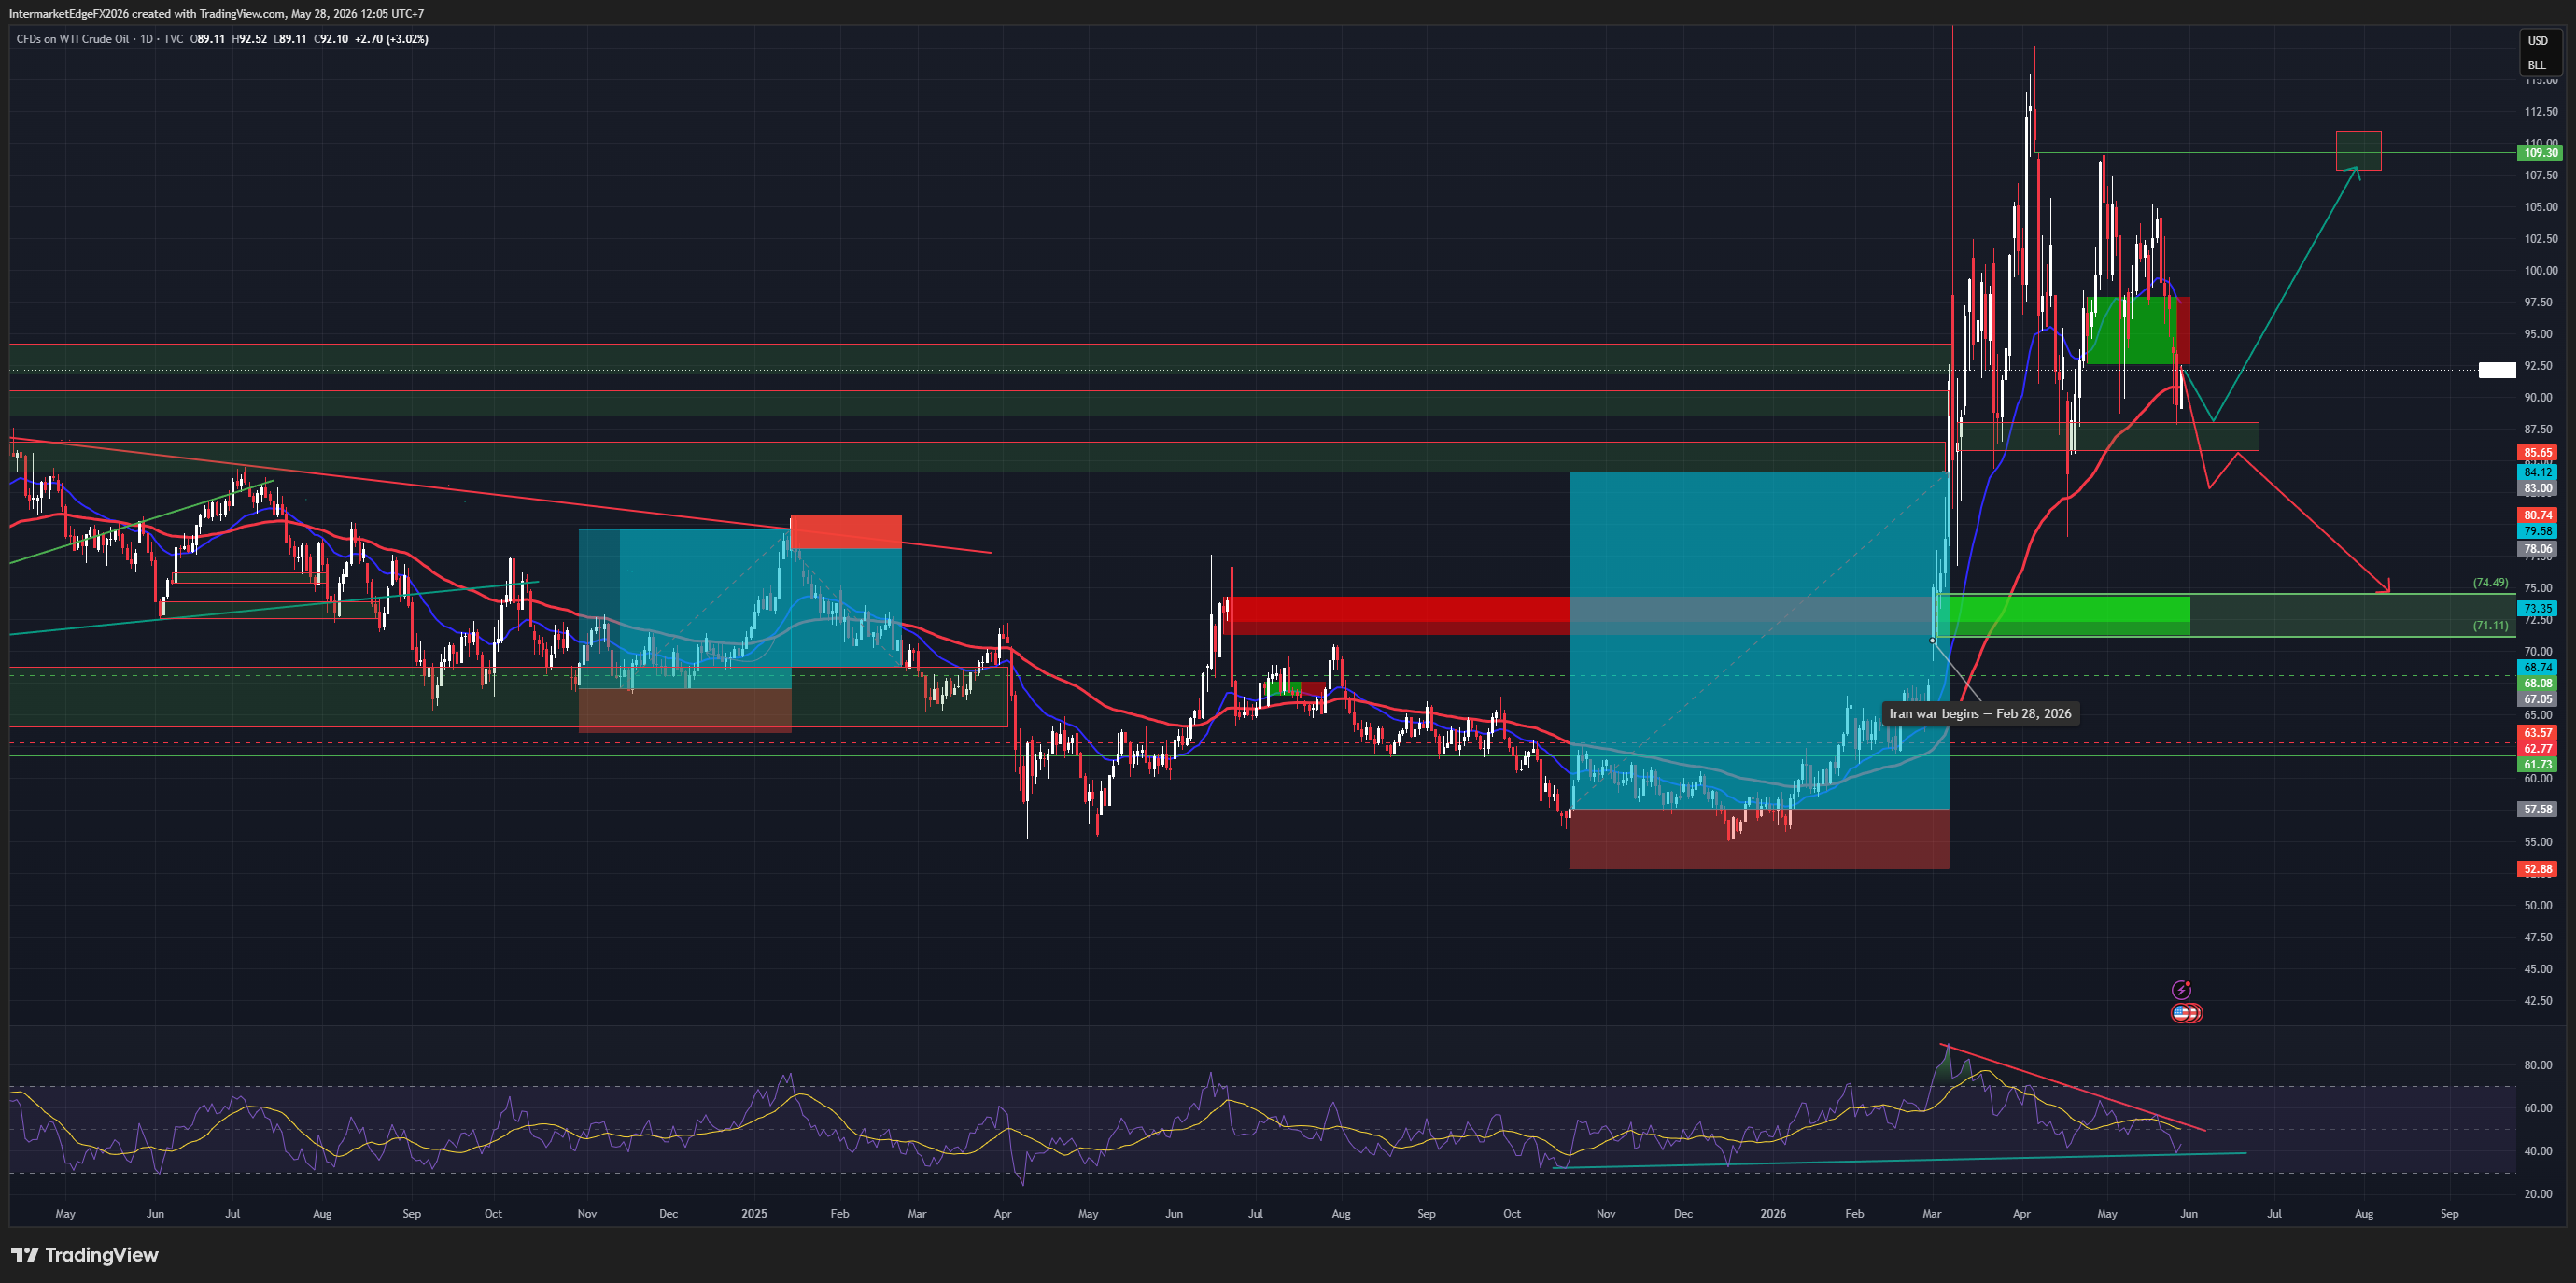
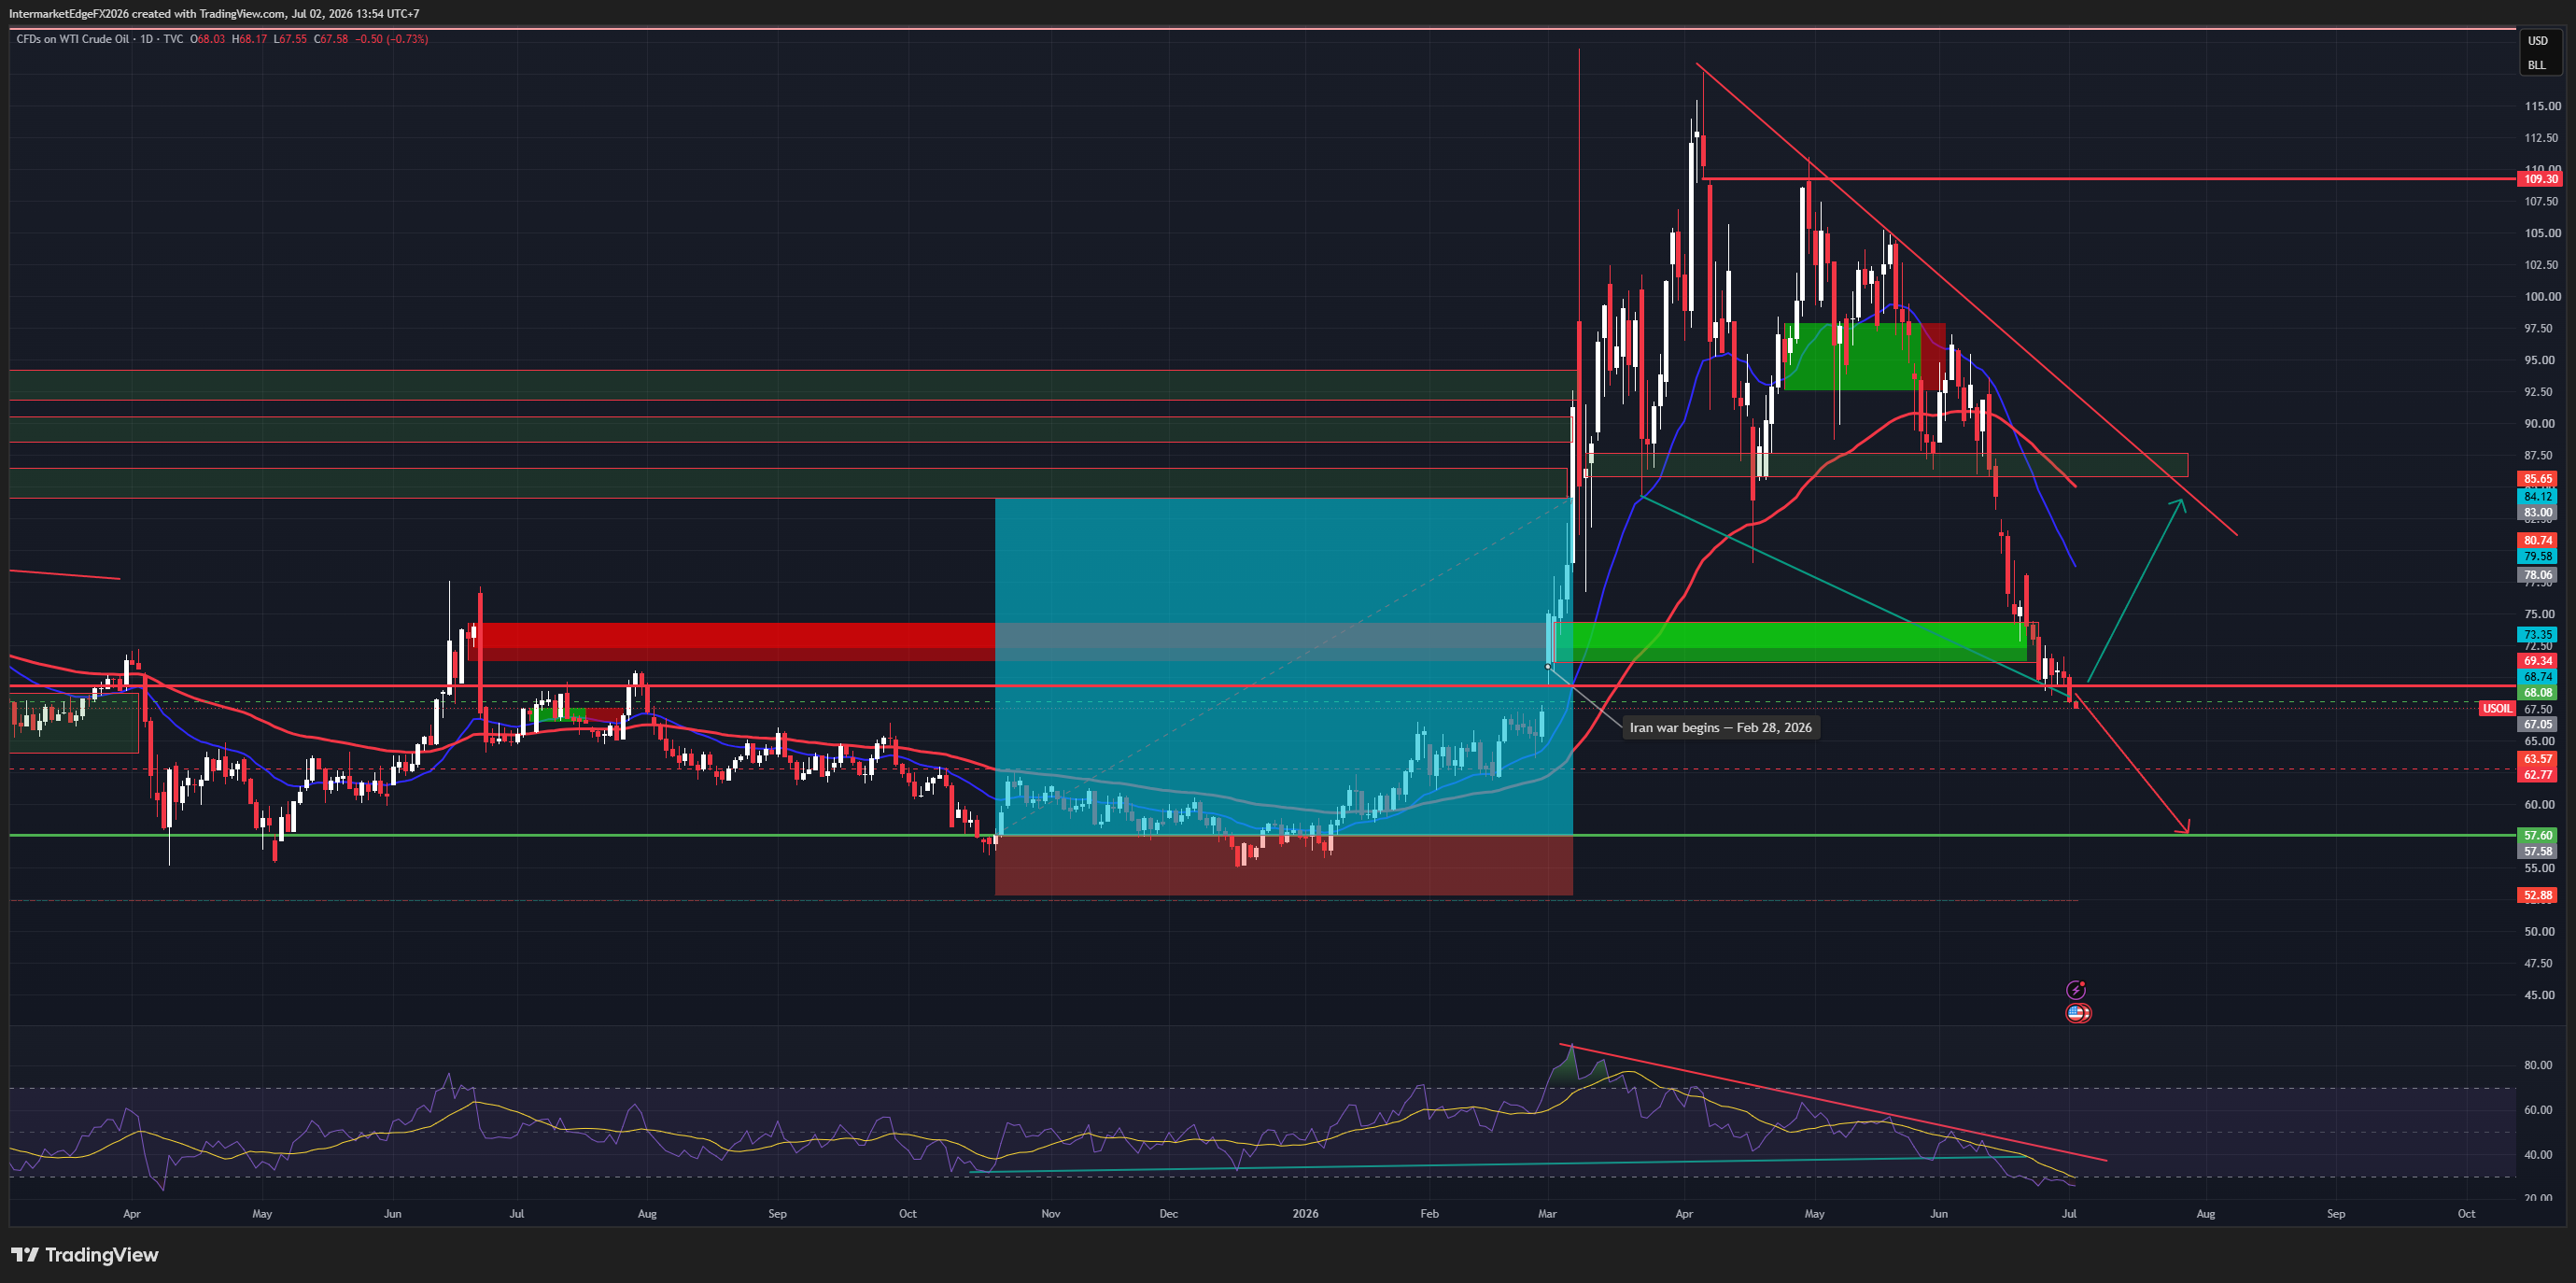
USOIL $95.33 | EIA -7.974M bbl | 04 June 2026 The most bullish EIA print of the current cycle just dropped. Six consecutive weekly draws. Distillates at a 23-year low. The supply picture is unambiguously tightening. And WTI is falling anyway. That is the paradox defining the oil market today — and understanding it is the key to positioning correctly. The EIA draw of -7.974 million barrels for the week ending May 30 was nearly three times the forecast of -2.900M. At current draw rates, US crude stockpiles approach the five-year minimum range within four to six weeks. This is the fundamental floor argument for WTI holding $90-92: the supply picture does not support a rapid decline to the bear targets of $74-71 without either a demand collapse or a full Hormuz reopening. The reason prices are falling despite this data is the Iran-Lebanon nexus. Tehran has conditioned any deal progress on a halt to Israeli operations in Lebanon. Israel has continued strikes despite Trump personally asking Netanyahu to hold back. Iran launched ballistic missiles. US forces struck Qeshm Island in retaliation. Iranian state media says message exchanges with Washington have been suspended. The deal is not dead — Trump insists talks are active — but it is in its most fragile phase since the April 8 ceasefire. The $100-102 resistance has failed twice this week. The $92-97 consolidation zone is the current equilibrium. The $88-92 floor is where supply fundamentals provide genuine structural support. Bear targets if deal completes and Hormuz reopens: $74.49 → $71.11. Invalidation: daily close above $102. Conviction: Medium, Neutral-to-Mild Bear. Timeline extended 2-4 weeks by Lebanon complication.

USOIL: Iran Deal Decompression Meets OPEC+ Supply Unlock - EIA Crude Draw of 7.9M bbl Confirms: Today's Bounce Is Fundamental

USOIL: Iran Deal Decompression Meets OPEC+ Supply Unlock - EIA Crude Draw of 7.9M bbl Confirms: Today's Bounce Is Fundamental

WTI is up 3% today. The reason is not what you think. Everyone is calling it a "deal waver" bounce. They are partially right. But there is a more important number underneath that headline. EIA crude draw: -7.9M bbl. Week ending May 15. That is not a technical bounce. That is demand outpacing supply by a significant margin even as Iran deal decompression has been pulling prices lower for 10 straight days. Here is what that number means in context: Brent fell from $111.27 on May 18 to $93.23 yesterday. That is $18.04 in 9 days - the market was aggressively pricing a deal. But demand never blinked. Commercial crude stocks at 445.0M bbl, down from 452.9M. Gasoline also drew down 1.5M bbl. Consumer demand intact. This changes the bear thesis. Not the direction - still bearish toward $74-71 when the deal materializes. But the timeline. Strong demand means WTI will not collapse in one day after a deal signing. The $88-92 demand zone is a real floor, not just a technical level. The battle for Q2-Q3 2026 oil price is now clear: Bear side: Iran deal + OPEC+ adding +411kbpd from June = double supply pressure Bull side: EIA draws showing demand running well above pre-war equilibrium Neither side wins cleanly. Which is why WTI oscillates rather than trends. The one level that matters above everything else: $88. Hold above it and the bounce targets $97-100. Break below it - which requires both a large EIA build AND confirmed deal progress - and $74.49 is next. Tonight at 23:30 GMT+7, EIA releases week ending May 22 data. That is the tell. Large draw again = demand floor is structural = bounce is real. Large build = prior week was seasonal = bear resumes. This is the anchor instrument for the entire macro series this week. Oil is not a consequence of the macro regime. Oil is the cause. Conviction: Medium-High bounce near-term. Medium bear medium-term. #USOIL #WTI #CrudeOil #IranDeal #EIAInventory #OilPrice #MacroAnalysis #OPEC #Stagflation #IntermarketAnalysis

Stay in the loop

Get notified about new research, macro insights, and market analysis.

InterMarketEdge

© 2026 InterMarketEdge. Financial intelligence for inter-market traders.