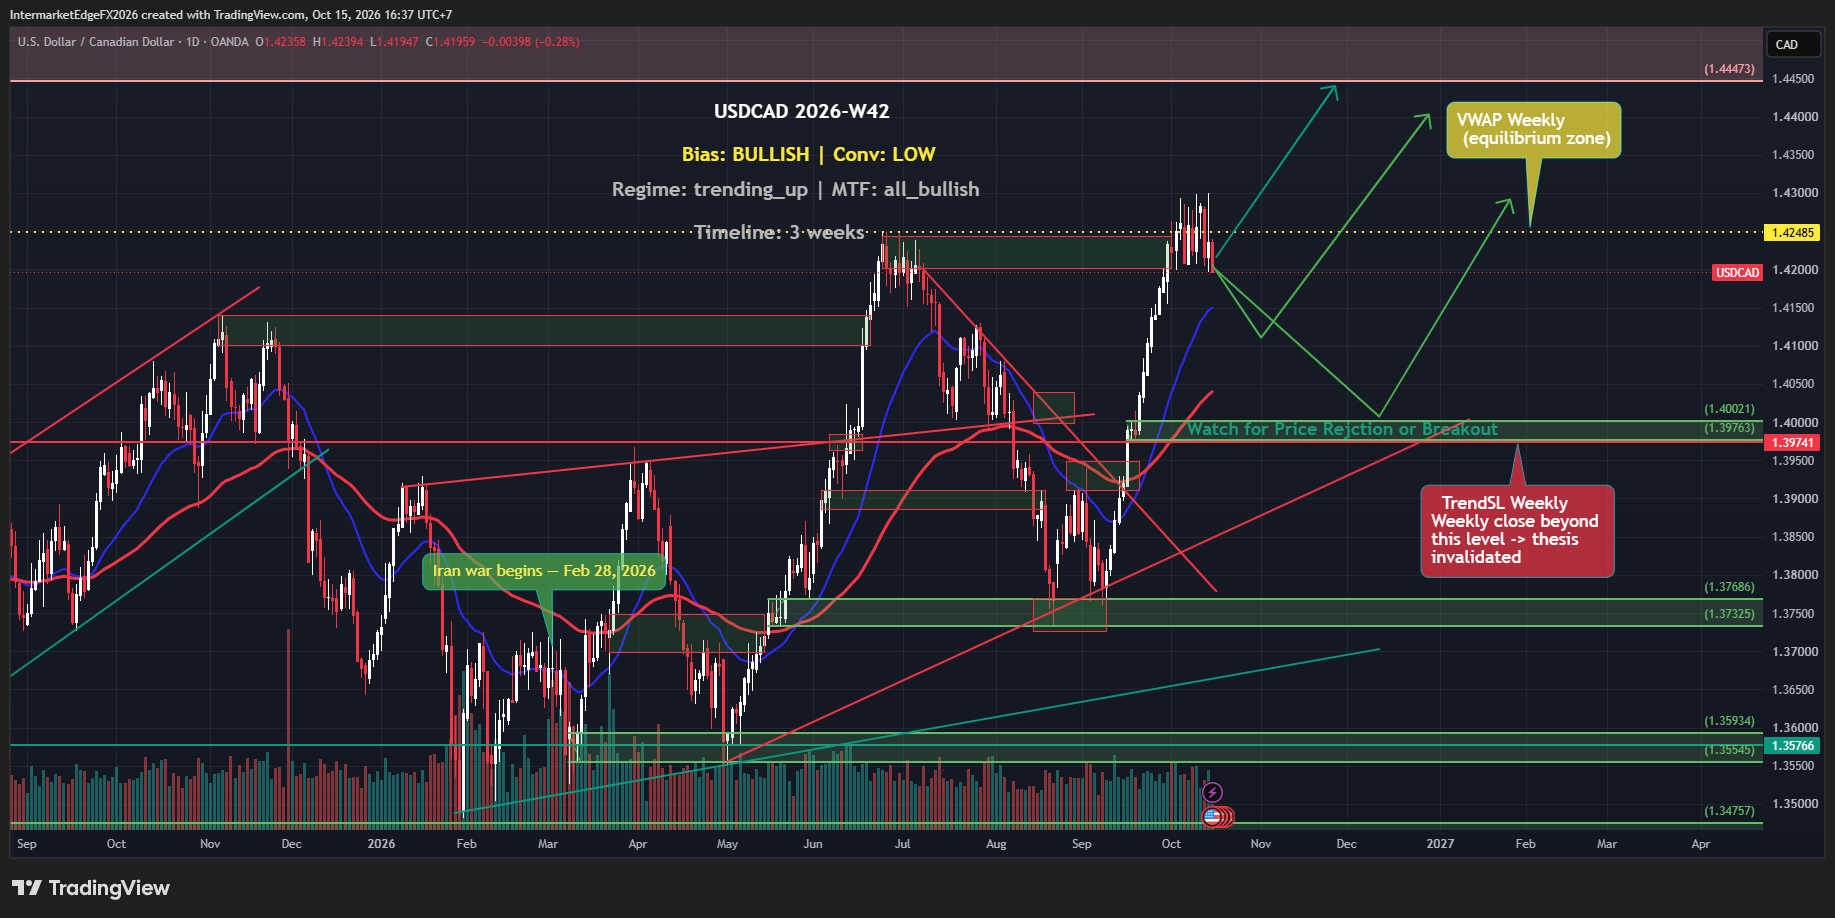
Tag: USDCAD — InterMarketEdge

Tag: USDCAD

USDCAD Week W36-2026: CAD Strengthens Despite a Hawkish Bank of Canada

USDCAD Week W36-2026: CAD Strengthens Despite a Hawkish Bank of Canada

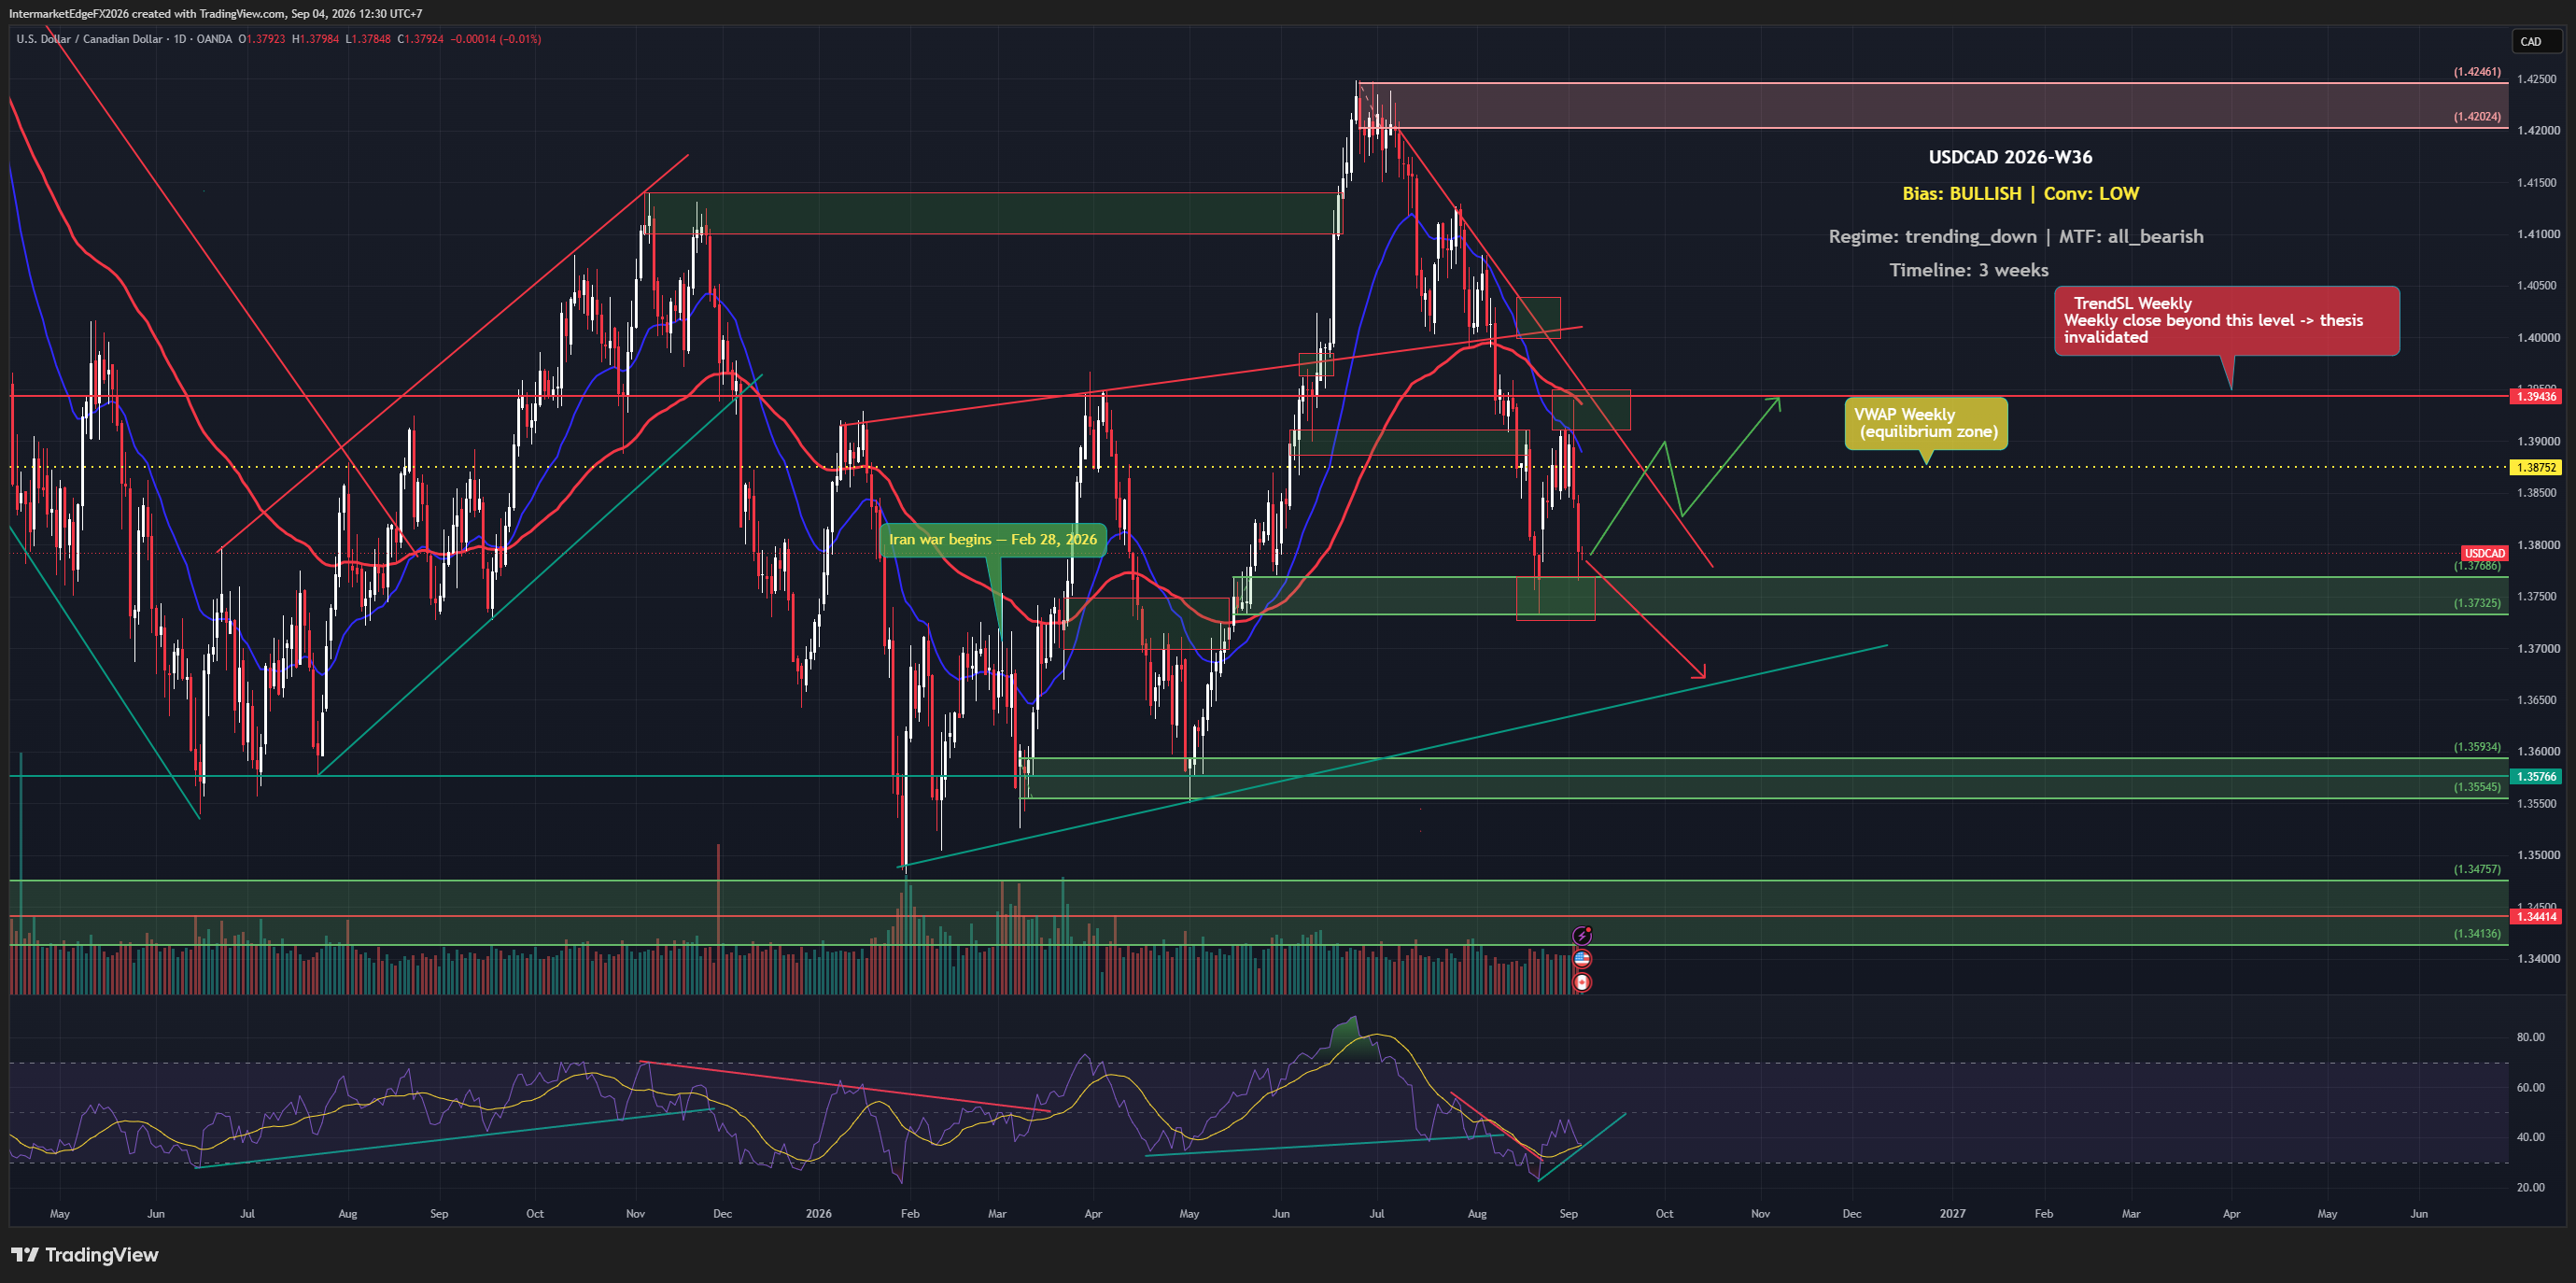
The Bank of Canada just signaled that persistent inflation could force multiple rate hikes, which on paper is a CAD-positive and USDCAD-negative catalyst. Yet as of Friday, 04 September 2026, the pair sits at 1.37896, below both its weekly VWAP and its trend stop-loss level, and the Canadian dollar actually strengthened in the latest session. When a hawkish central bank warning fails to lift the pair, that divergence between narrative and price deserves serious attention before any directional bet is sized. The directional call on USDCAD for this three-week window is bullish, anchored on two structural pillars: the Fed's hawkish posture lifting real yields and widening the rate differential against the BoC, and a COT positioning lean that tilts modestly in the dollar's favor. When the Fed keeps real yields elevated while the BoC sits on hold, the carry dynamic, the return earned by holding the higher-yielding currency, funded by selling the lower-yielding one, mechanically favors USD. That logic is coherent and consistent with past USDCAD behavior during Fed-BoC divergence cycles. The problem is that conviction here is deliberately low, and for reasons that go beyond a single data point. Two of the five analytical pillars, liquidity conditions and market sentiment, produced no usable signal this week. That silence does not mean those factors are neutral; it means the evidence base is incomplete, and sizing a position on three pillars when two are dark is a different risk than sizing on five. More critically, the price itself is already contradicting the thesis at its foundation: at 1.37896, USDCAD is trading below the weekly VWAP at 1.38752 and below the weekly trend stop-loss at 1.39429, meaning the technical structure does not support the bullish label, it actively contradicts it. The bullish bias reflects a macro and positioning overlay, not a technically confirmed setup. -- Intermarket Edge (Note: COT (Commitment of Traders) data is released weekly by the CFTC

USDCAD: Bullish Macro Label Meets a Bearish Price Structure

USDCAD: Bullish Macro Label Meets a Bearish Price Structure

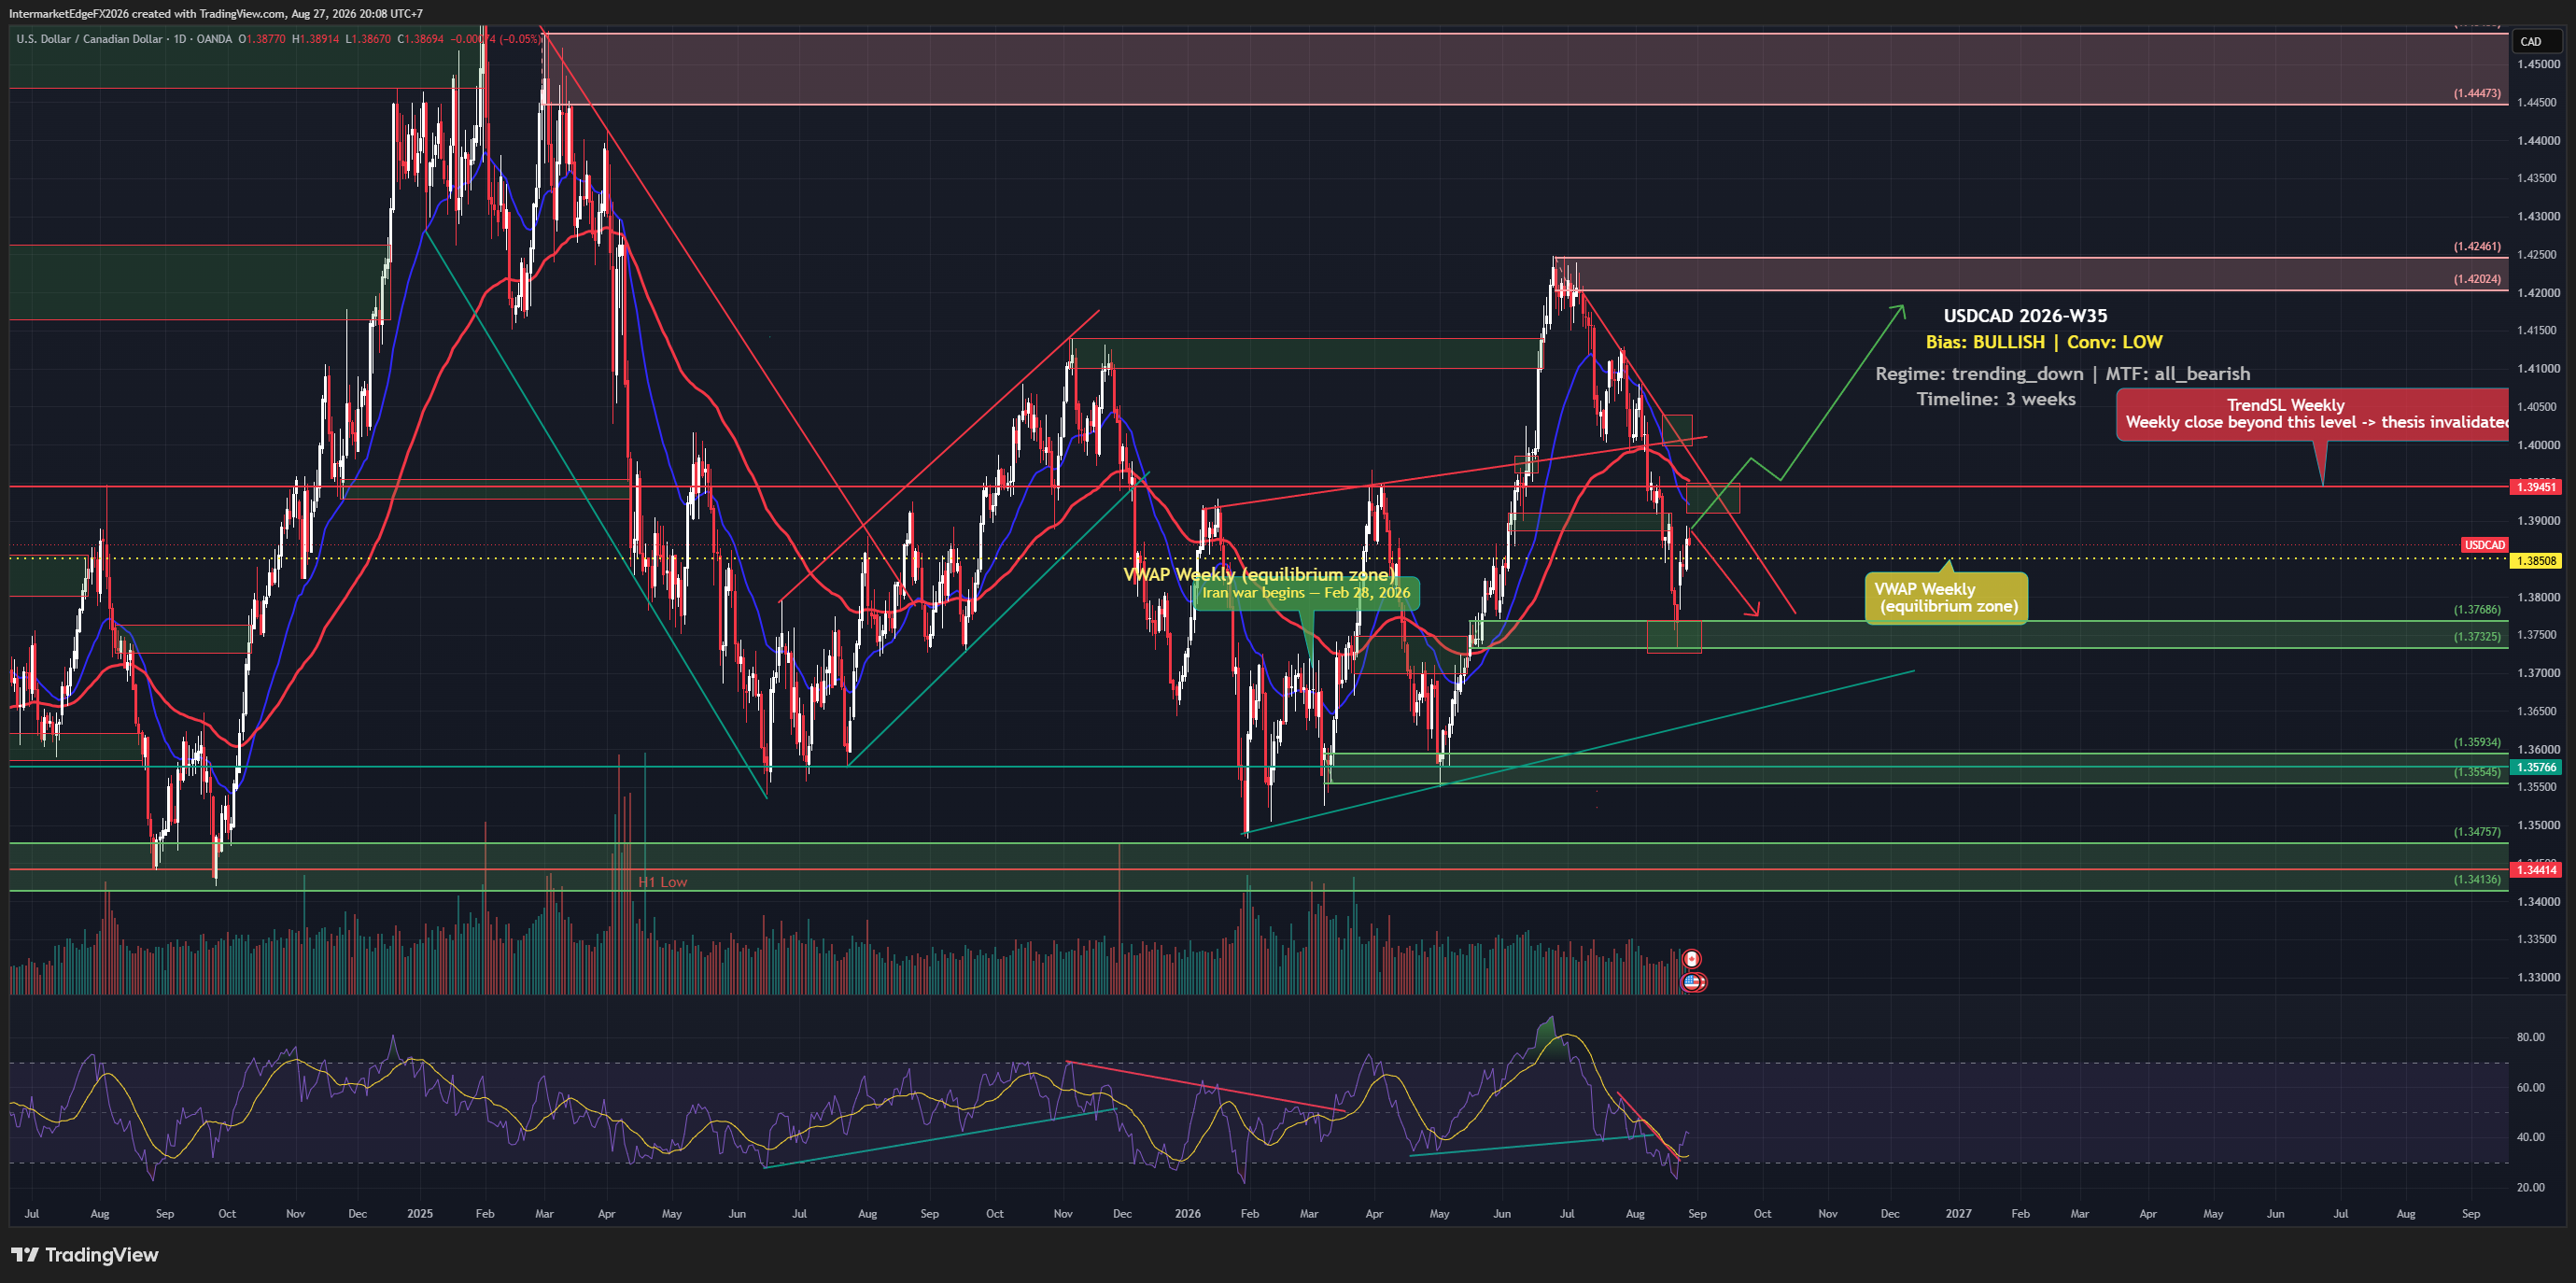
USDCAD is carrying a bullish bias into the final stretch of August 2026, but the pair is trading nearly 63 pips below the weekly TrendSL of 1.39451 as of Thursday, 27 August, meaning the technical structure does not yet support the label it has been given. The Canadian dollar hit a one-week low as a revived trade dispute rekindled economic worries, yet retaliatory tariffs from Canada quickly clawed some of that move back. That push-pull dynamic is precisely the kind of environment where calling a direction early is far easier than timing it correctly. The bullish thesis on USDCAD rests on a causal chain that begins at the Fed: sustained hawkishness has pushed US real yields to 2.32%, which supports dollar demand globally and feeds directly into USDCAD through the rate differential with the Bank of Canada. COT positioning data adds a secondary layer of confirmation, with commercial and speculative data skewing toward USD strength, though the brief does not specify the report week, net-position figure, or sample window, so this should be read as directional corroboration rather than a standalone signal. Macro and positioning therefore rhyme. What they do not resolve is the technical picture. This is where the thesis becomes genuinely complicated. At the time of writing, price at 1.38829 is already below the TrendSL weekly of 1.39451, and that condition was true from the moment the thesis was generated, not something that developed afterward. A bullish bias with price testing from underneath a declining trend stop-loss line is a structural contradiction: the same framework that produces the bullish label is simultaneously flagging that the technical evidence does not support it yet. The conviction level is accordingly low, and that is not a minor disclaimer, it is the honest read of a setup where macro and price structure are pointing in opposite directions. -- Intermarket Edge

USDCAD Week W34-2026: CAD Hits a 2.5-Month High, But the Bullish Case for USD Is Not Dead Yet

USDCAD Week W34-2026: CAD Hits a 2.5-Month High, But the Bullish Case for USD Is Not Dead Yet

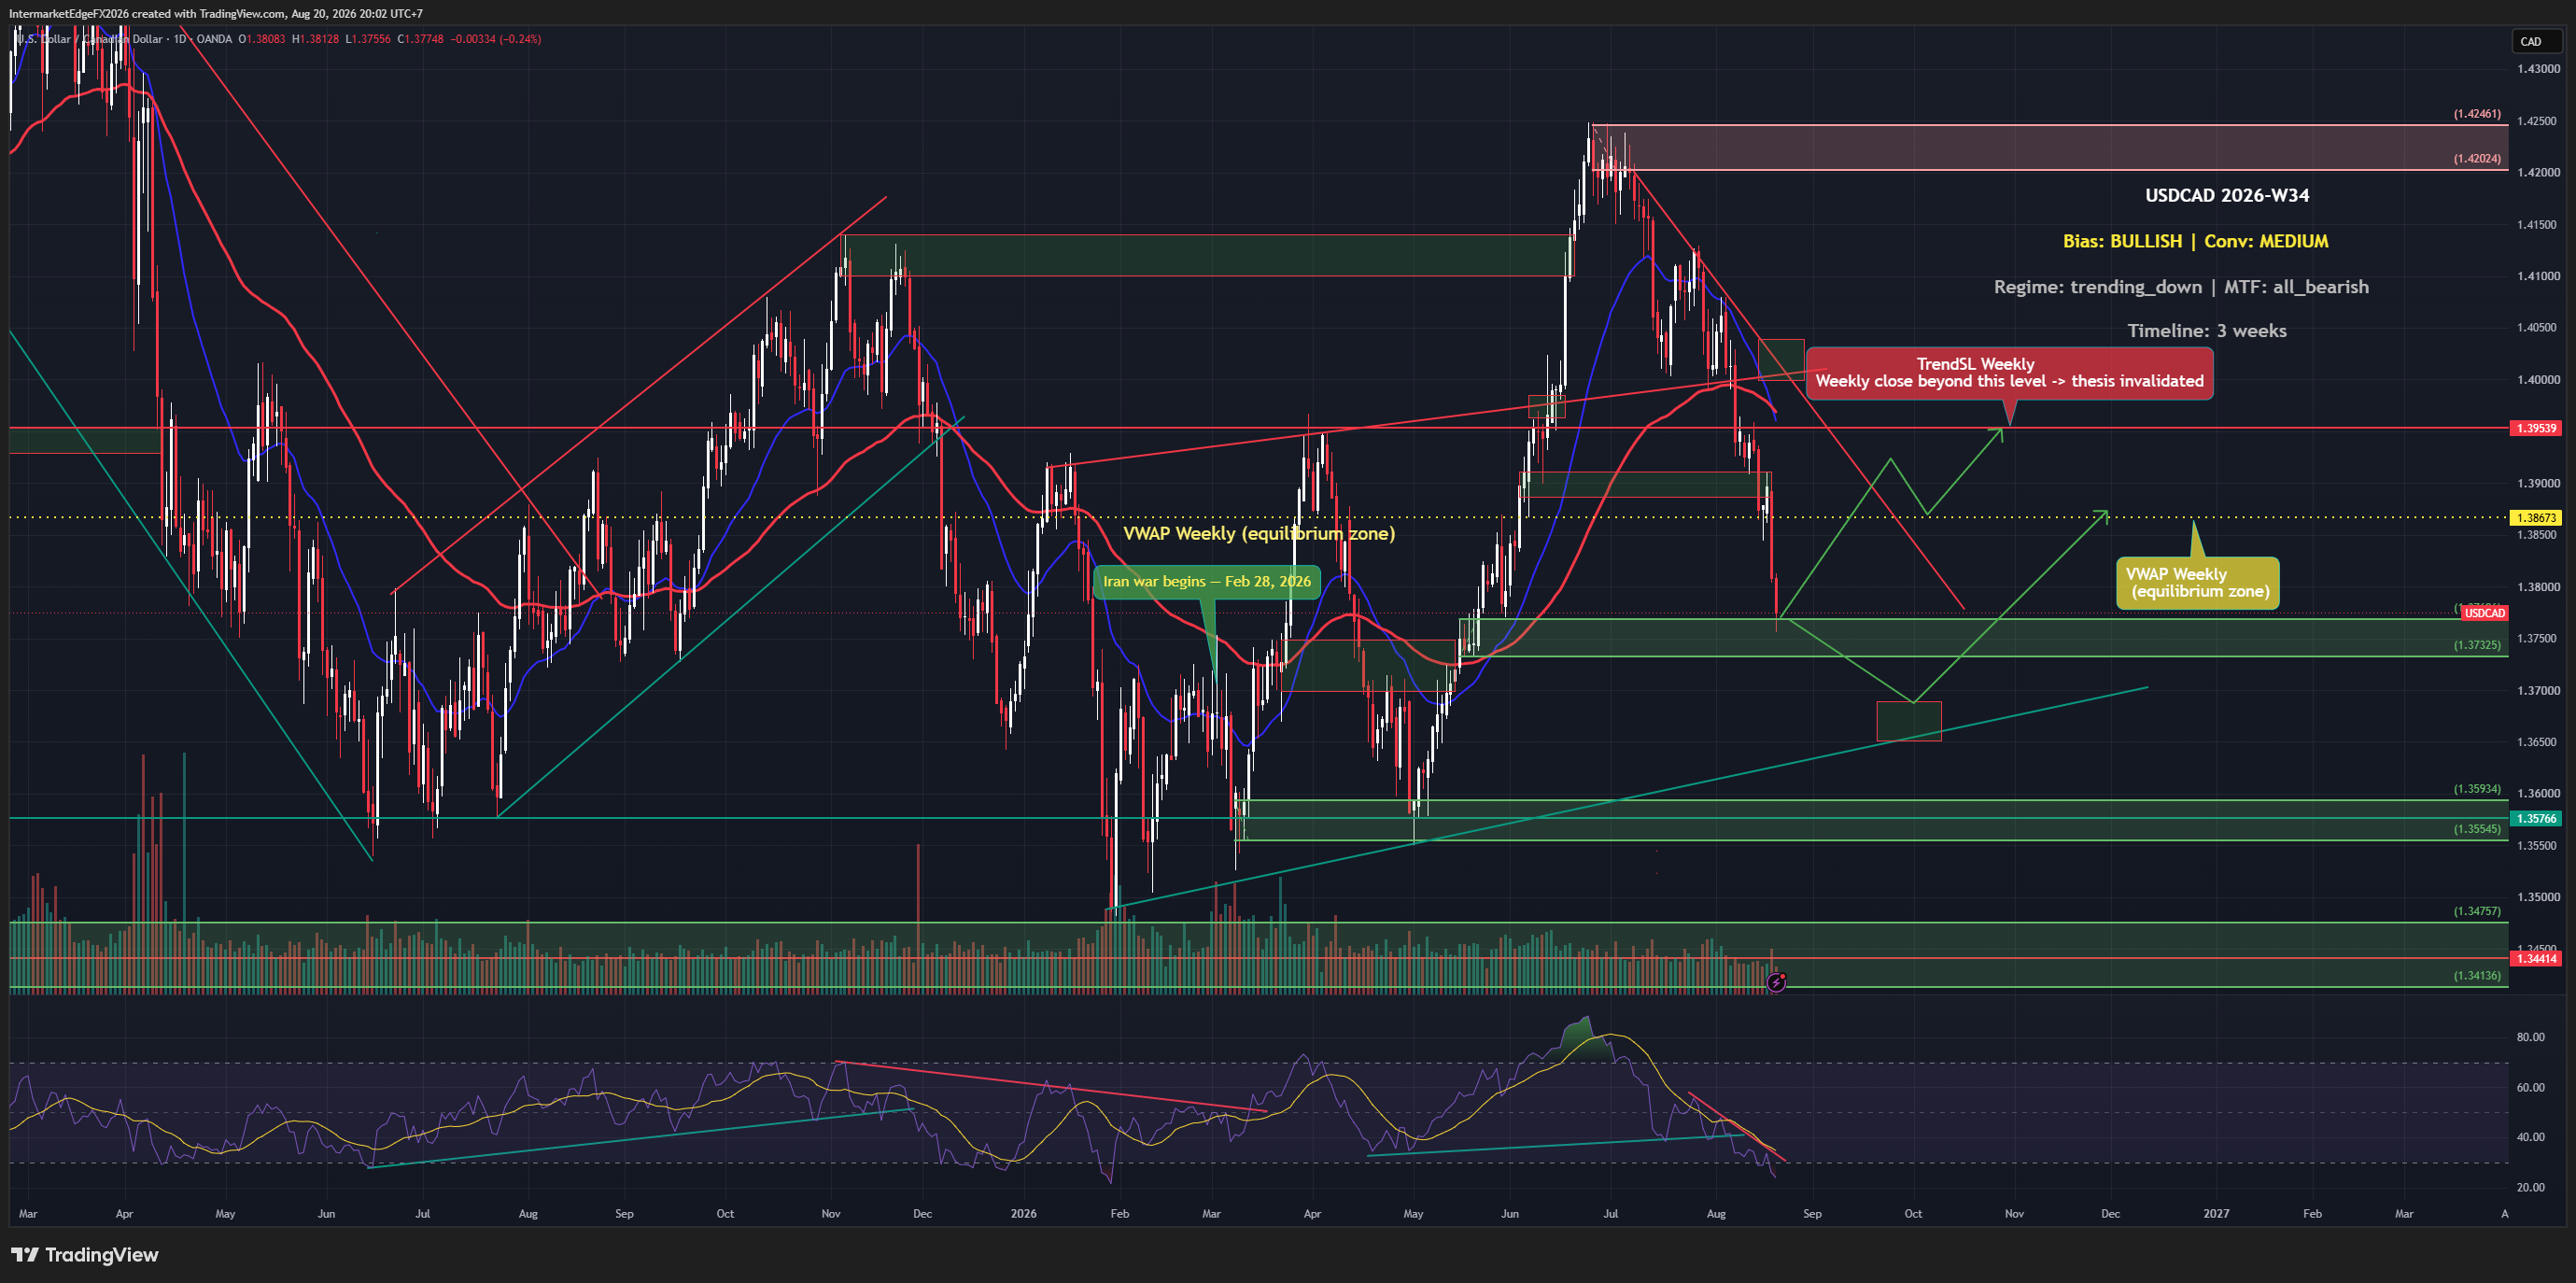
USDCAD is printing a bullish macro thesis this week, anchored by Fed hawkishness and rising real yields, yet as of Thursday, 20 August 2026, price at 1.37743 sits below both the weekly VWAP and the trend stop-loss level. The Canadian dollar just hit a 2.5-month high on a US tariff reprieve, and that headline momentum is running directly against the bullish USD framing. When macro and price structure disagree this sharply, the setup demands patience, not commitment. The framework carries a bullish bias on USDCAD this week, but that label comes with a structural caveat that matters enormously for how to read it. At the time the thesis was generated, the reference close of 1.37943 was already sitting below the weekly trend stop-loss at 1.39539, meaning the technical structure contradicted the bullish label from the outset. This is not a setup where price pulled back to test support after confirming the trend; it is a setup where the trend-defining level was never reclaimed in the first place. Treat the bullish designation as a framework-level view driven by macro and COT inputs, not as a technically-endorsed signal. The macro pillar is real: Fed hawkishness paired with a 2.41% real yield creates a genuine USD tailwind, and the rate differential does historically favor USD strength when the Fed is the more hawkish central bank. The COT picture adds a complementary angle, speculator positioning in CAD is at an extreme short, which historically precedes short-squeeze episodes where crowded trades unwind rapidly and push the currency higher than fundamentals alone would justify. COT crowding risk, as a concept, means that the more one-sided positioning becomes, the less fuel remains for the trend to extend, and any catalyst can flip the direction hard. -- Intermarket Edge (Note: COT (Commitment of Traders) data is released weekly by the CFTC with a reporting-period lag -- it is not a real-time position feed. See cftc.gov for the exact release schedule.)

USDCAD W33: The Bullish Thesis Is Still Waiting for Price

USDCAD W33: The Bullish Thesis Is Still Waiting for Price

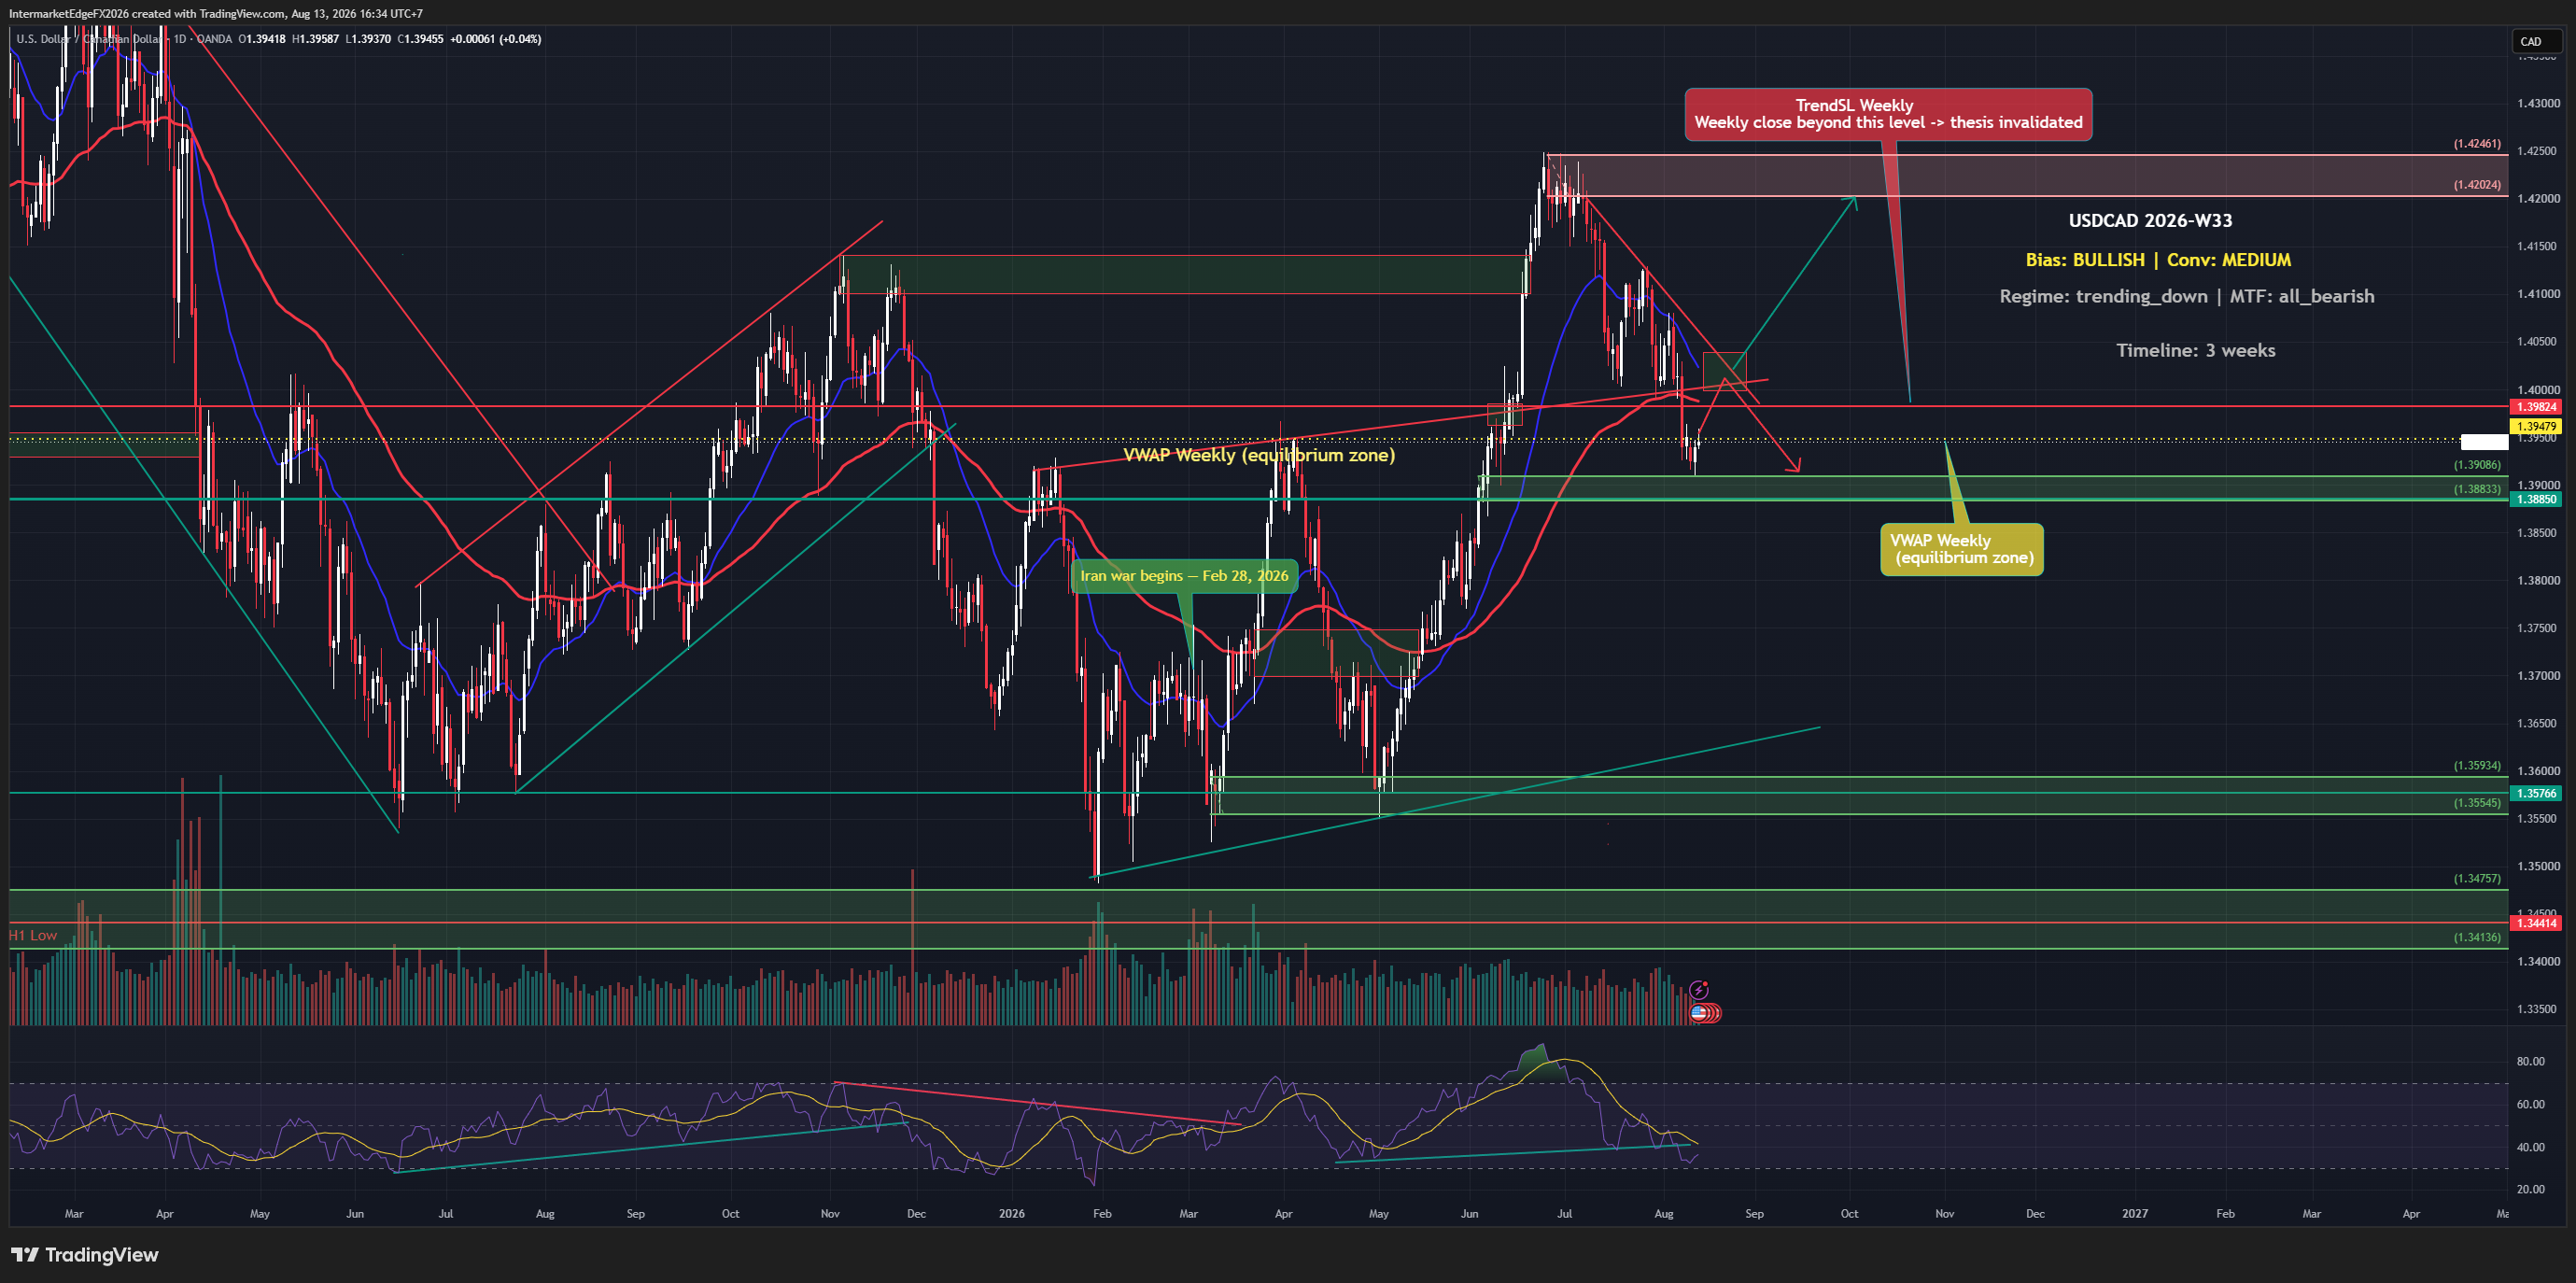
USDCAD carries a bullish bias into Week W33-2026, yet every timeframe is aligned against that label. A core CPI miss, actual 0.0% versus the 0.2% forecast, has already taken pressure off the Fed narrative, and the Canadian dollar hit a two-month high as oil prices rose. The bullish case is real but structurally unconfirmed, and that gap between label and structure is exactly where traders get hurt. The framework carries a bullish bias on USDCAD for the next three weeks at medium conviction, meaning there is a directional view, but the evidence is not strong enough to treat it as a high-confidence positioning decision. The core argument rests on two pillars: Fed hawkishness anchored by elevated real yields, and a persistent rate differential that historically favours USD over CAD. Those fundamentals have not collapsed; they have simply been pressured by this week's inflation data and Canadian-specific positive news flow. What makes this setup genuinely difficult is a structural contradiction that was present from the moment the thesis was generated: the reference price at thesis time (1.39479) was already sitting below the weekly trend stop level (1.39824). That means the bullish label was issued without technical confirmation behind it, the trend structure was already contradicting the directional call. Traders should treat this as a low-confidence rule-engine override, not a textbook bullish setup. Compounding this, COT data shows speculator positioning is at extreme short levels, a condition called crowding risk, which refers to the danger that when too many traders are on the same side, any reversal can be violent and self-reinforcing as they all exit simultaneously. That crowding raises the probability of a short squeeze (a rapid covering rally driven by stop-loss orders rather than genuine demand) that could temporarily push USDCAD lower even as the fundamental bias points higher. -- Intermarket Edge (Note: COT (Commitment of Traders) data is released weekly

USDCAD Week W32-2026: Canadian Dollar Hits Six-Day Low as Oil Drops and Dollar Steadies Near 1.40665, but Bearish DXY Bias Keeps the Bull Case Fragile

USDCAD Week W32-2026: Canadian Dollar Hits Six-Day Low as Oil Drops and Dollar Steadies Near 1.40665, but Bearish DXY Bias Keeps the Bull Case Fragile

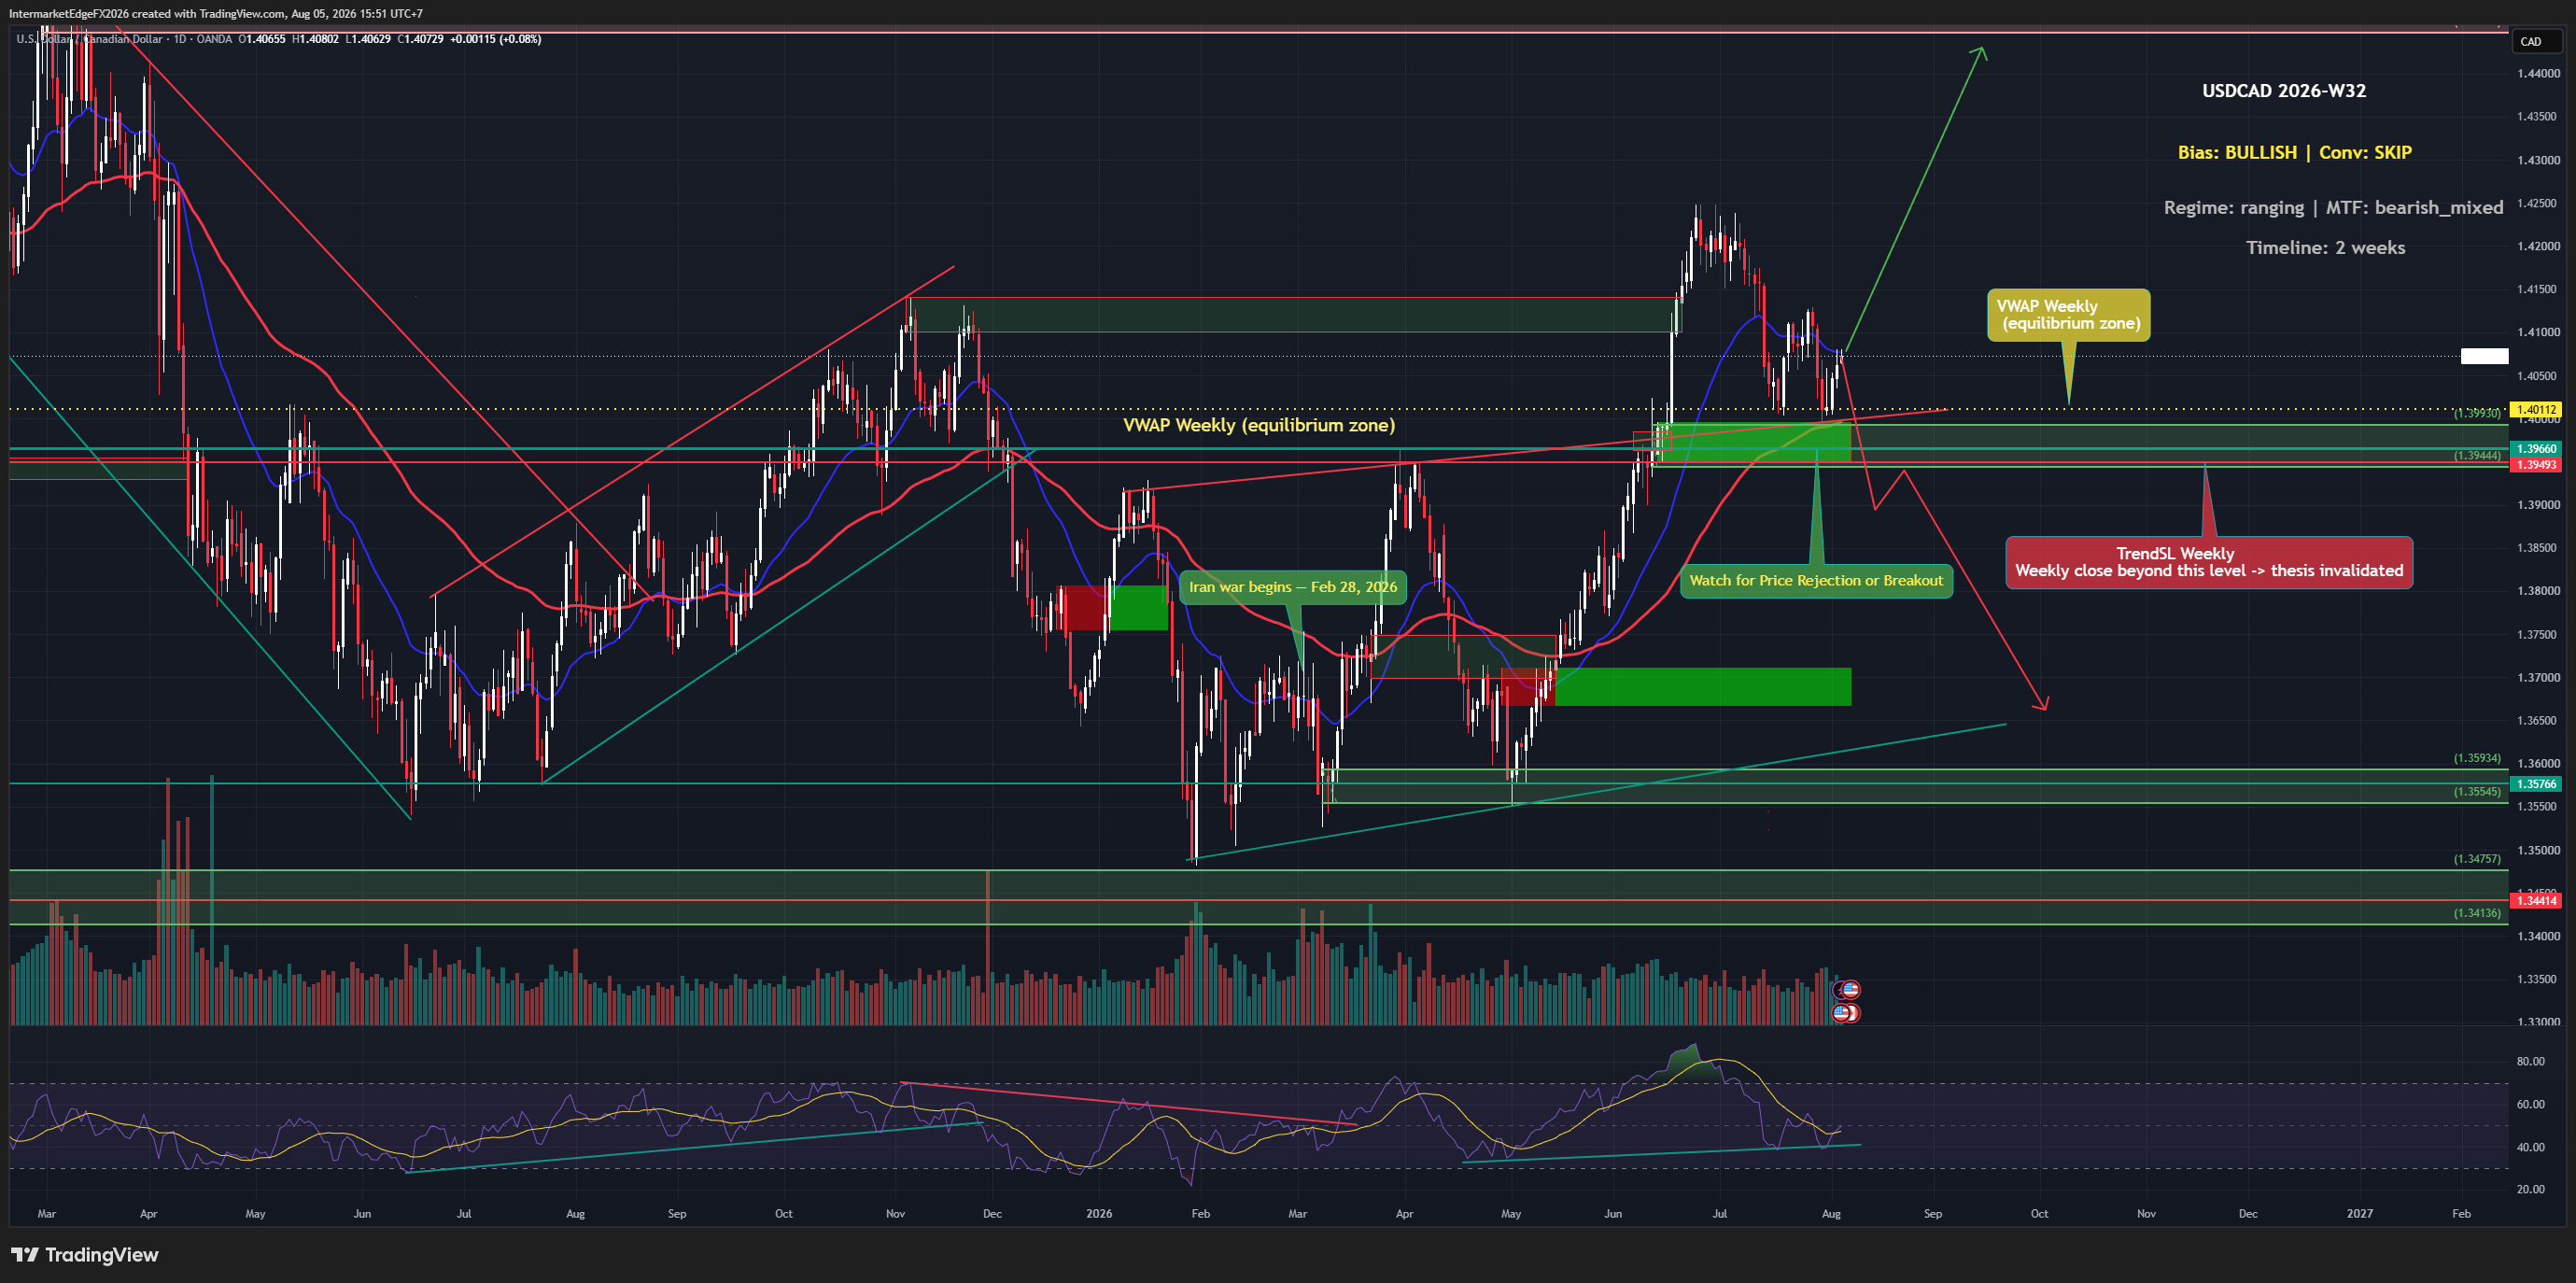
USDCAD is trading at 1.40665 as of Wednesday, 05 August 2026 at 08:31 UTC, holding above its weekly VWAP of 1.40112 even as the broader dollar faces pressure from Yen intervention spillover and Middle East-driven risk sentiment. The Canadian dollar recently hit a six-day low as oil prices dropped, lending short-term support to the pair. The bullish bias this week is real but fragile, conviction is low, the regime is ranging, and the macro case rests almost entirely on Fed hawkishness and rising real yields rather than any confirmed price-action breakout. The directional bias for USDCAD in Week W32-2026 is bullish, but conviction is low, a designation that carries real practical meaning for position sizing and risk management. The two active drivers supporting the upside case are COT positioning, which is skewed bullish (note: the brief does not specify the exact report week, net-position figure, or release date for this COT reading, so it should be treated as directional evidence rather than a standalone statistic), and macro fundamentals, specifically the Fed's hawkish stance and rising US real yields. The causal chain runs as follows: a hawkish Fed holding rates elevated or signaling further tightening pushes US real yields higher, which widens the rate differential between USD and CAD, making dollar-denominated assets relatively more attractive and supporting USDCAD. This is a coherent and well-established transmission mechanism in FX. However, the bullish case has a critical structural weakness: price action itself is not confirming the thesis. Momentum, liquidity, and sentiment signals are all neutral this week, meaning the market is not yet pricing in the macro story with any conviction. The multi-timeframe alignment is bearish-mixed, which is a direct caution flag, lower timeframes are not aligned with the weekly directional call. -- Intermarket Edge

USDCAD Week W31-2026: Fed Holds Rates Steady and CAD Rallies to 9-Day High, Pushing Price Below VWAP at 1.40983 and Testing the Bullish Thesis

USDCAD Week W31-2026: Fed Holds Rates Steady and CAD Rallies to 9-Day High, Pushing Price Below VWAP at 1.40983 and Testing the Bullish Thesis

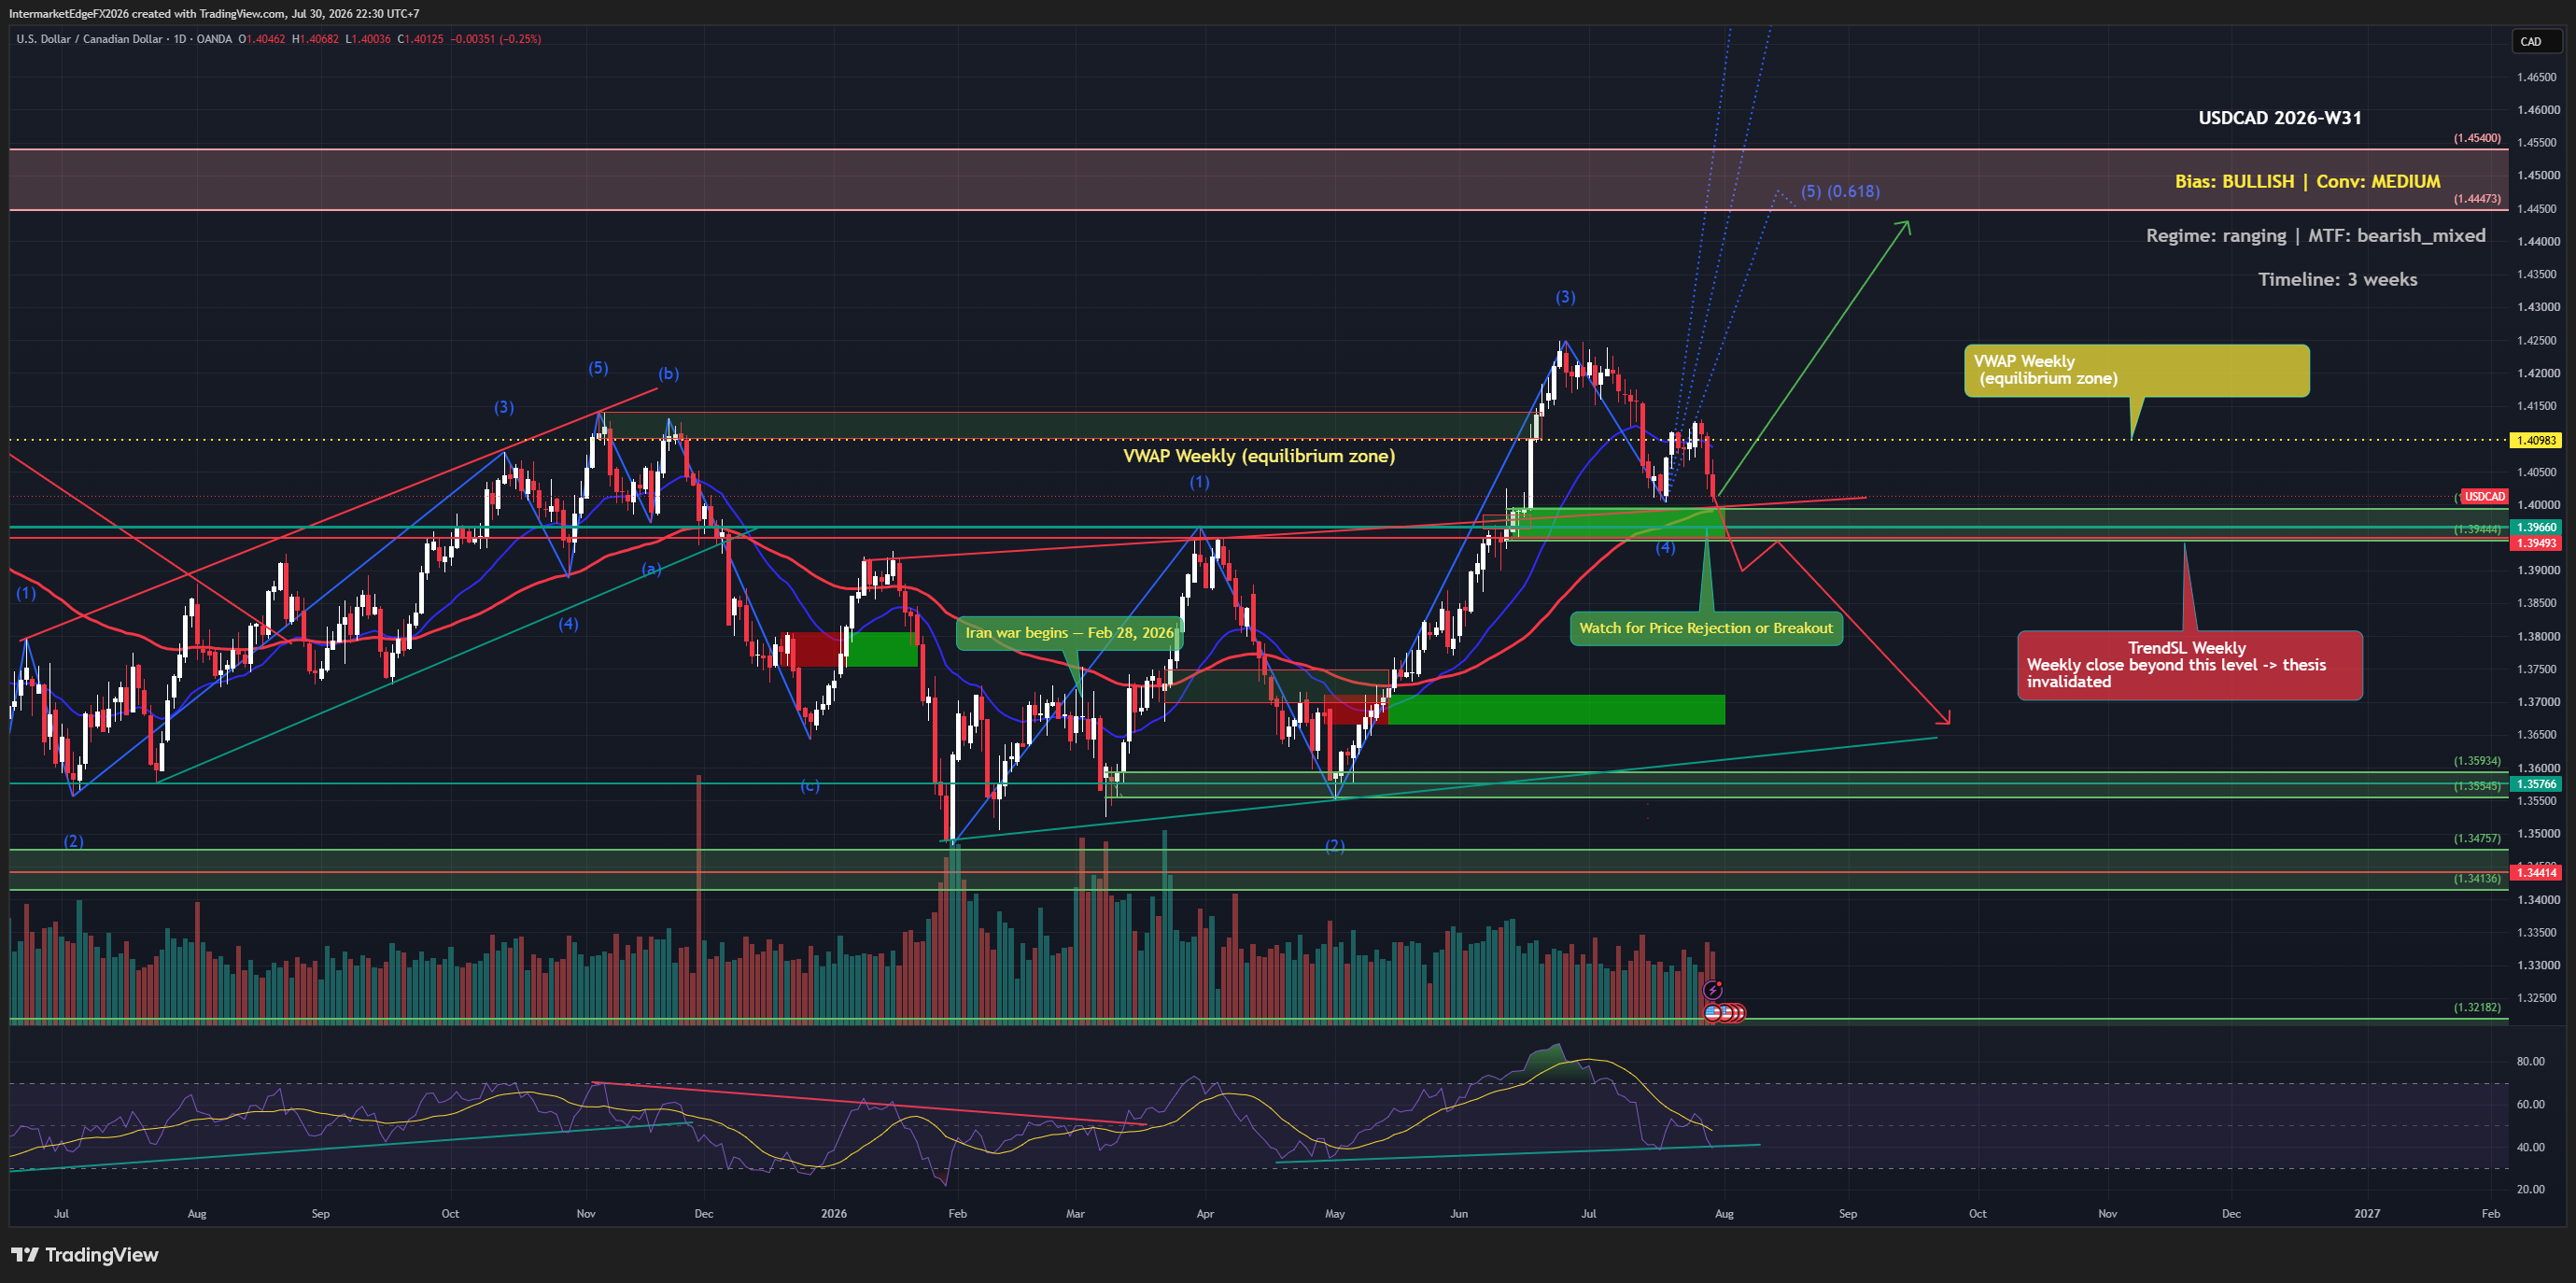
USDCAD is under immediate pressure after the Fed held rates steady, triggering a broad dollar slip and pushing the Canadian dollar to a 9-day high. As of Thursday, 30 July 2026 at 15:04 UTC, price sits at 1.40193, below the weekly VWAP of 1.40983, putting short-term momentum squarely against the bullish structural thesis. The longer-term trend structure remains intact above the weekly TrendSL at 1.39493, but bulls need to reclaim VWAP to restore confidence in the trend-follow setup. The medium-conviction bullish bias on USDCAD for the week of W31-2026 rests on three pillars: the Fed-versus-Bank-of-Canada rate differential, rising US real yields, and a multi-timeframe technical structure that remains aligned bullish across daily, weekly, and monthly frames. The rate differential argument is straightforward, with US real yields at 2.43% and the Fed maintaining a restrictive stance, the fundamental case for USD strength against a commodity-linked currency like CAD has not structurally deteriorated. COT positioning data available in the brief shows a bullish lean for this setup (though the specific report week, net-position figures, and sample context are not provided, so this should be treated as directional corroboration, not a standalone citable statistic). That said, conviction is explicitly rated at medium, not high, and the evidence base this week is narrower than ideal: no liquidity or sentiment signals fired, meaning the bullish case rests on price structure, COT direction, and macro fundamentals alone. The current market price of 1.40193 as of Thursday, 30 July 2026 at 15:04 UTC is already below the weekly VWAP of 1.40983, this is not a future contingency, it is the current reality, and it means short-term momentum is running against the bullish thesis right now. Position sizing should reflect this: this is not a moment to be adding to longs aggressively. -- Intermarket Edge

USDCAD Week W30-2026: Tariff Threats and Yield Spread Widening Push Pair to a One-Week Low, But VWAP at 1.40594 Keeps Bulls Cautiously Alive

USDCAD Week W30-2026: Tariff Threats and Yield Spread Widening Push Pair to a One-Week Low, But VWAP at 1.40594 Keeps Bulls Cautiously Alive

USDCAD is trading at 1.4083 (as of 2026-07-23T13:15 UTC, yfinance near-realtime), marginally above the weekly VWAP of 1.4059 and well above the trend support at 1.3937. The regime is ranging with a mean-reversion implication — not a trending environment. The news backdrop is mixed. The Canadian dollar briefly strengthened on rising benchmark yields, but then hit a one-week low as yield spreads widened following renewed U.S. tariff threats. Ottawa's response was sharp — PM Carney called the latest tariff move a USMCA violation, while USTR Greer countered that Canada is offering better deals to third parties. Separately, USD is finding a bid from U.S.-Iran tensions pushing Brent higher — which cuts both ways for USDCAD since oil strength typically supports CAD. The bullish bias rests on two pillars: COT positioning (net bullish) and macro fundamentals — the Fed remains hawkish, real yields are elevated at 2.37%, and the rate differential favors USD. However, conviction is low; price, liquidity, and sentiment signals are all neutral. A TGA drain is flagged as a partial offset, simultaneously supporting risk assets and capping USD upside. Critical override risk: a sustained oil rally would strengthen CAD and could neutralize the entire setup regardless of rate differentials. Structural levels to watch: a weekly close below VWAP (1.4059) warrants size reduction; a close below TrendSL (1.3937) invalidates the bullish structure entirely. Given low conviction, keep sizing conservative and wait for price confirmation before adding directional exposure. -- Intermarket Edge

USDCAD - Wave 4 Recovers From a Deeper-Than-Expected Pullback, Price Retests the 1.4174 Decision Zone Ahead of Wave 5 Toward 1.4447-1.4540

USDCAD - Wave 4 Recovers From a Deeper-Than-Expected Pullback, Price Retests the 1.4174 Decision Zone Ahead of Wave 5 Toward 1.4447-1.4540

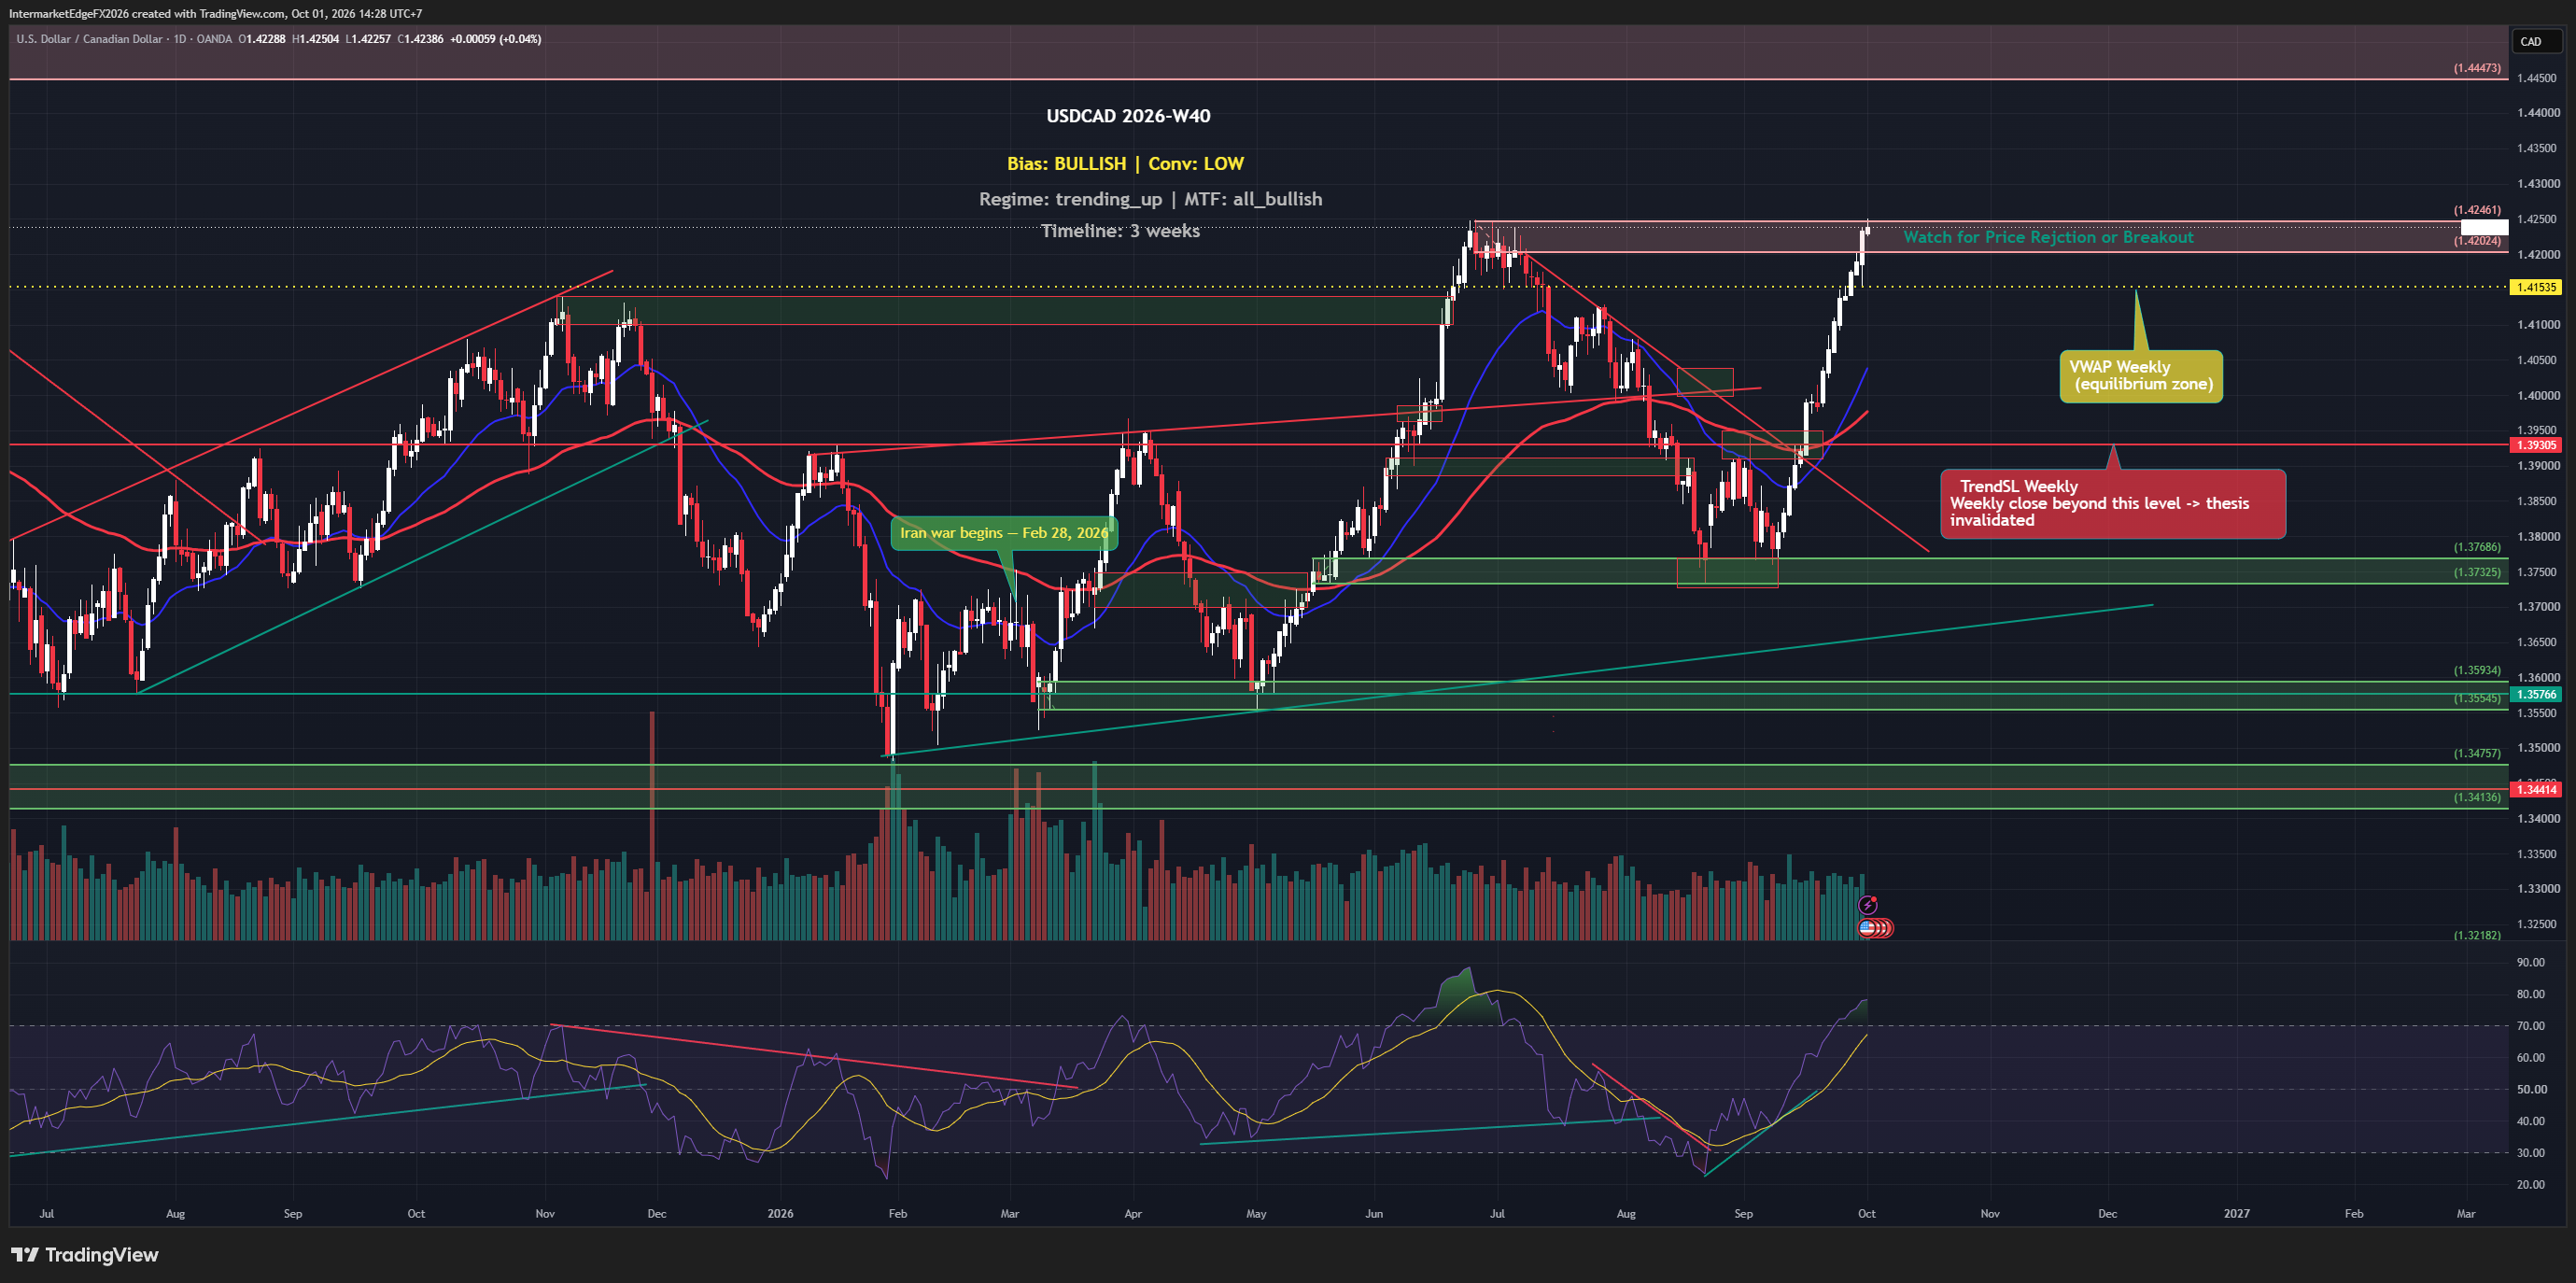
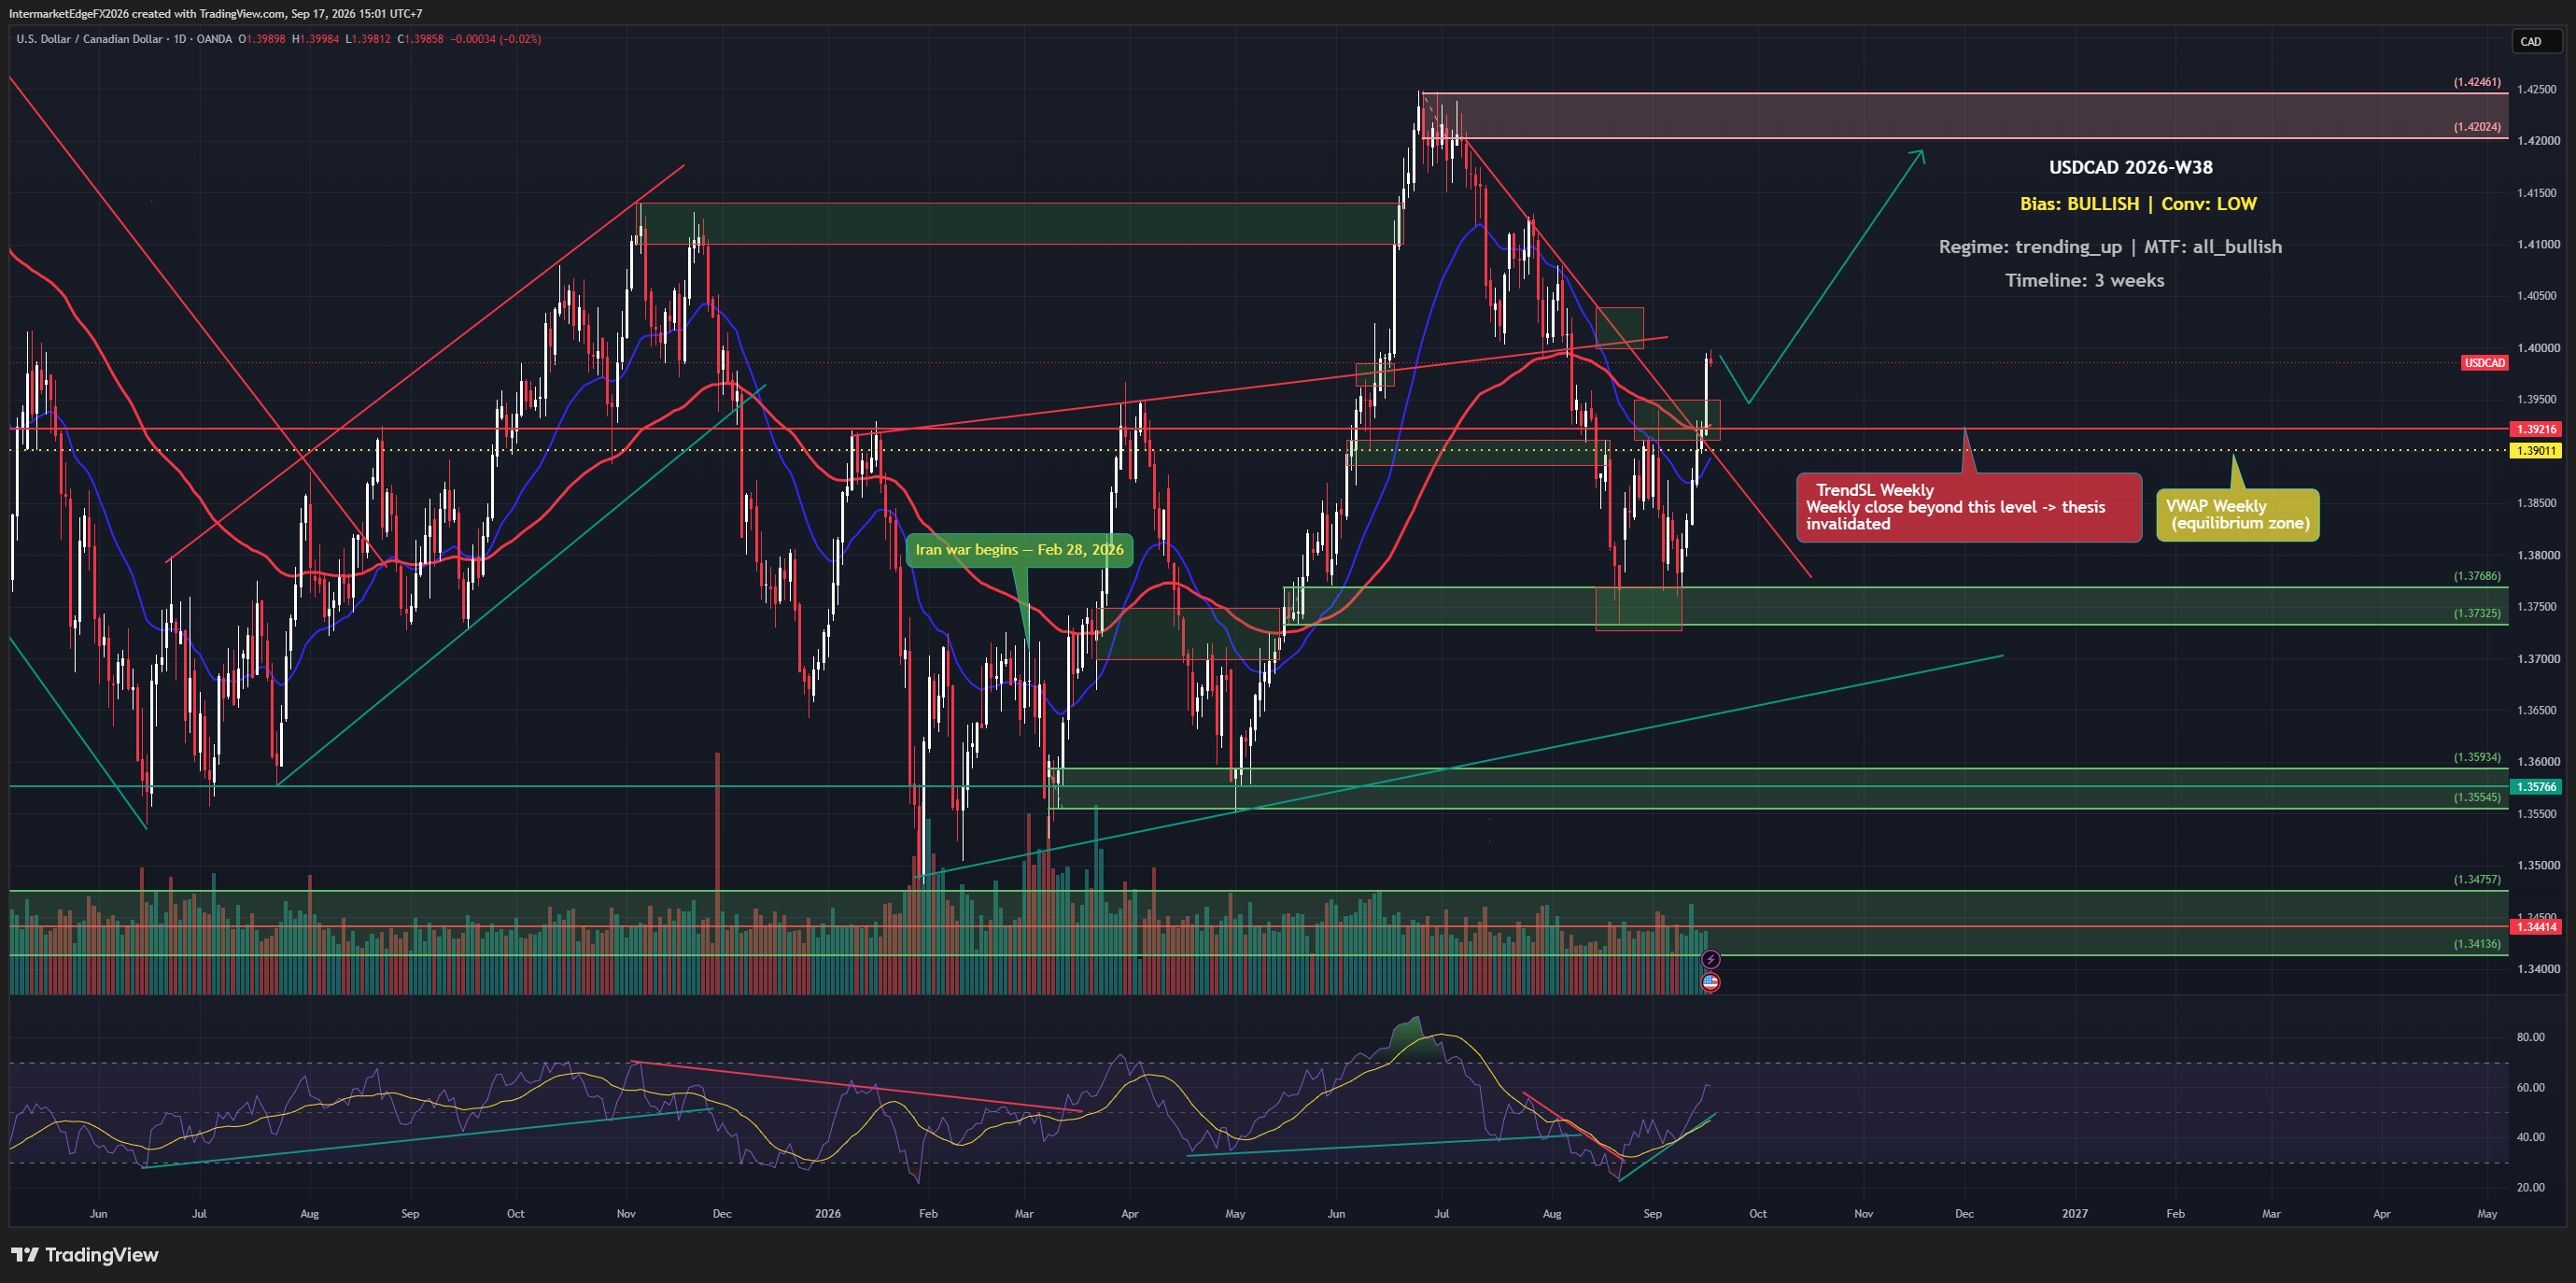
USDCAD - SUMMARY 09/07/2026 Regime: Wave 4 completed a deeper-than-expected correction (1.394-1.397 instead of 1.415-1.417), now recovering to retest the 1.415-1.417 pivot from above. Medium-High Bull unchanged. Bias: Medium-High Bull. New factors: sharp two-way oil volatility from Iran (detailed in the USOIL piece), down 2.85% today creating near-term weak-CAD pressure. VIX cooling for 3 straight days (18.4 → 17.47 → 16.45). BoC's Macklem shifted mixed-to-hawkish. Data corrections: US2Y 4.18% (not 3.693%); US CPI 4.2% (not 2.4%). D1 structure: wave (3) peaked ~1.42 on target, wave (4) fell deeper than expected to 1.394-1.397, now recovering to retest the 1.415-1.417 pivot. Wave (5) target: 1.4447 then 1.4540. Invalidation below 1.400. Scenarios: holds and continues toward 1.4447-1.4540 (40%); range 1.400-1.420 pending confirmation (40%); break below 1.400 invalidating the thesis (20%). No confirmed date/time yet for the FOMC minutes despite newsflow noting market attention. For informational purposes only, not investment advice.

USDCAD - CAD Hits a 14-Month Low as Oil Breaks Below $70 and DXY Holds a 13-Month High, a Double Squeeze Drives Wave (3) Toward 1.4447

USDCAD - CAD Hits a 14-Month Low as Oil Breaks Below $70 and DXY Holds a 13-Month High, a Double Squeeze Drives Wave (3) Toward 1.4447

USDCAD 1.4232 | Double squeeze: 13-month DXY high + oil below $70 | 25 June 2026 CAD hits a 14-month low, pressured from both sides simultaneously. USD leg: 13-month high post-hawkish FOMC. CAD leg: oil broke below $70 and the pre-war 71.11 support. When both legs tilt the same way, this is the strongest bullish configuration. BoC Macklem today: not seeing spillovers from higher oil prices into CPI. Implicitly dovish, BoC in no hurry to hike. Canada benchmark yields slipping. CAD at a 14-month low as tech selloff drives safe-haven into USD. AUDUSD at 0.691, broad commodity FX weakness. CAD weakness is not idiosyncratic. D1 structure: wave (3) impulse running. Target 1.4447 then 1.4540. Support 1.4100 then 1.3993. Invalidation: below 1.3476. Three scenarios: → Wave (3) continues to 1.4447 then 1.4540. Probability: 45% → Sub-wave 4 correction to 1.40 then resumes. Probability: 25% → Oil bounces + dovish Fed, drops to 1.39. Probability: 15% The tell: both legs tilting simultaneously. DXY strongest in 13 months, CAD weakest in 14. Not a coincidence. A double squeeze. Conviction: High Bull (upgraded from Med-High). --- Intermarket Edge | Institutional Macro & Intermarket Analysis For informational purposes only. Not financial advice.

Stay in the loop

Get notified about new research, macro insights, and market analysis.

InterMarketEdge

© 2026 InterMarketEdge. Financial intelligence for inter-market traders.