Tag: OIL — InterMarketEdge

Tag: OIL

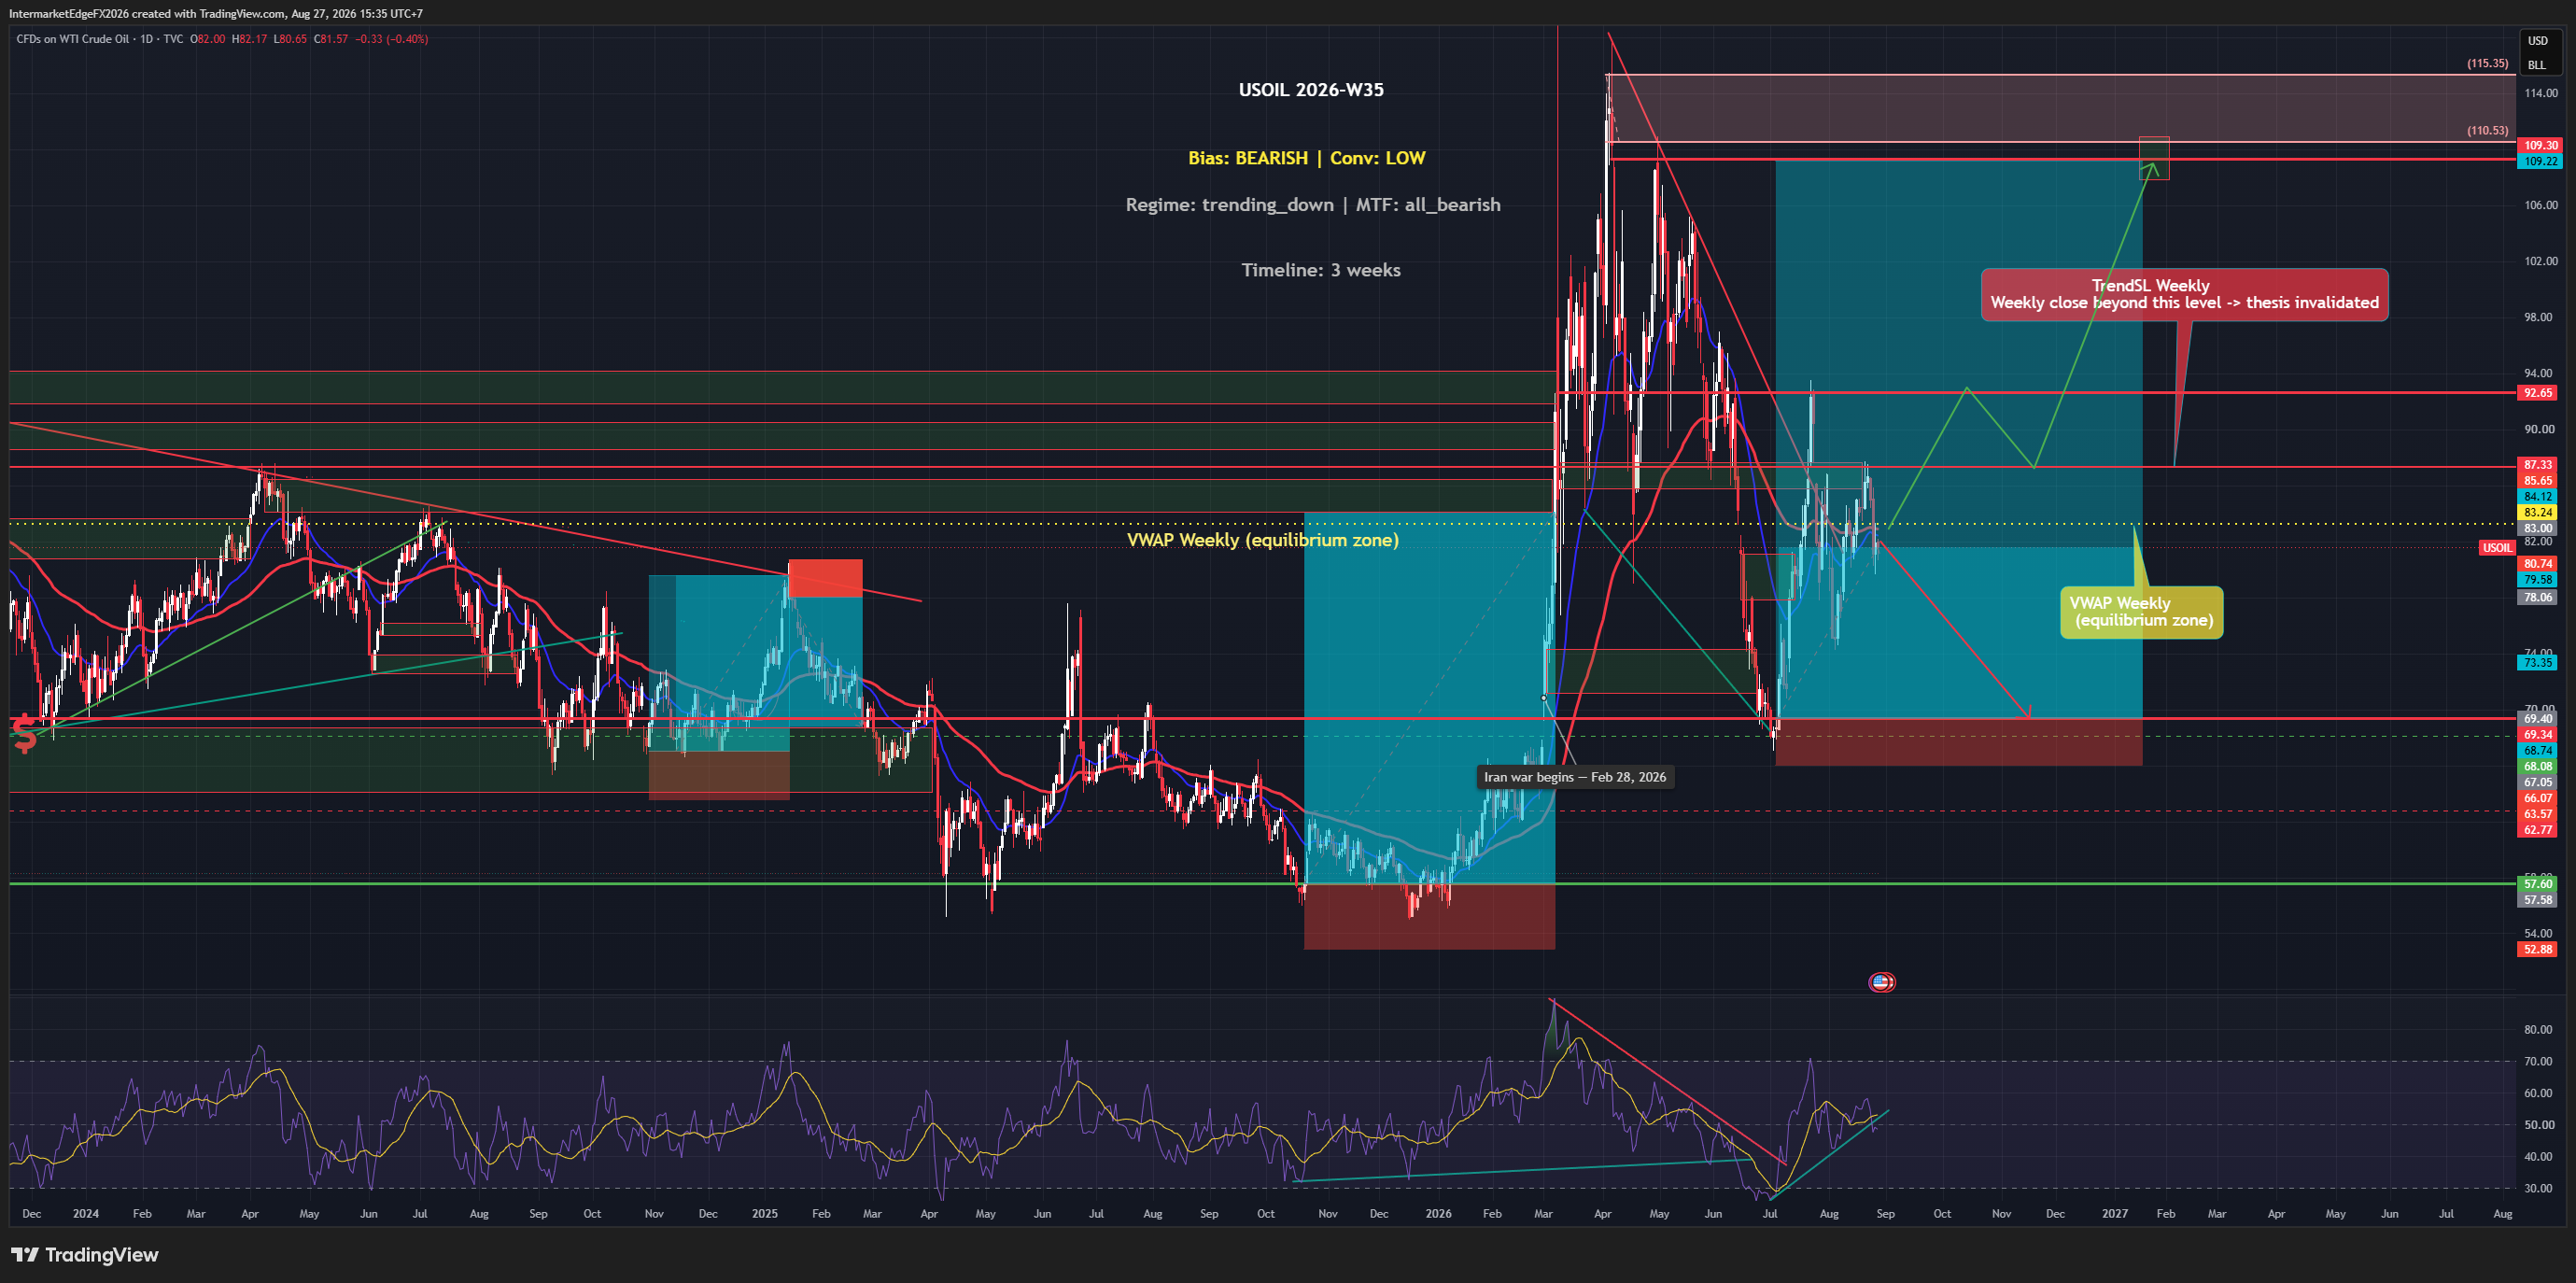
USOIL Week W35-2026: Three Straight Sessions of Losses as Hormuz Reopening Hopes Pull the Rug on Supply-Risk Bulls

USOIL Week W35-2026: Three Straight Sessions of Losses as Hormuz Reopening Hopes Pull the Rug on Supply-Risk Bulls

Crude oil has extended losses into a third consecutive session, with price trading at 82.49 as of Thursday 27 August, sitting below the weekly VWAP of 83.24. The headline driver this week is improved odds of the Strait of Hormuz reopening, a geopolitical shift that removes a key supply-risk premium that had been quietly supporting prices. When a fear-driven premium exits, the underlying supply picture takes over, and right now that picture shows four straight weeks of inventory builds averaging above 1.5 million barrels. The directional lean this week is bearish, though with low conviction, and that qualification matters more than the direction itself. What makes this setup structurally unusual is that the individual signals are not aligned behind the bearish view. Price action shows a technical reading that leans bullish, and COT positioning, the commitments of traders report, which tracks the aggregate stance of large speculators and commercial hedgers, also sits on the bullish side (note: the brief does not specify the exact report week, release date, or net-position figures, so this should be read as directional evidence rather than a precise citable statistic). Yet despite both of those inputs pointing higher, the macro causal chain overrides them in the aggregated framework. Fed hawkishness is driving real yields upward, which supports the dollar and creates quote-side pressure on oil. Four consecutive inventory builds confirm that physical supply is not tightening. The TGA refill adds a liquidity-drain headwind that touches all risk assets. The Hormuz reopening story is the newest entrant: improved odds of the strait remaining open mean the geopolitical risk premium, the extra dollars priced in because of potential supply disruption, is being unwound. That unwind is not a collapse, but it removes a support that was never about fundamentals to begin with. -- Intermarket Edge

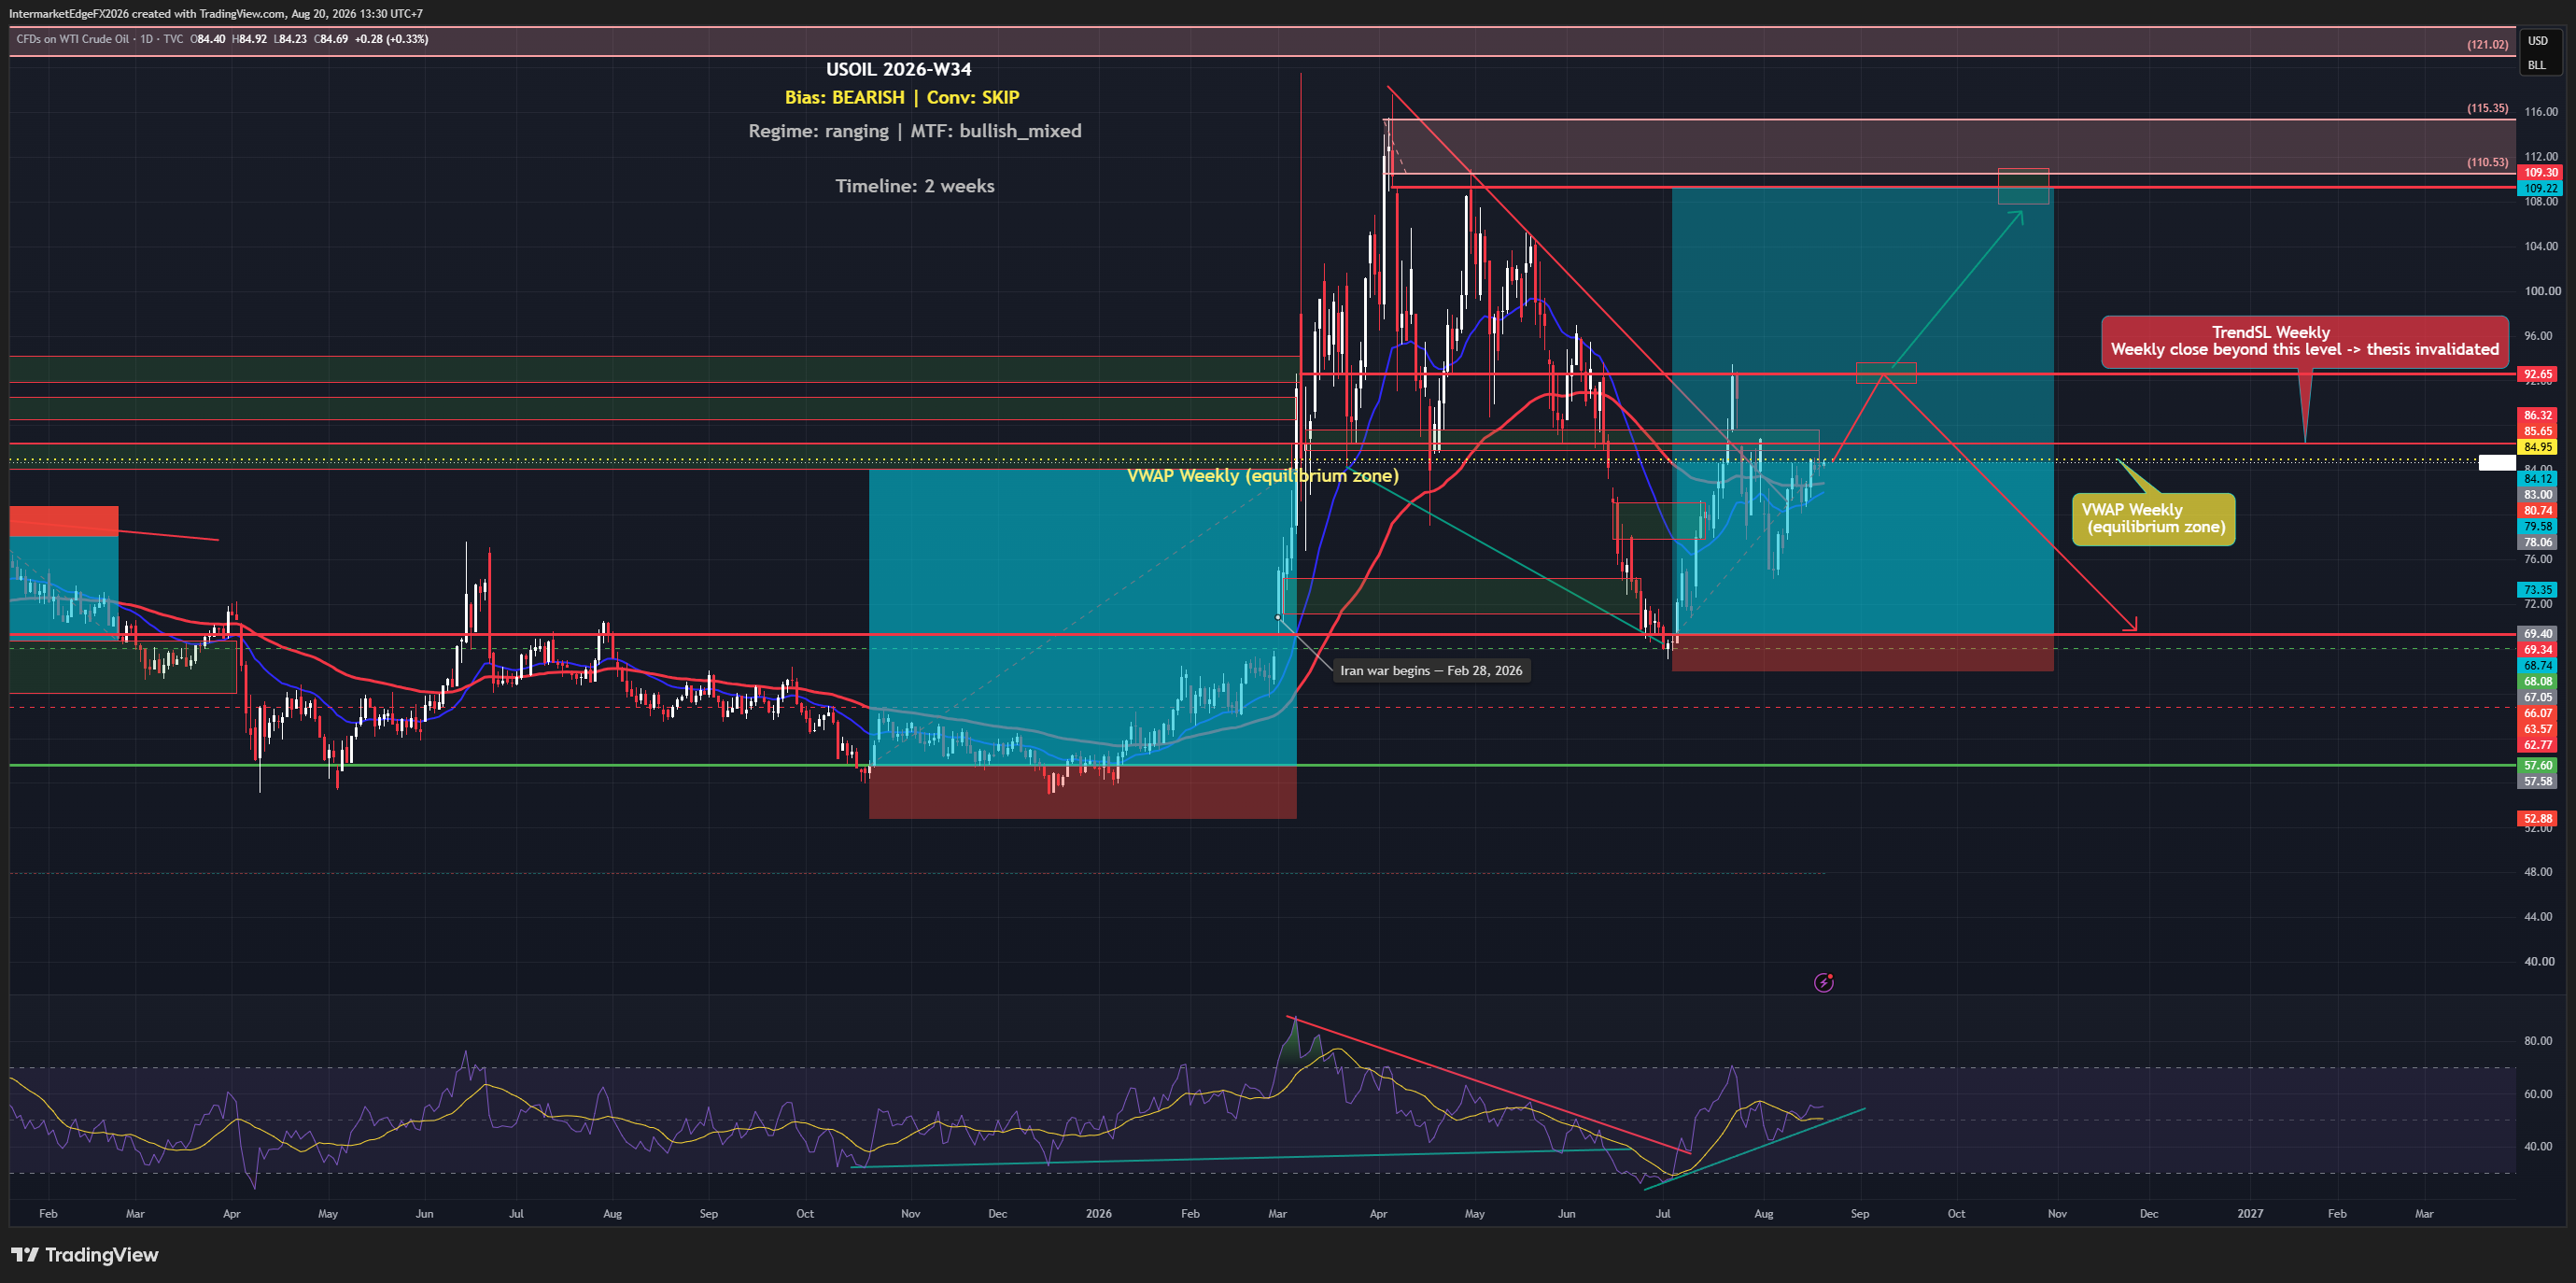
USOIL Week W34-2026: Hormuz Standoff Lifts Price Above 84.95, But Three Straight Inventory Builds Tell a Different Stor

USOIL Week W34-2026: Hormuz Standoff Lifts Price Above 84.95, But Three Straight Inventory Builds Tell a Different Stor

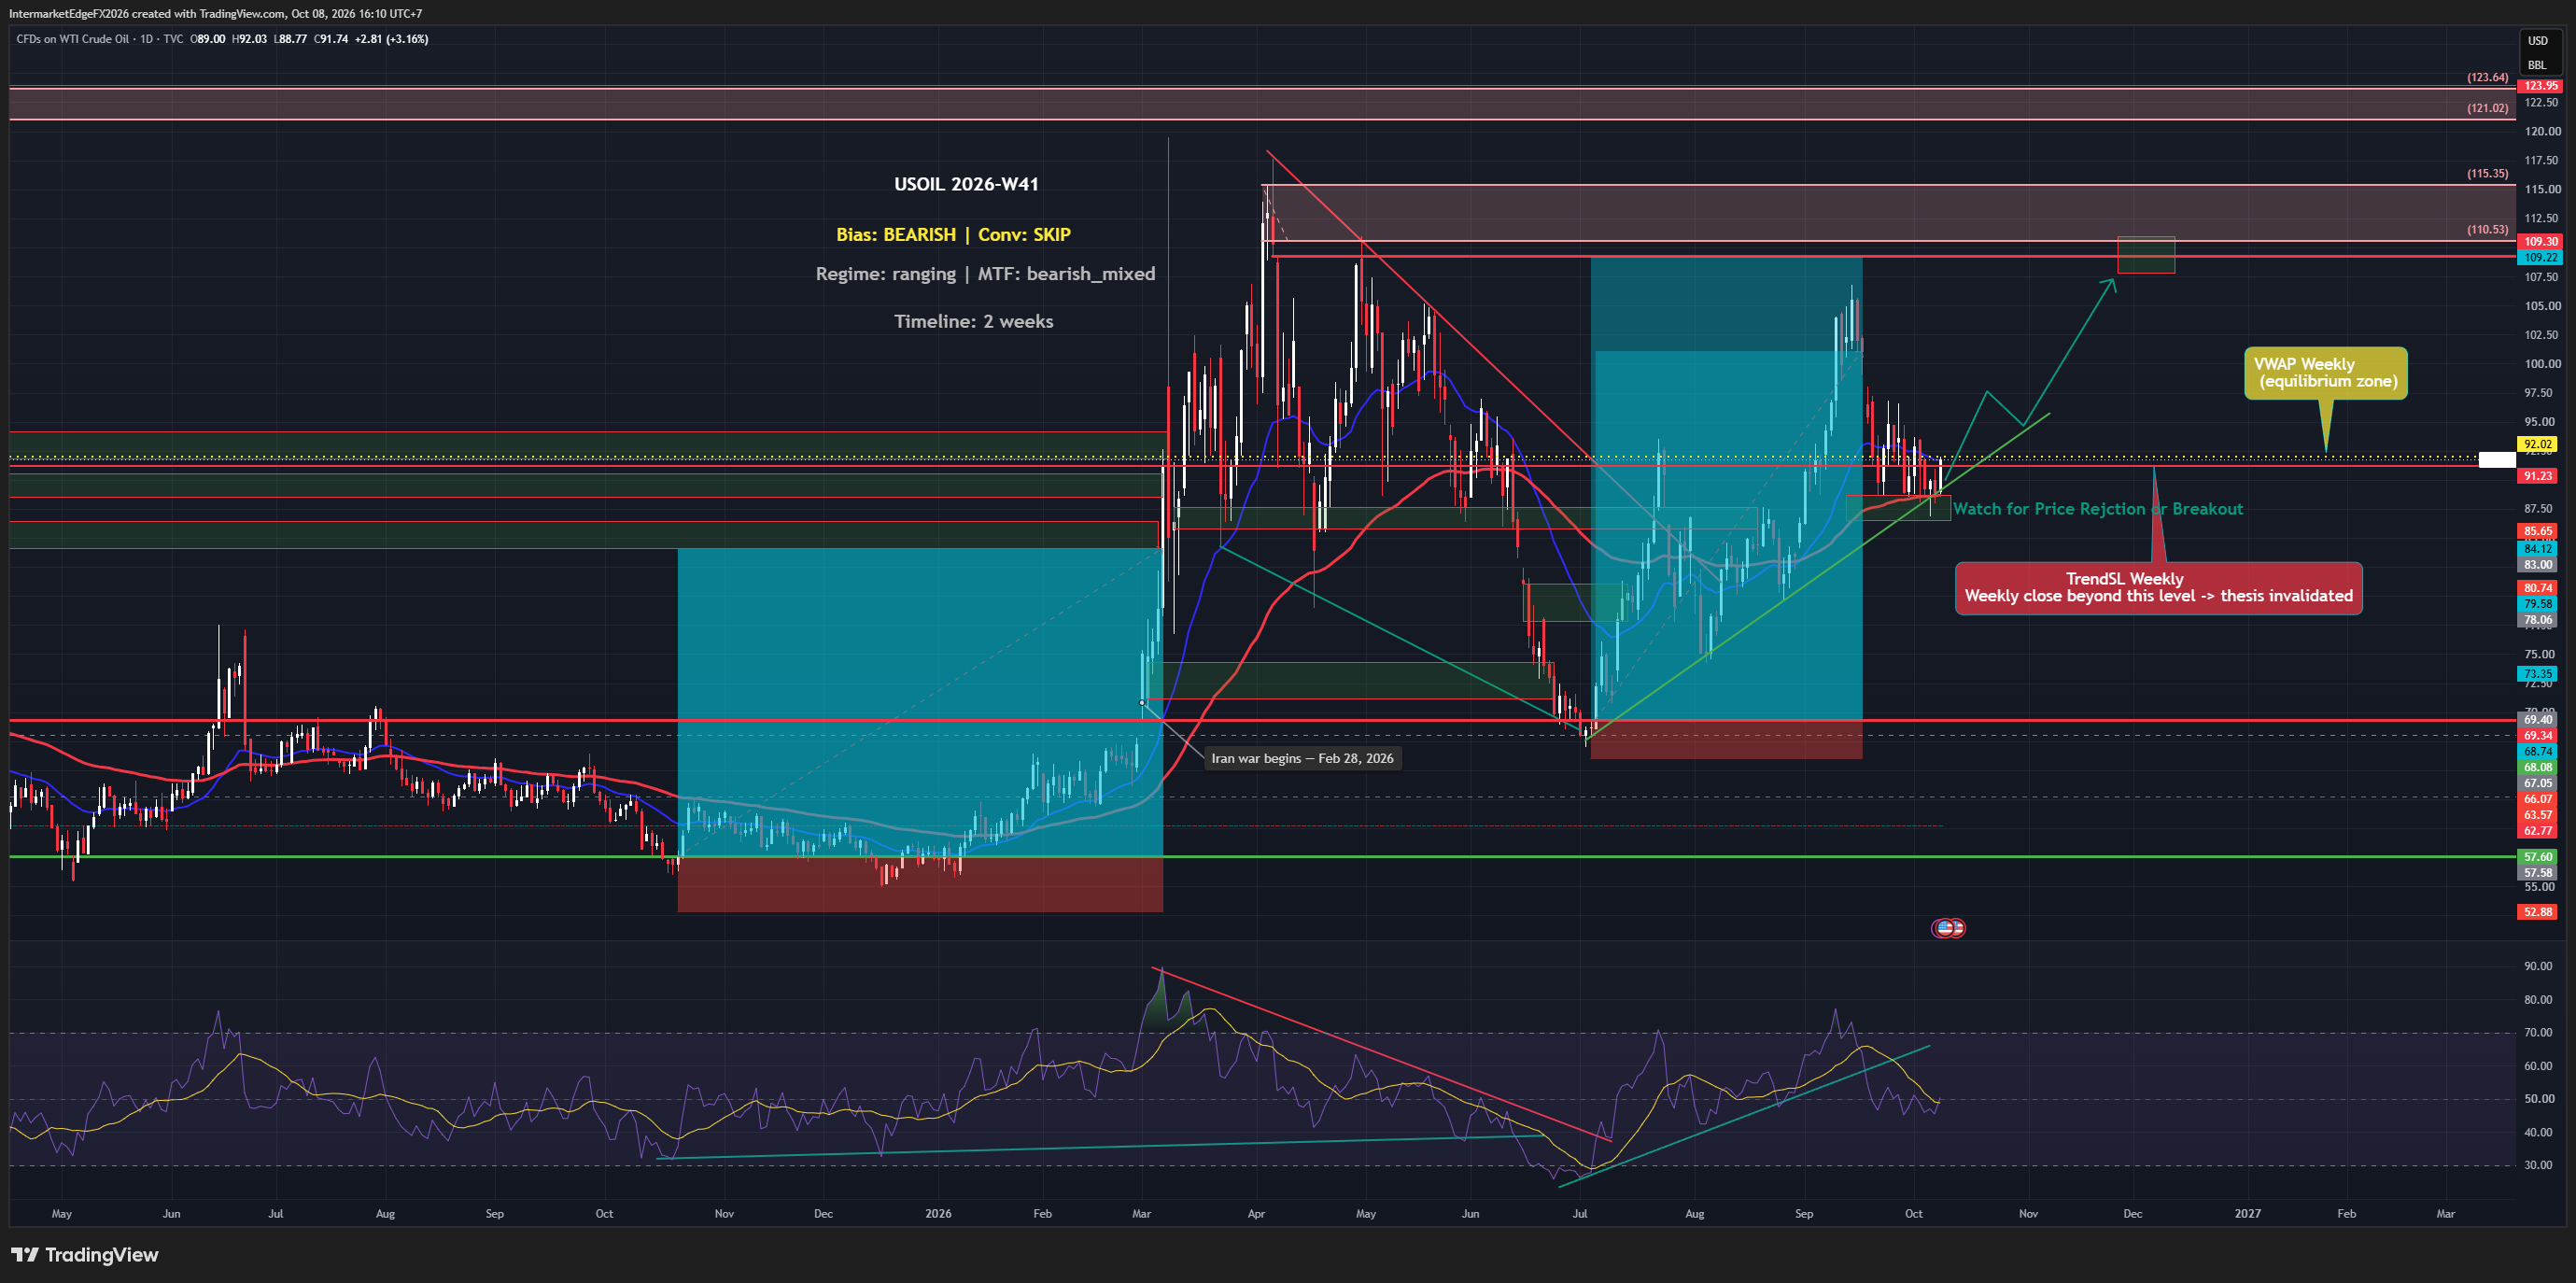
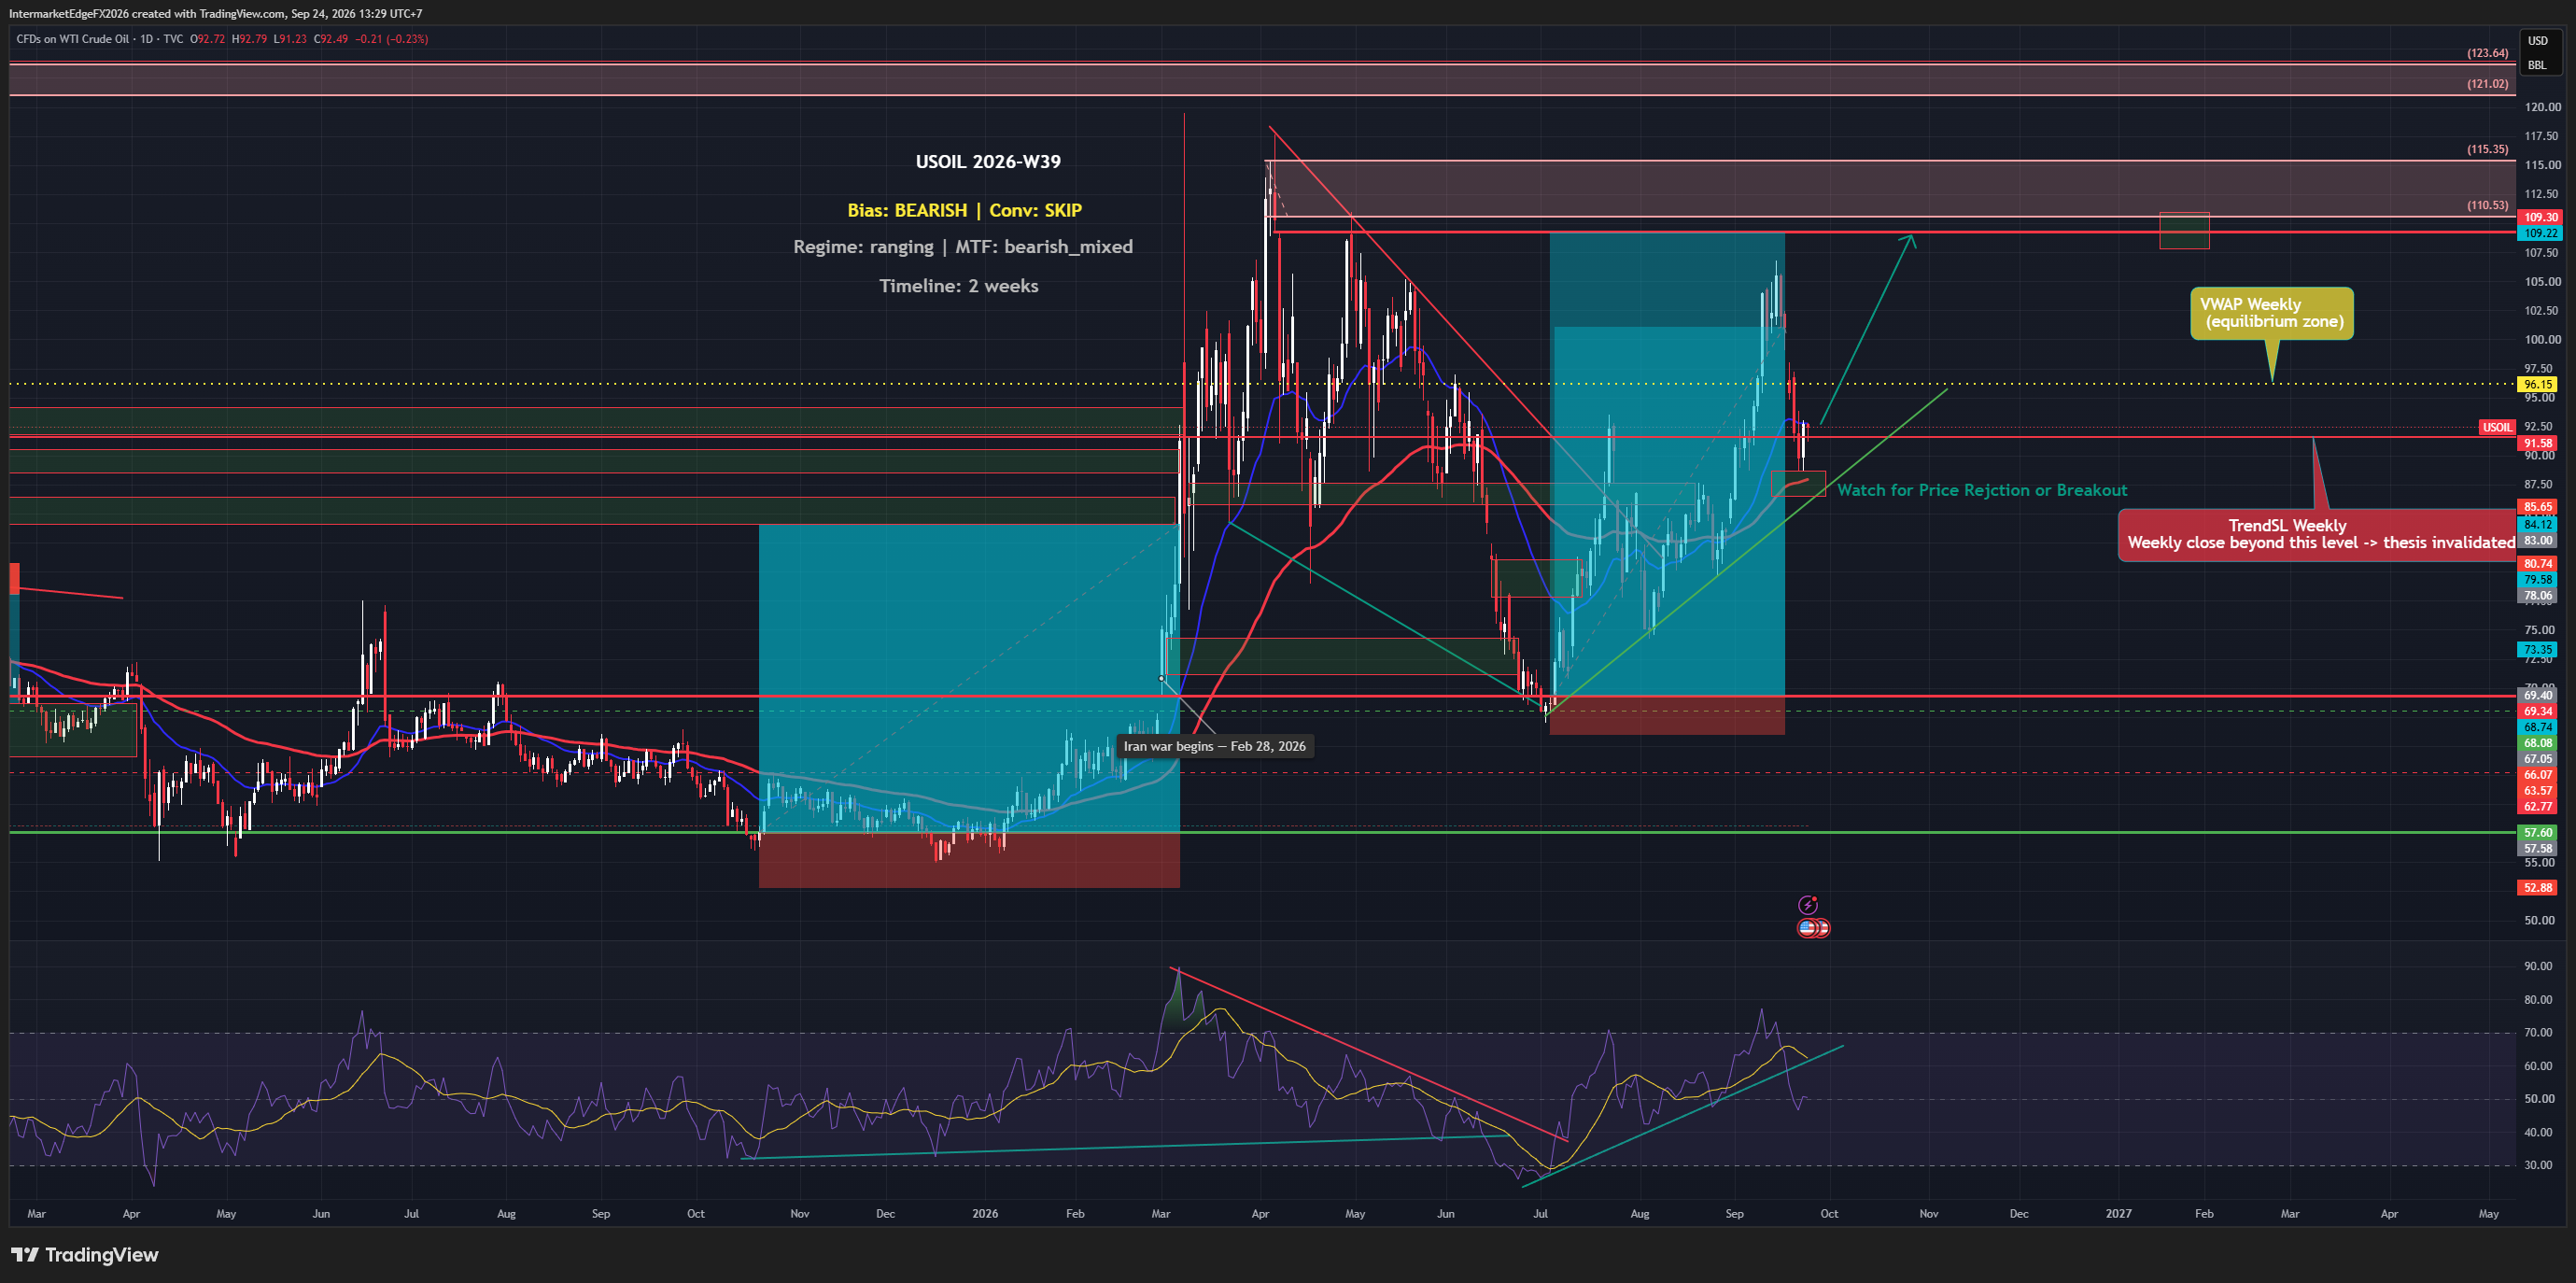
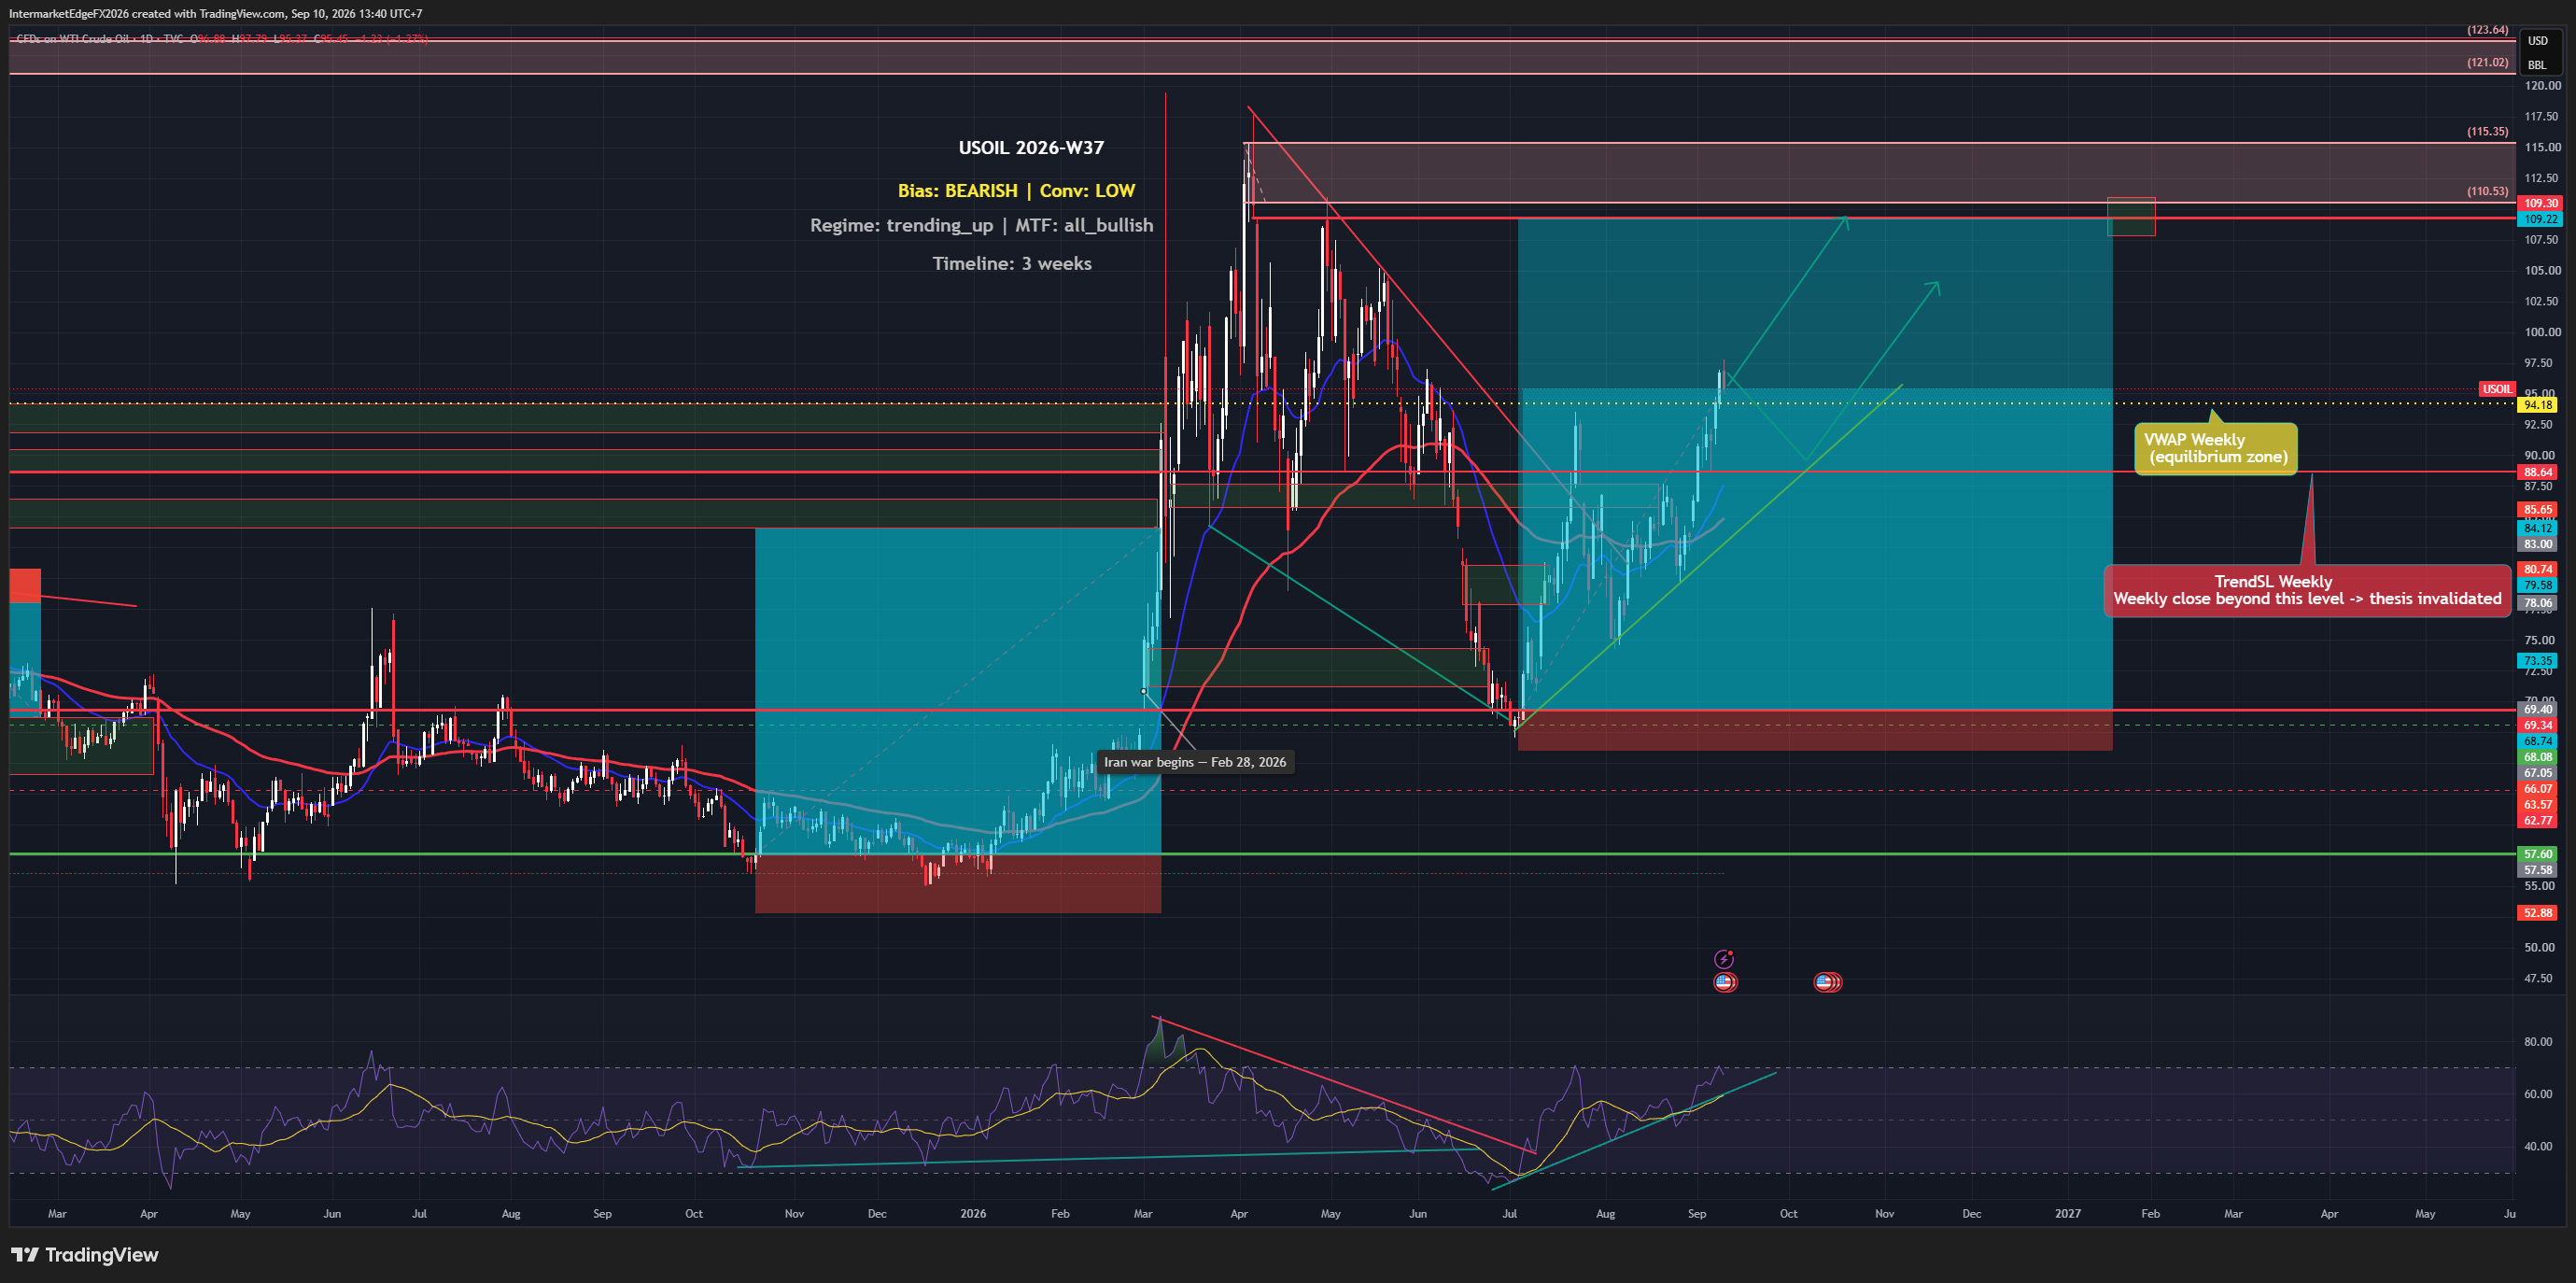
US crude oil is sitting at 85.34 on Thursday, 20 August 2026, trading above its weekly VWAP at 84.95, and that single fact already runs against the week's bearish lean. Three consecutive EIA inventory builds have added genuine supply-side pressure, yet the Hormuz standoff keeps a geopolitical floor under price. The macro and positioning signals are actually bullish, which makes the overall bearish bias here a deliberate, conflict-aware call, not a clean directional read. The overall lean for USOIL this week is bearish, but it is important to understand that this is a conflict-driven bias, not a consensus one. All three active market signals, price action, COT positioning, and the macro backdrop, are individually registering on the bullish side. COT data, which tracks futures positioning reported to regulators and should be read as directional evidence rather than a standalone citable figure since the exact report week and net-position totals are not specified here, shows notable bullish lean from large speculators. Price is above its weekly VWAP. Macro sub-signals, while mixed at the aggregate level, include a geopolitical risk premium that is actively supporting bids. The framework's output of a bearish bias exists precisely because the structural forces sitting behind those near-term signals, rising real yields, a liquidity drain from TGA refill activity, and a sustained inventory build cycle, are likely to reassert once the geopolitical noise fades or the risk premium gets priced out. This kind of internal signal conflict, where the directional call runs against most of the active sub-signals, is exactly the condition that calls for staying aside rather than forcing a position. The conviction here does not reach a threshold where the evidence is convincing enough to size into a directional trade. -- Intermarket Edge

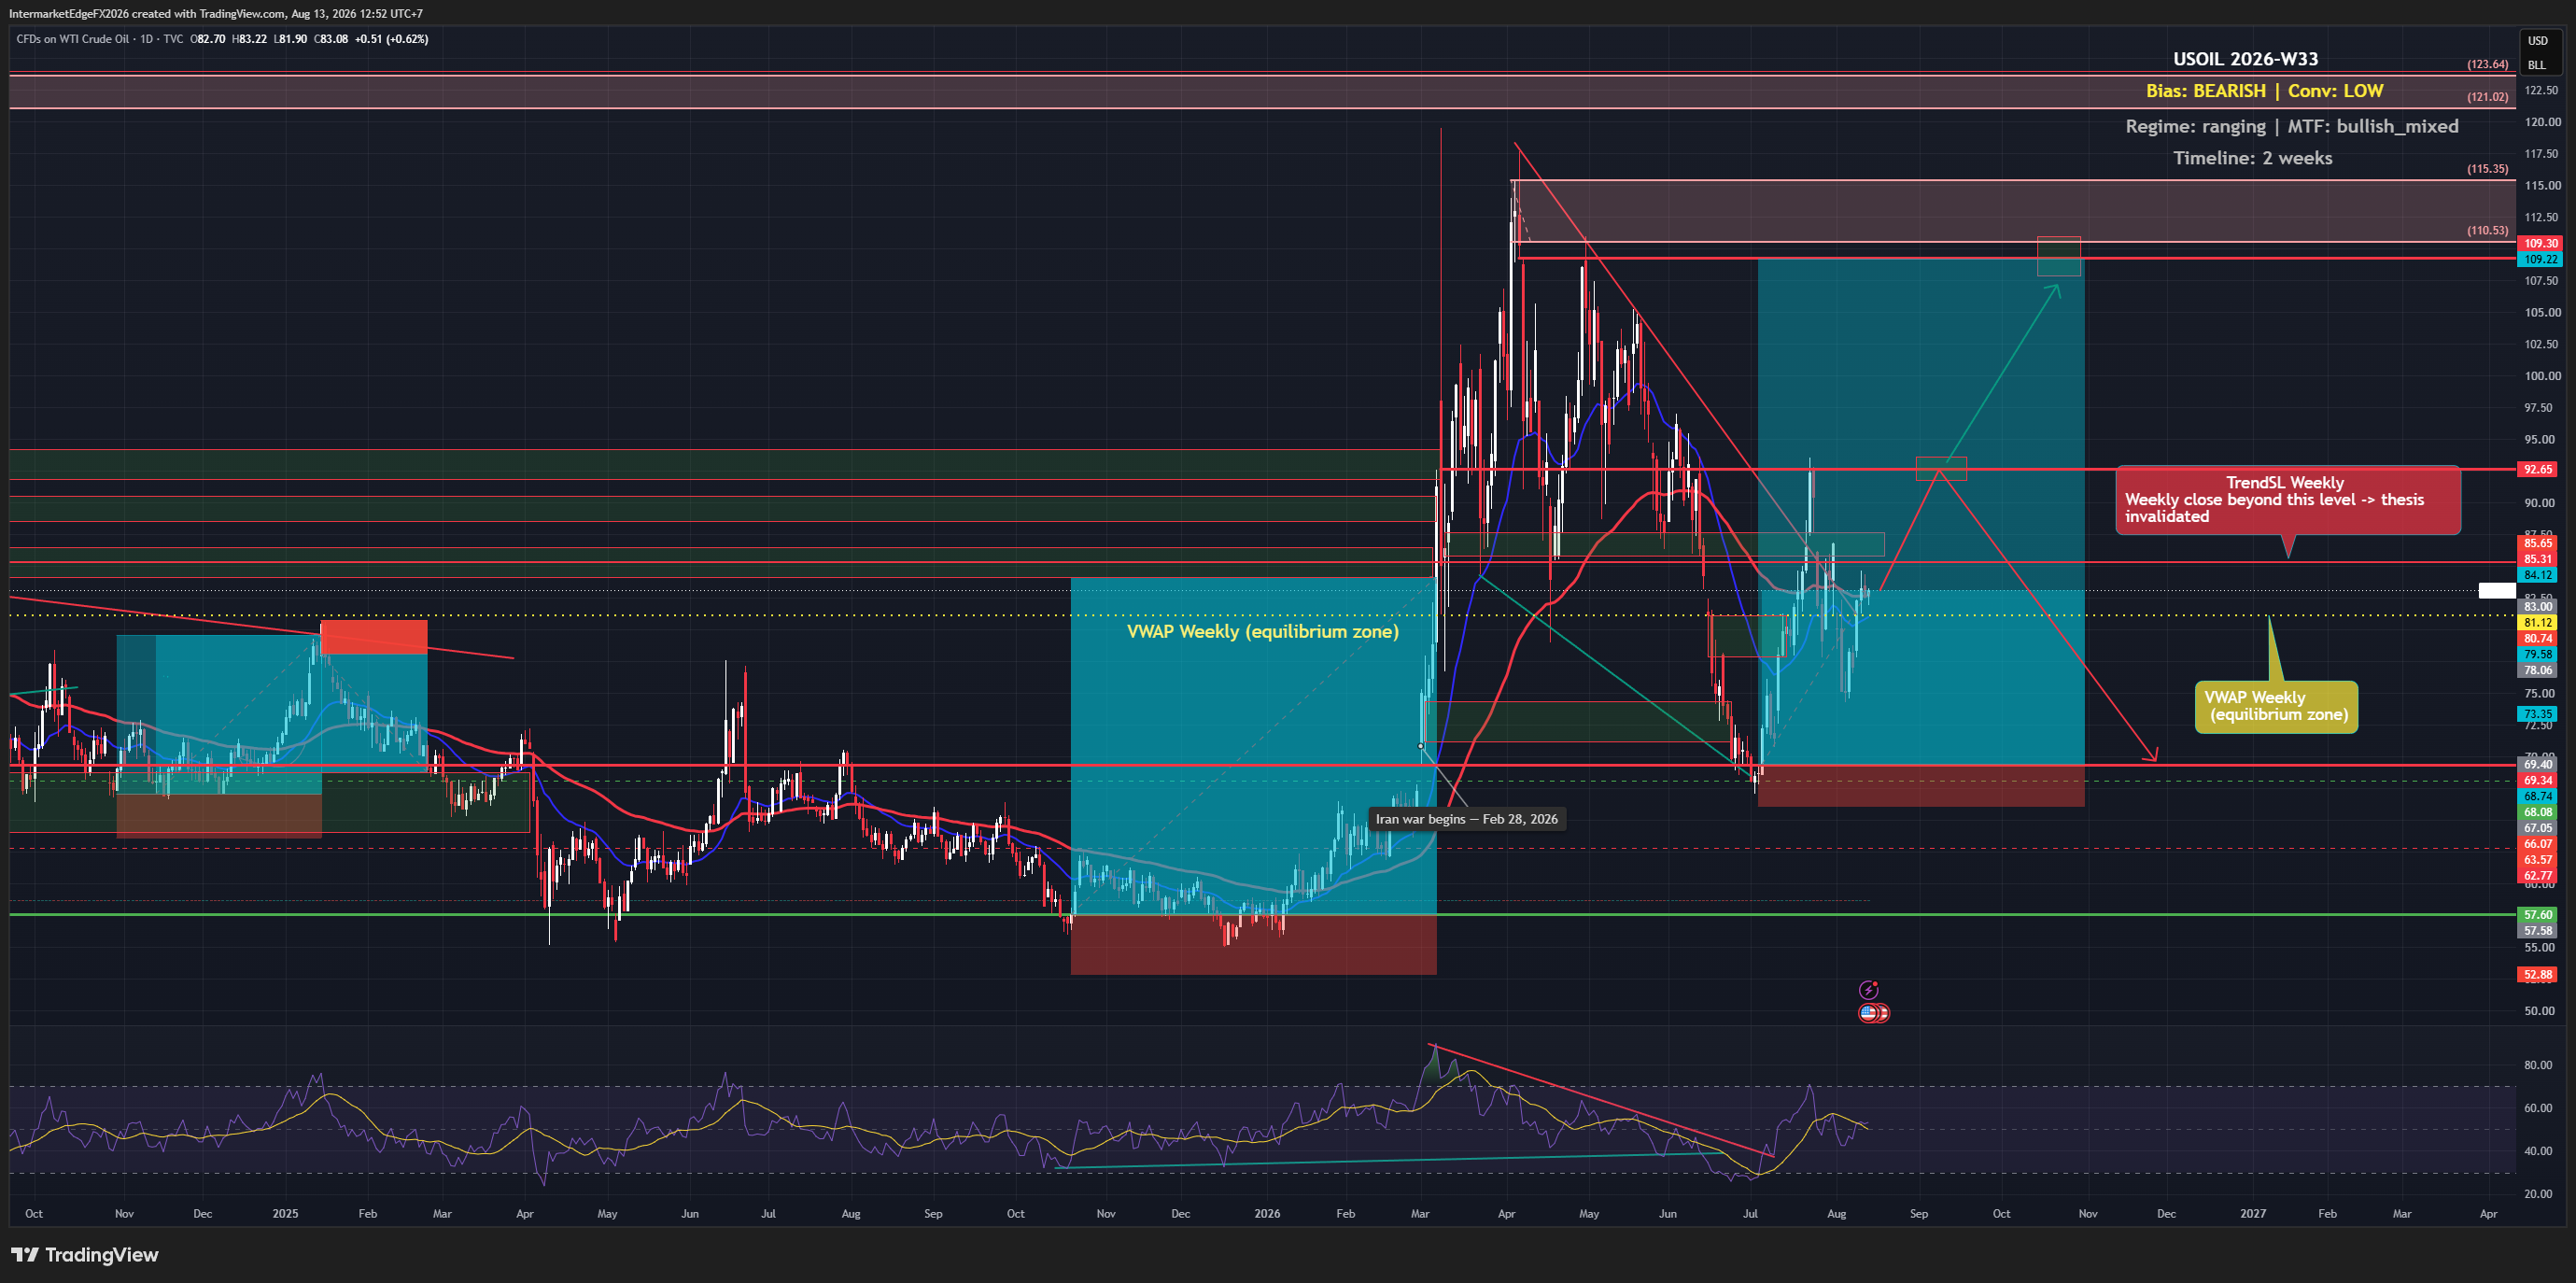
USOIL Week W33-2026: Inventory Builds and Hormuz Uncertainty Leave Oil Caught Between 81.12 and 85.31

USOIL Week W33-2026: Inventory Builds and Hormuz Uncertainty Leave Oil Caught Between 81.12 and 85.31

USOIL is trading at 82.90 on the CL=F futures contract used as proxy, caught between a four-week streak of crude inventory builds averaging above 1.5 million barrels and a COT positioning read that still leans bullish. The macro story, rising real yields, a stronger dollar impulse, and China's structural shift away from gasoline, points lower. But price has not broken down yet, and that gap between the fundamental case and actual price behavior is exactly where traders get into trouble this week. The framework's output for W33-2026 is a bearish bias on USOIL, but the conviction is deliberately low, and that low conviction is not a soft bearish call, it is a signal that the evidence is conflicted enough to warrant real caution before sizing any directional position. Here is why the conflict matters: price, COT positioning, and the technical read all carry bullish signals in isolation. COT data shows a bullish lean among non-commercial participants, though the brief does not specify the exact report week, net-position figure, or sample, so this should be read as directional evidence rather than a precise citable statistic. Price itself is above the weekly VWAP at 82.90, meaning short-term momentum has not rolled over yet. And the multi-timeframe alignment reads as bullish-mixed, not cleanly bearish. What flips the framework's output to bearish despite all that is the macro overlay: the combination of a rising real yield environment creating dollar-bullish pressure, four consecutive weeks of crude inventory accumulation averaging above 1.5 million barrels per the EIA's actual reported figures, and the structural demand erosion from China's accelerating EV adoption together form a weight that the bullish positioning signals have not yet been able to lift price through. -- Intermarket Edge

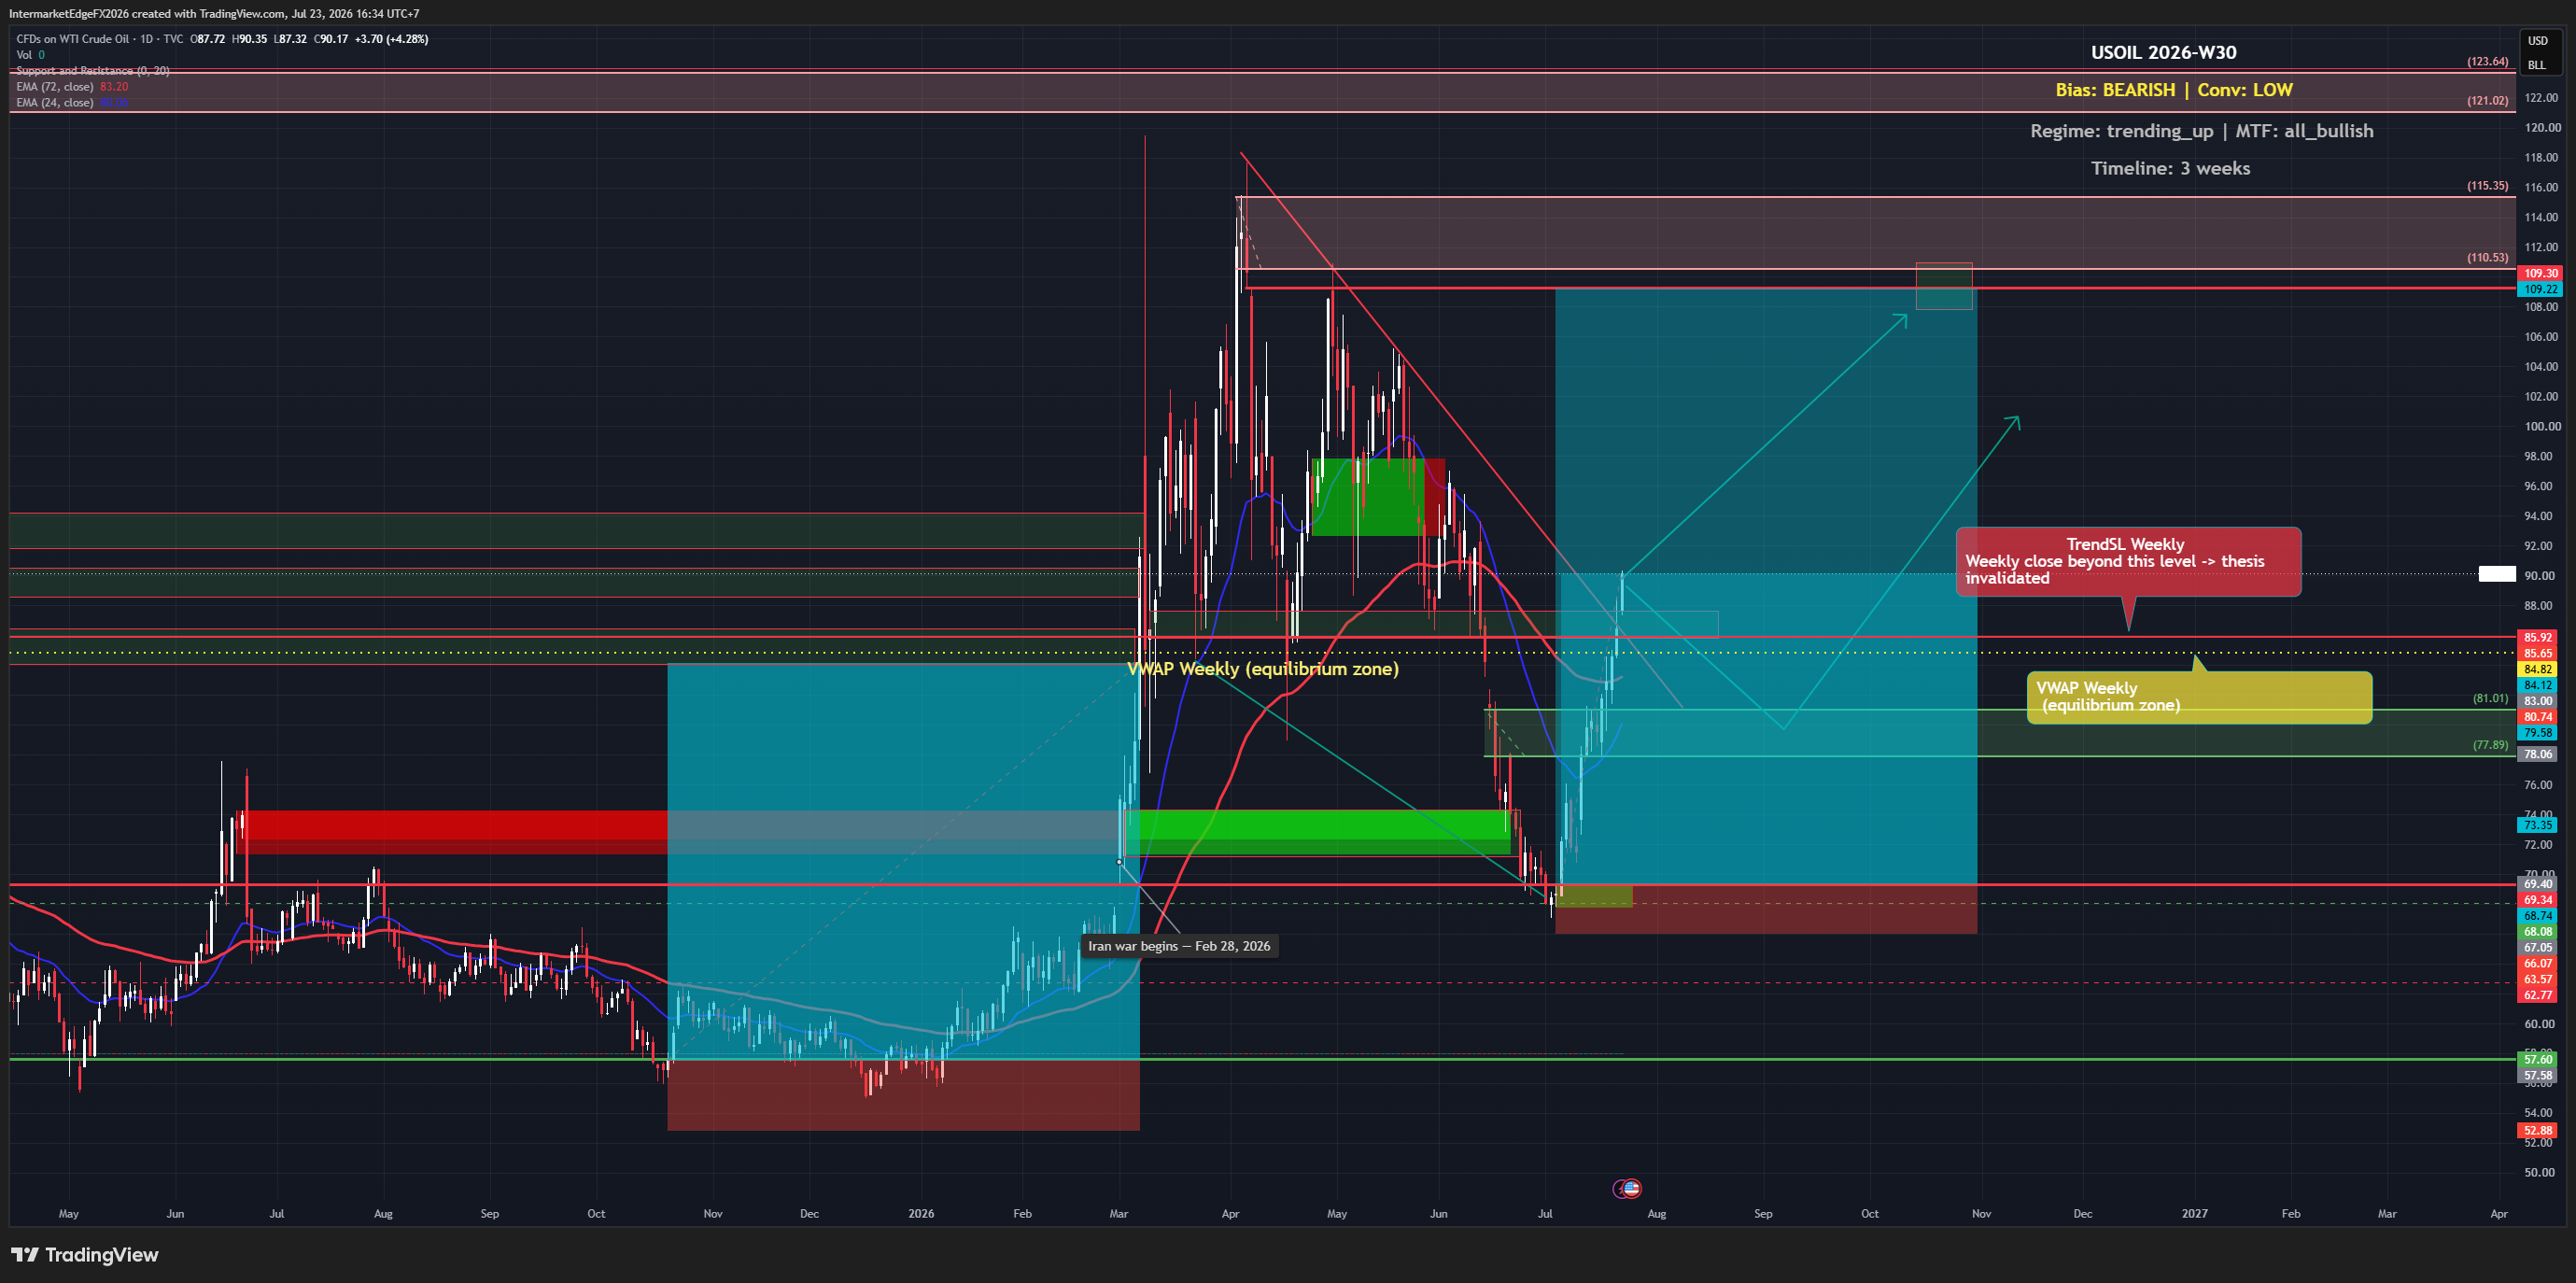
USOIL Week W30-2026: Geopolitical Escalation Pushes Price Above TrendSL 85.915 as Iran Conflict Threatens Red Sea Supply Routes

USOIL Week W30-2026: Geopolitical Escalation Pushes Price Above TrendSL 85.915 as Iran Conflict Threatens Red Sea Supply Routes

As of July 23, 2026 (~09:01 UTC), WTI is trading near 89.60 (yfinance near-realtime). The thesis snapshot was set at 88.30, so price is already running above that level — a direct challenge to the bearish top-line bias. The geopolitical backdrop is driving the move. Trump has stated that every Iranian attack on a commercial ship will be answered with strikes on bridges or power plants near Tehran. Brent has climbed past a key barrel threshold on mounting supply risks, and markets are pricing further escalation in U.S.-Iran conflict. Separately, reports note Suez and Sumed pipelines can absorb rerouted Saudi flows if the Red Sea is disrupted — a partial offset, but the headline risk premium is clearly in control right now. Technical picture is unambiguously bullish: Daily, Weekly, and Monthly trend structures are all aligned to the upside. Price is well above both the weekly VWAP (84.82) and the weekly TrendSL (85.92) — the thesis-break condition that was supposed to invalidate bearish structure has already triggered. Per the framework's own rules: weekly close above 85.92 means bearish structure is invalidated, exit shorts, reassess. The macro layer is mixed. Rising real yields (US 10Y real at 2.37%) support USD strength, which is a headwind for crude. Four-week average inventory builds exceeding +1.5Mb signal persistent supply accumulation — structurally bearish. But geopolitical supply-disruption risk is currently overriding inventory fundamentals. Bottom line: The bearish bias carries low conviction, COT/sentiment inputs are neutral, and price has broken above every defined invalidation level. No directional lean is warranted here — the conflict between the rule engine's bearish output and live price reality is too wide to trade with confidence. -- Intermarket Edge

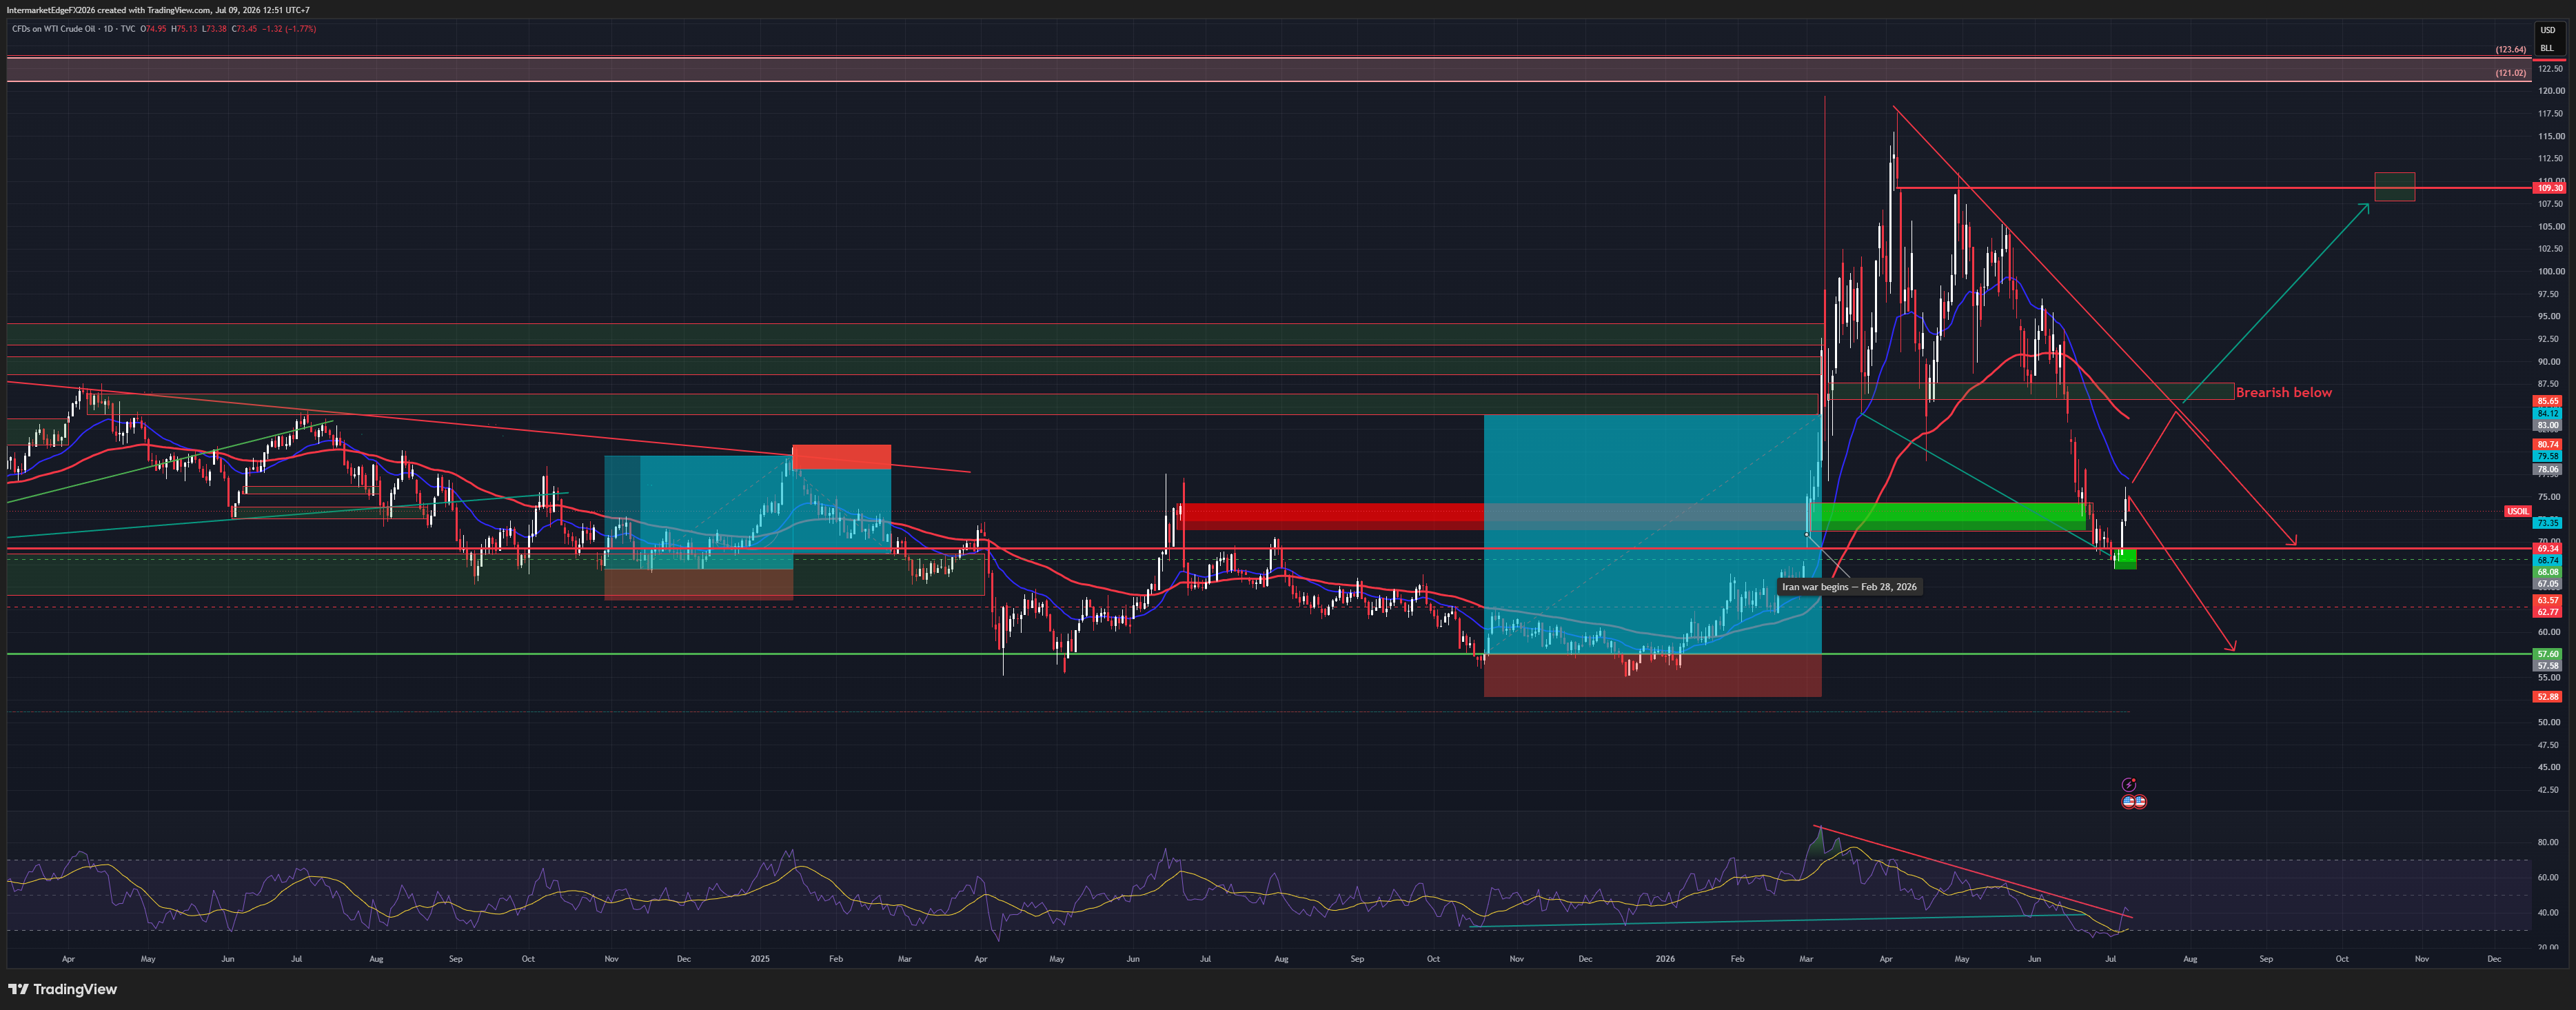
USOIL - Last Week's Bearish Thesis Invalidated as Price Clears 73.35, Iran War Escalation Reverses the Entire Oil-Glut Narrative

USOIL - Last Week's Bearish Thesis Invalidated as Price Clears 73.35, Iran War Escalation Reverses the Entire Oil-Glut Narrative

USOIL - SUMMARY 09/07/2026 Regime: Last week's High Bear thesis invalidated as price cleared the 73.35 invalidation level, due to Iran war escalation rather than analytical error. Shifted to Medium Bull (risk premium), moderate conviction. Bias: Medium Bull (risk premium), shifted from High Bear last week. New factors: US revoked Iran's oil sale authorization, struck 80+ targets, Iran retaliated against Bahrain and Kuwait, price surged as much as 7% in a session. Simultaneously, EIA reported a surprise inventory build of 2.998M, breaking an 8-week streak of draws -- a bearish fundamental signal being overwhelmed by risk premium. Key precedent: the Iran war's outbreak in February pushed Brent up 65% before fully reversing over 4 months. Caution warranted given this precedent could repeat. D1 structure: support 69-70, medium-term resistance 87.5-92.5. Upside target: 108-112. Downside target: 63.57-57.60. Scenarios: continued escalation toward 87.5-112 (35%); range 70-85 pending developments (40%); cooling as in the precedent, resuming the downtrend (25%). This is the hardest-to-forecast variable in the current 9-instrument basket; continuous monitoring of geopolitical developments is required. For informational purposes only, not investment advice.

USOIL - Five Consecutive Weekly Draws and Price Keeps Falling: When the Market Ignores Inventory, the Supply Narrative Is Winning Absolutely

USOIL - Five Consecutive Weekly Draws and Price Keeps Falling: When the Market Ignores Inventory, the Supply Narrative Is Winning Absolutely

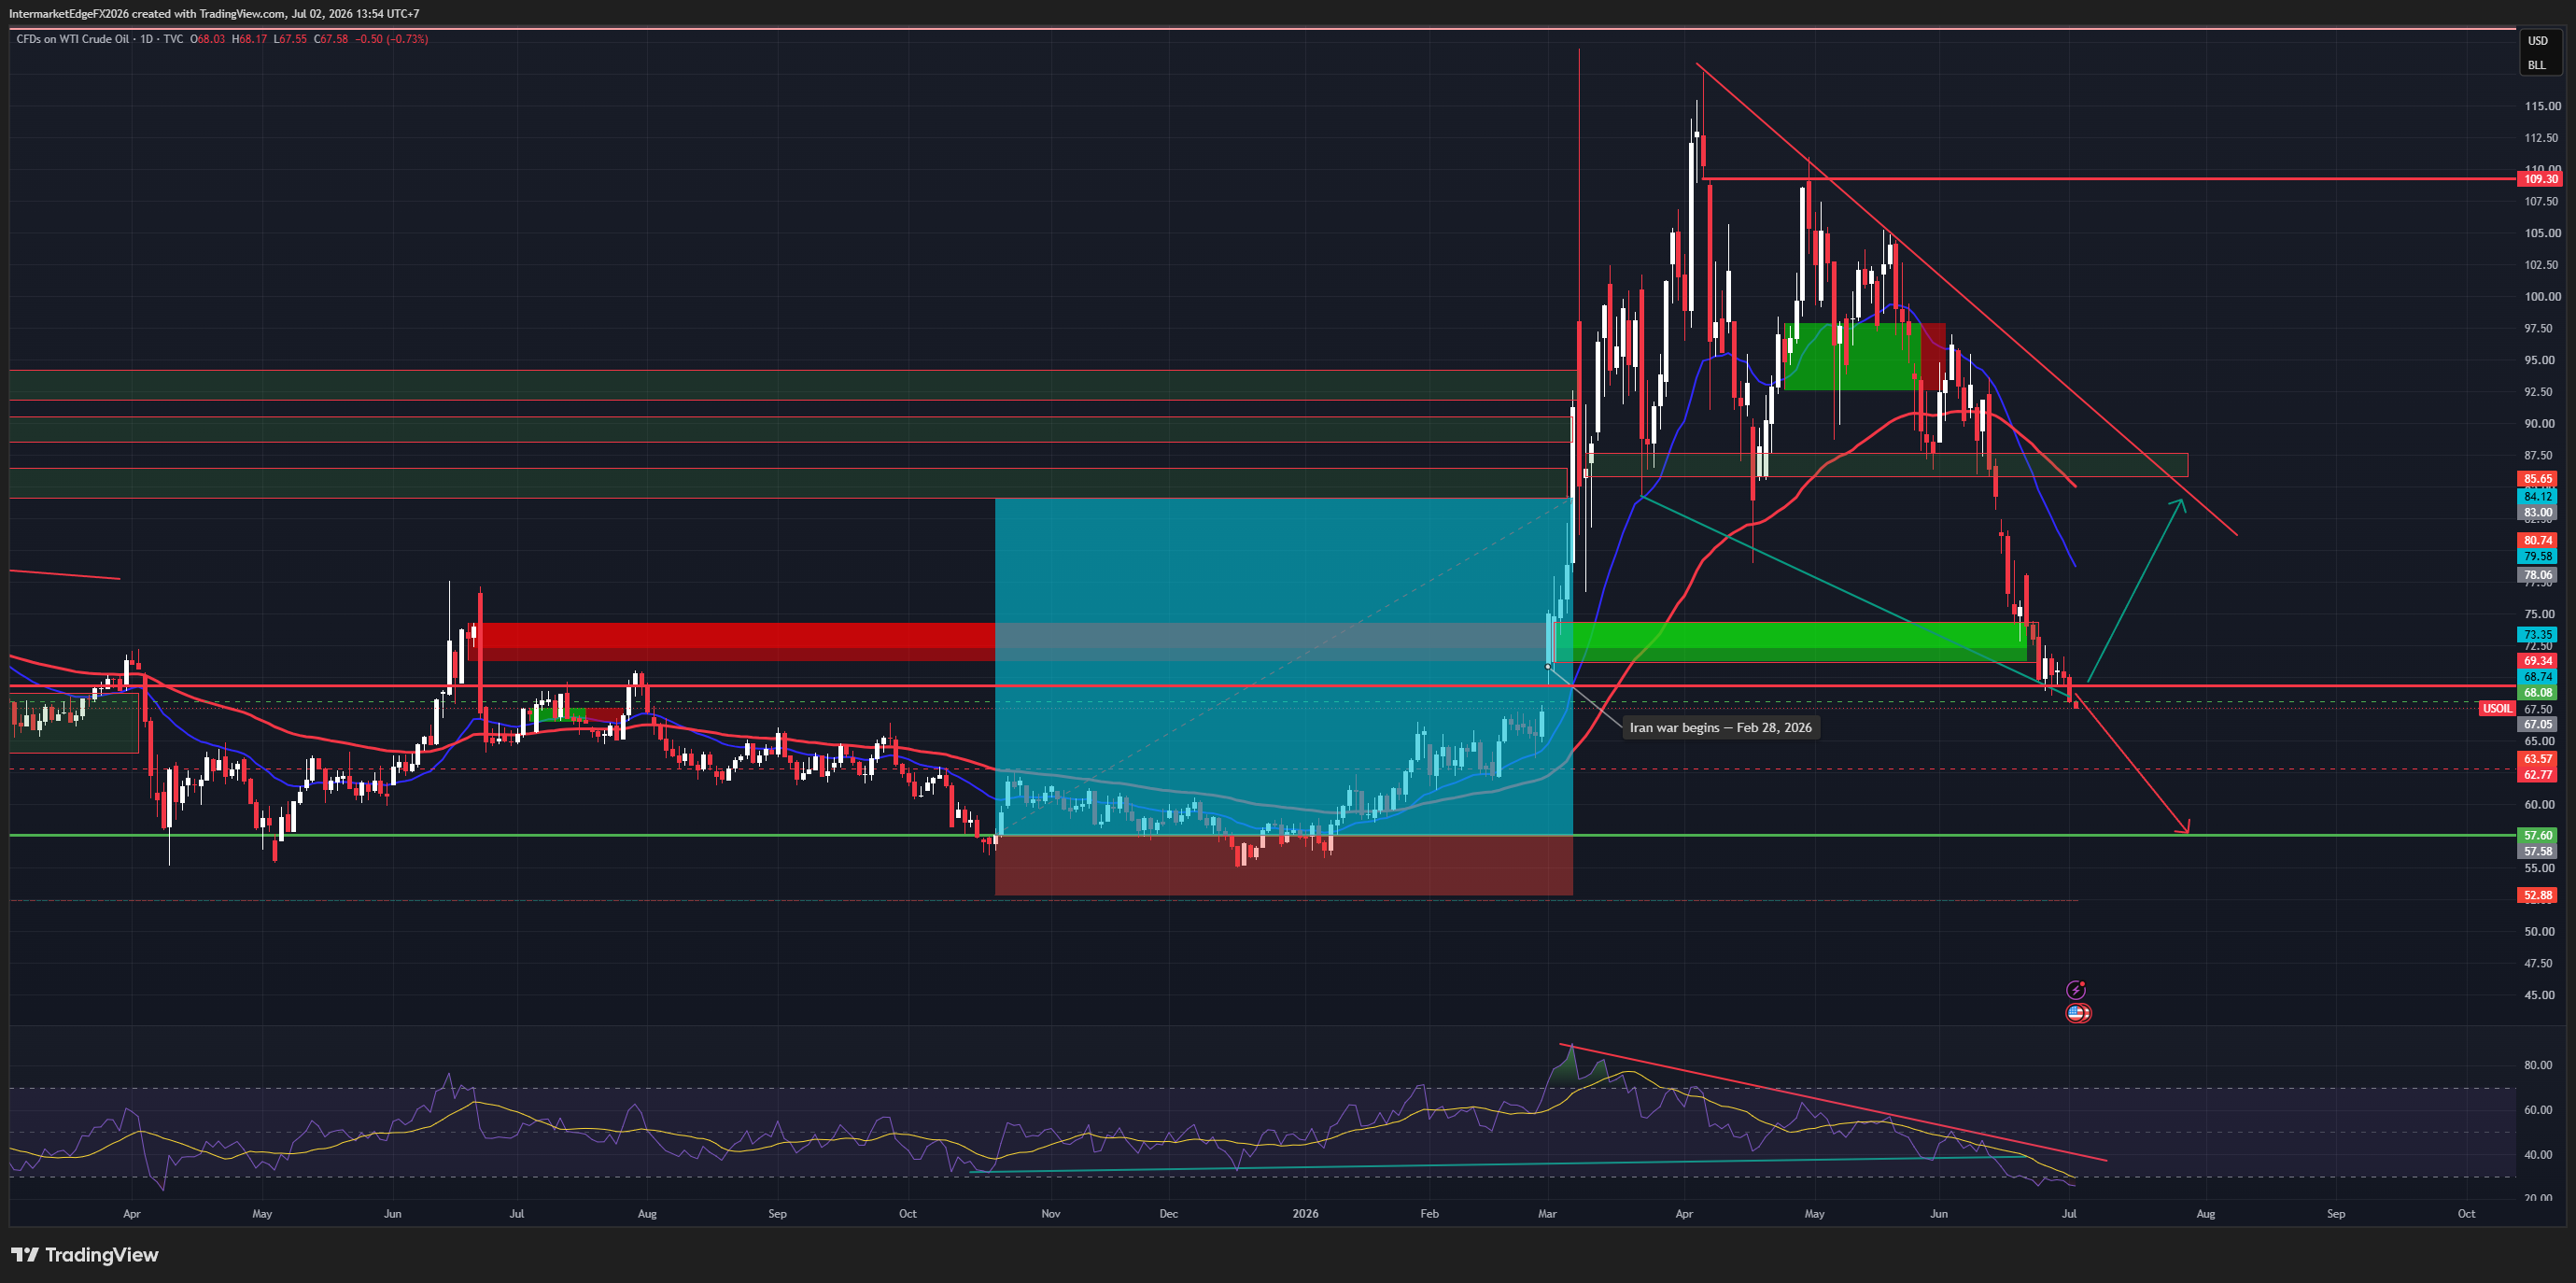
USOIL - SUMMARY 02/07/2026 Regime: High Bear Continues, Supply Narrative in Total Control. USOIL 67.85 (-0.34%), the 67 target from last week's analysis has been hit. Falling channel from the 117.50 war peak remains intact. Bias: High Bear. Core story: 5 consecutive weekly EIA draws totalling -33.3M barrels (1 July: -3.775M vs forecast -2.900M) -- the strongest destocking sequence this year -- and price still fell from 75 to 67.85. When a market ignores the most bullish data available, bulls have lost control. The strongest behavioural bearish signal that exists. Supply narrative: OPEC+ +411kbpd from June, Hormuz flows recovered (OCBC + UBS both cut forecasts), Iran-US talks progressing -- each round another leg lower. Data corrections: EIA -3.775M released (pipeline "awaiting" stale); CPI 4.2% (not 2.4%); real yield +0.28%. D1 structure: 69.34-73.35 support broken. Resistance: 69.34 / 73.35 (channel invalidation). Targets: 63.57 → 62.77 → 57.60 (major support Q4 2025 base -- where OPEC+ fiscal pressure peaks, production-cut intervention likely). Extension: 52.88. Scenarios: downtrend continues to 63.57 (50%); extends to 57.60 (25%); oversold bounce 69-73 then resumes (15%); Iran talks collapse, breakout 73-85 (10%). Event risk: NFP 3 July, EIA 8 July (sixth draw?), OPEC+ communique, Iran talks wildcard. Stops for shorts: above 69.34. For informational purposes only. Not financial advice.

USOIL - Below $71 Confirms the War Premium Fully Erased, Persian Gulf Flows Accelerate as the Market Shrugs Off a -6M Draw

USOIL - Below $71 Confirms the War Premium Fully Erased, Persian Gulf Flows Accelerate as the Market Shrugs Off a -6M Draw

USOIL $69.36 | Below $71, war premium fully erased | 25 June 2026 Last week: "Do not chase shorts into 71.11. A break confirms a further leg, target 67 then 63." It broke. Oil now $69.36, below the pre-war starting point. The most notable signal: the EIA drew 6.088M (forecast just 3.9M), the second consecutive larger-than-expected draw. The market shrugged it off entirely. Oil kept falling. When good news is ignored, the selling force dominates. Three forces: Persian Gulf flows accelerating as Hormuz reopens; global supply recovering + OPEC+ +411kbpd; DXY 101 at a 13-month high. Leading headlines: "Oil Sinks Toward Pre-War Levels", "Crude Oil Falls Below $70", "Oil Market Shrugs Off Large Crude Stock Draw." D1 structure: 71.11 broken (now resistance). Nearby support 67.05 then 63.57 then 62.77. Deep: 57.60 (pre-war bottom). Invalidation: daily close above 74.49. Three scenarios: → Continued decline to 67.05 then 63.57. Probability: 45% → Hormuz fully reopens, accelerates to 57.60. Probability: 25% → Technical bounce to test 71.11 (broken support), resumes lower. Probability: 20% The tell: two consecutive bullish draws, price still falls. The market has answered. Conviction: High Bear (upgraded from Medium Bear). --- Intermarket Edge | Institutional Macro & Intermarket Analysis For informational purposes only. Not financial advice.
USOIL - The War Premium Fully Unwound to Pre-War Support, a Post-FOMC Bearish Tide Meets a Bullish -8.263M Draw

USOIL - The War Premium Fully Unwound to Pre-War Support, a Post-FOMC Bearish Tide Meets a Bullish -8.263M Draw

USOIL $73.58 | War premium fully unwound to pre-war support | 18 June 2026 Oil has handed back nearly the entire Iran-war rally and returned to where it started. Here, a bearish tide meets a bullish draw. The Iran war broke out Feb 28, lifting oil from ~57-70 to a 120 peak (April). The peace deal and the prospect of a Hormuz reopening have drained the haven premium steadily. Now 73.58, back in the pre-war zone. Last night's hawkish FOMC lifted DXY to ~100, VIX to 18.43, equities lower. A strong dollar plus demand risk is another bearish layer for oil. Add OPEC+ raising +411kbpd. But against the tide: the EIA draw was -8.263M (forecast just -3.6M, prior -7.227M). US supply is tightening -- a real support. The newsfeed agrees: "Tightness in US Crude Supplies Supports Prices." The pipeline showed you the wrong field. Pipeline EIA: "awaiting release." Actual: -8.263M. DXY now ~100 (jumped post-FOMC). D1 structure: key support 74.49-71.11 (pre-war zone). Resistance 78.06 → 80.74. A break of 71.11 opens 67-68 → 63.57. Three scenarios: → Hold 71.11 + inventory tightness: technical bounce toward 78-80. Probability: 35% → Break 71.11 (Hormuz fully reopens + OPEC + strong dollar): toward 67 then 63. Probability: 35% → Standoff, bearish macro vs bullish draw: 71-78. Probability: 30% Invalidation: daily close above 80.74. The tell: the 71.11 support against the inventory draws. A break with Hormuz fully reopening sends oil to 67; a hold on tightness bounces it to 78. Do not chase shorts into 71.11. Conviction: Medium Bear at support, two-sided. Intermarket Edge | Institutional Macro & Intermarket Analysis For informational purposes only. Not financial advice.
USDCAD — Canadian Dollar at Eight-Week Low, BoC Holds June 10, Oil Slides, and USMCA Risk Keeps the Loonie Trapped

USDCAD — Canadian Dollar at Eight-Week Low, BoC Holds June 10, Oil Slides, and USMCA Risk Keeps the Loonie Trapped

USDCAD 1.3893 | Canadian Dollar 8-week low | 04 June 2026 The Canadian dollar is at its weakest in eight weeks, and three forces are keeping it there simultaneously. First, oil. WTI has declined from $95.33 this morning to $92.61 — a $2.72 drop in a single session on Iran deal optimism. Canada is the largest crude exporter to the US. The oil-CAD channel is among the most stable relationships in FX, and it is working against the loonie today. The counterintuitive implication: if the Iran deal completes and oil falls toward $80-85, CAD gets weaker, not stronger. USDCAD could test 1.4099 resistance on deal completion. Second, domestic weakness. Canada's Q1 2026 GDP contracted for a second consecutive quarter. BoC core inflation measures slowed to five-year lows. The Bank of Canada meets June 10 and is expected to hold at 3.25% — but a dovish tone acknowledging the growth weakness would push USDCAD toward 1.4000-1.4050. Third, USMCA risk. AUDCAD at 0.9920 — below the 1.000 parity level — confirms the structural CAD discount from trade uncertainty is still live. Until AUDCAD holds above 1.000, CAD carries a structural discount that cannot be removed by oil alone. On the chart, price is approaching the 1.4099-1.4139 resistance zone. A daily close above 1.4099 confirms the bull move. A daily close below 1.3593 activates wave (c) lower toward 1.3477 then 1.3400. BoC June 10 is the gating event. Conviction: Medium, Mildly Bullish.

Stay in the loop

Get notified about new research, macro insights, and market analysis.

InterMarketEdge

© 2026 InterMarketEdge. Financial intelligence for inter-market traders.