Tag: Fed — InterMarketEdge

Tag: Fed

DXY W43: Euro Weakness Supports a Dollar With Fragile Momentum

DXY W43: Euro Weakness Supports a Dollar With Fragile Momentum

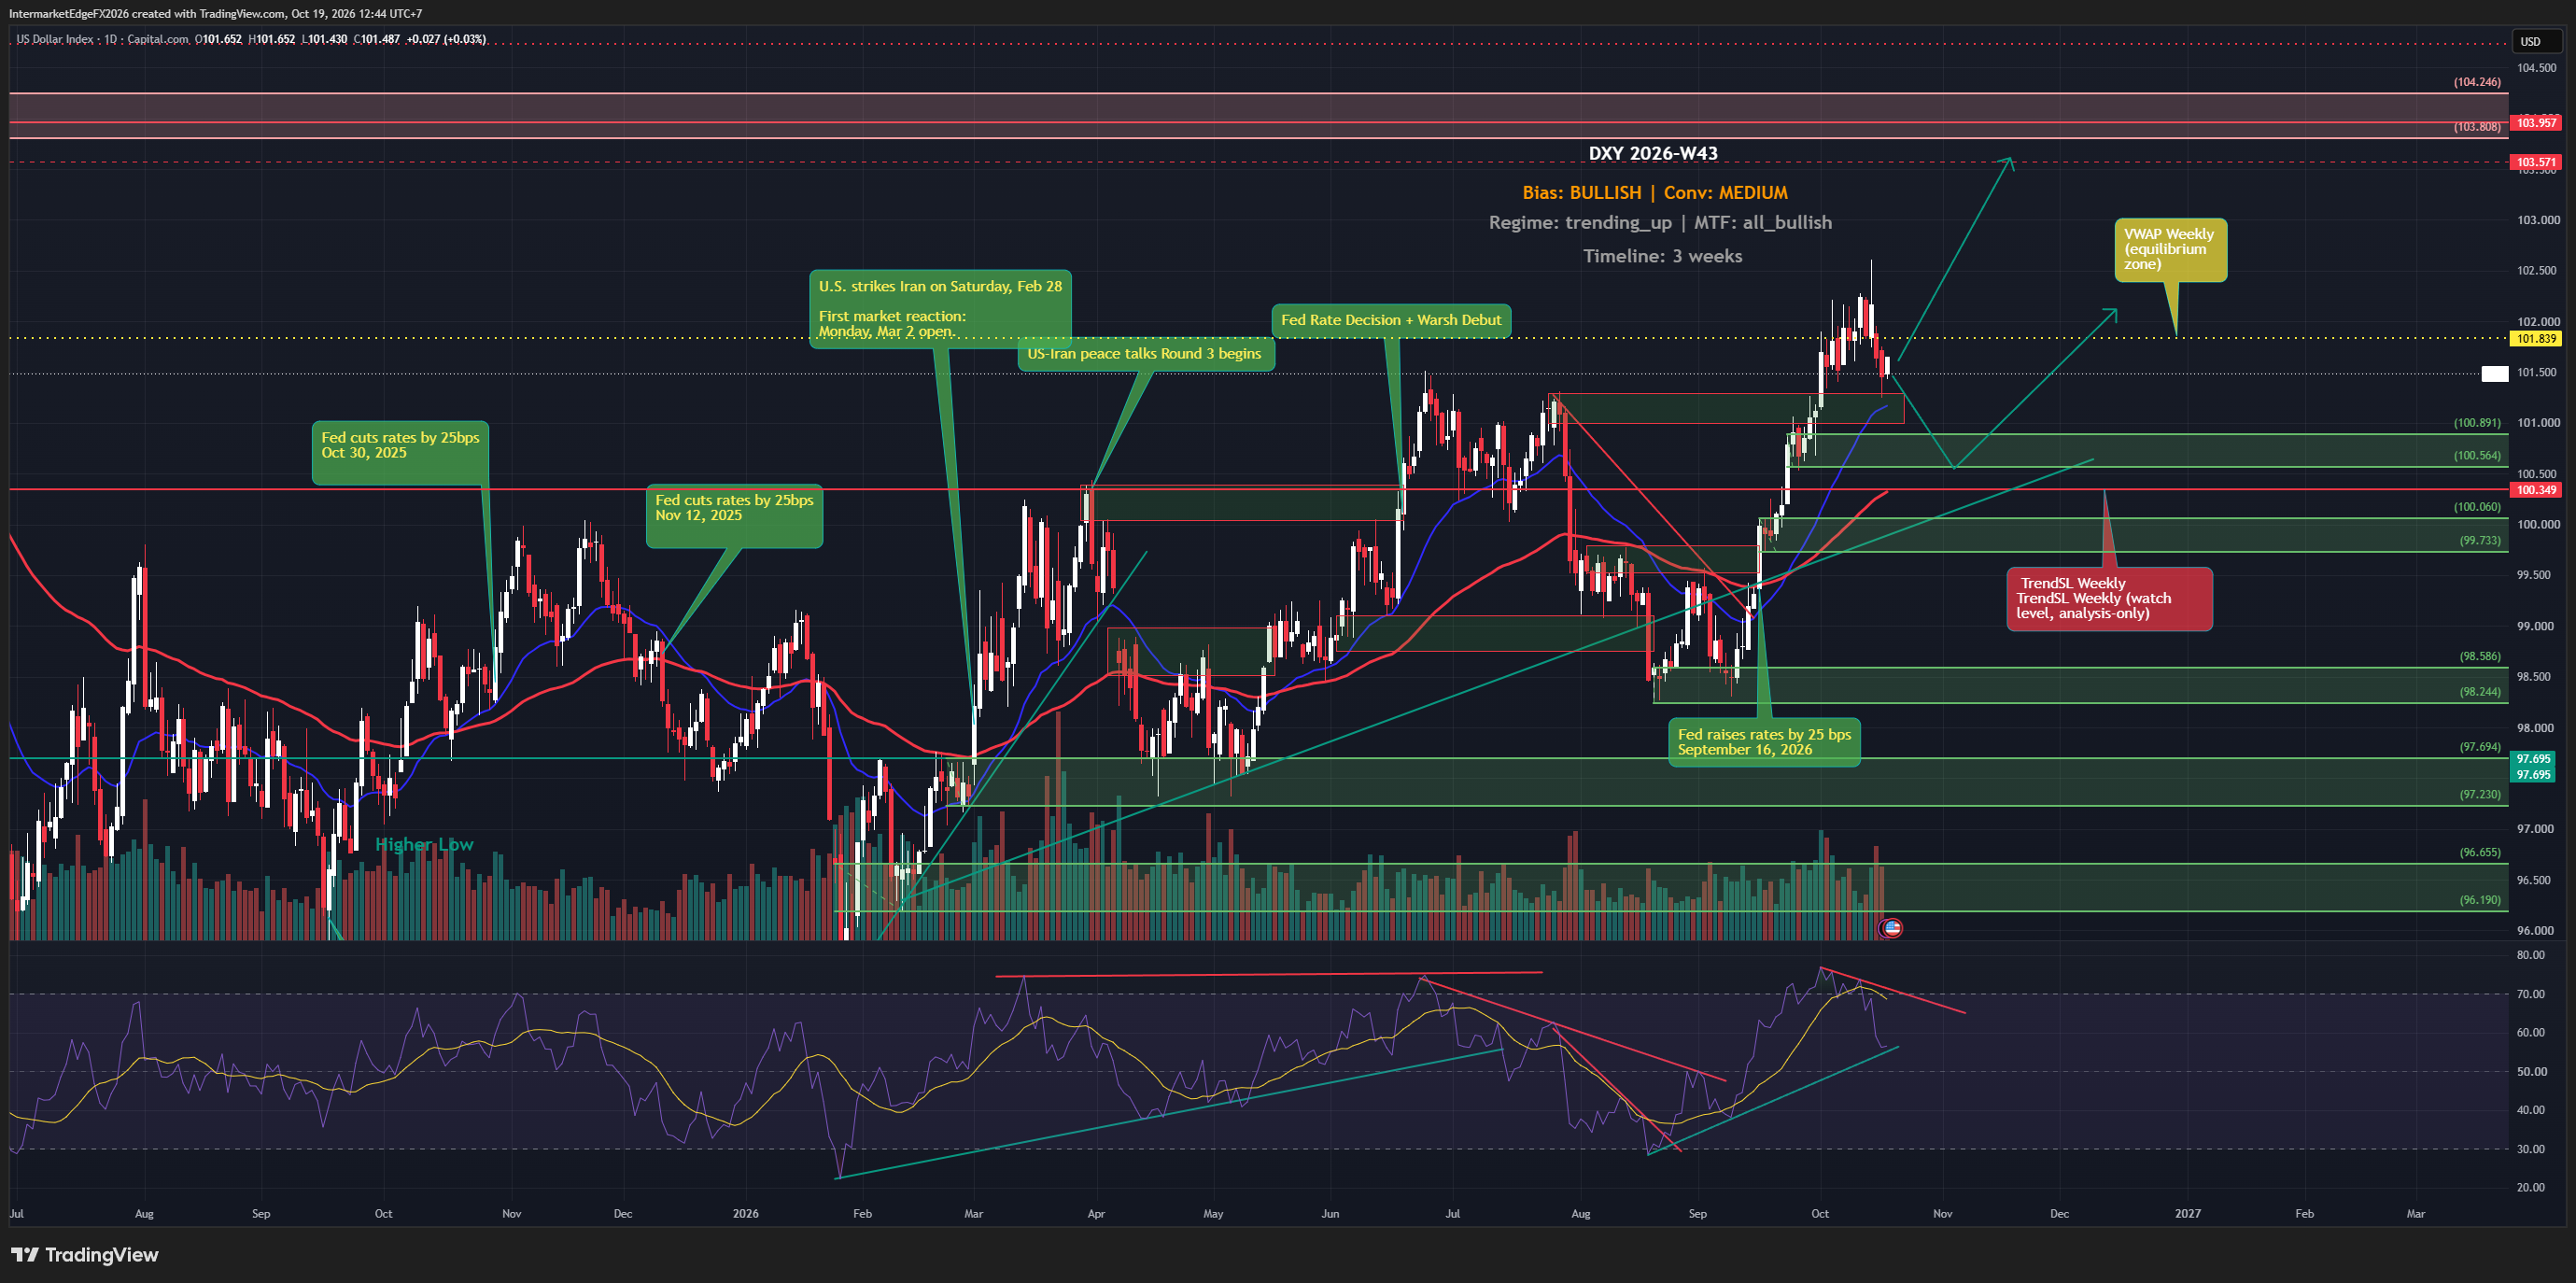
DXY W43: An upward structure with an active momentum warning. At 05:15 UTC on 19 October 2026, DXY was 101.811, below weekly VWAP 101.839 and above weekly TrendSL 100.349. Source: yfinance:DX-Y.NYB:1m. This is a timestamped observation, not a live quote. The momentum warning is already active: price is below the weekly average, so existing long exposure warrants reduced size and risk reassessment now. Structural invalidation remains pending: a weekly close below TrendSL 100.349 would invalidate the bullish structure. An intraday dip does not satisfy that weekly closing condition. Reuters on 19 October reported EUR weakness following unrest in France and softer Treasury yields alongside falling oil and AI funding concerns. Euro weakness can support the index without proving broad USD strength. Fading Fed hike expectations reported on 16 October are prior-week context that needs updating. The three-week view remains bullish with medium confidence. New positions can wait for better agreement. A sustained recovery around the developing weekly average would ease the momentum warning; no daily or weekly closing requirement is attached to that watch. Compare yields across countries before making a relative-rate claim. Intermarket Edge | Institutional Macro & Intermarket Analysis For informational and educational purposes only. Not financial advice.
DXY W42: Inflation Week Tests an Unconfirmed Bearish View

DXY W42: Inflation Week Tests an Unconfirmed Bearish View

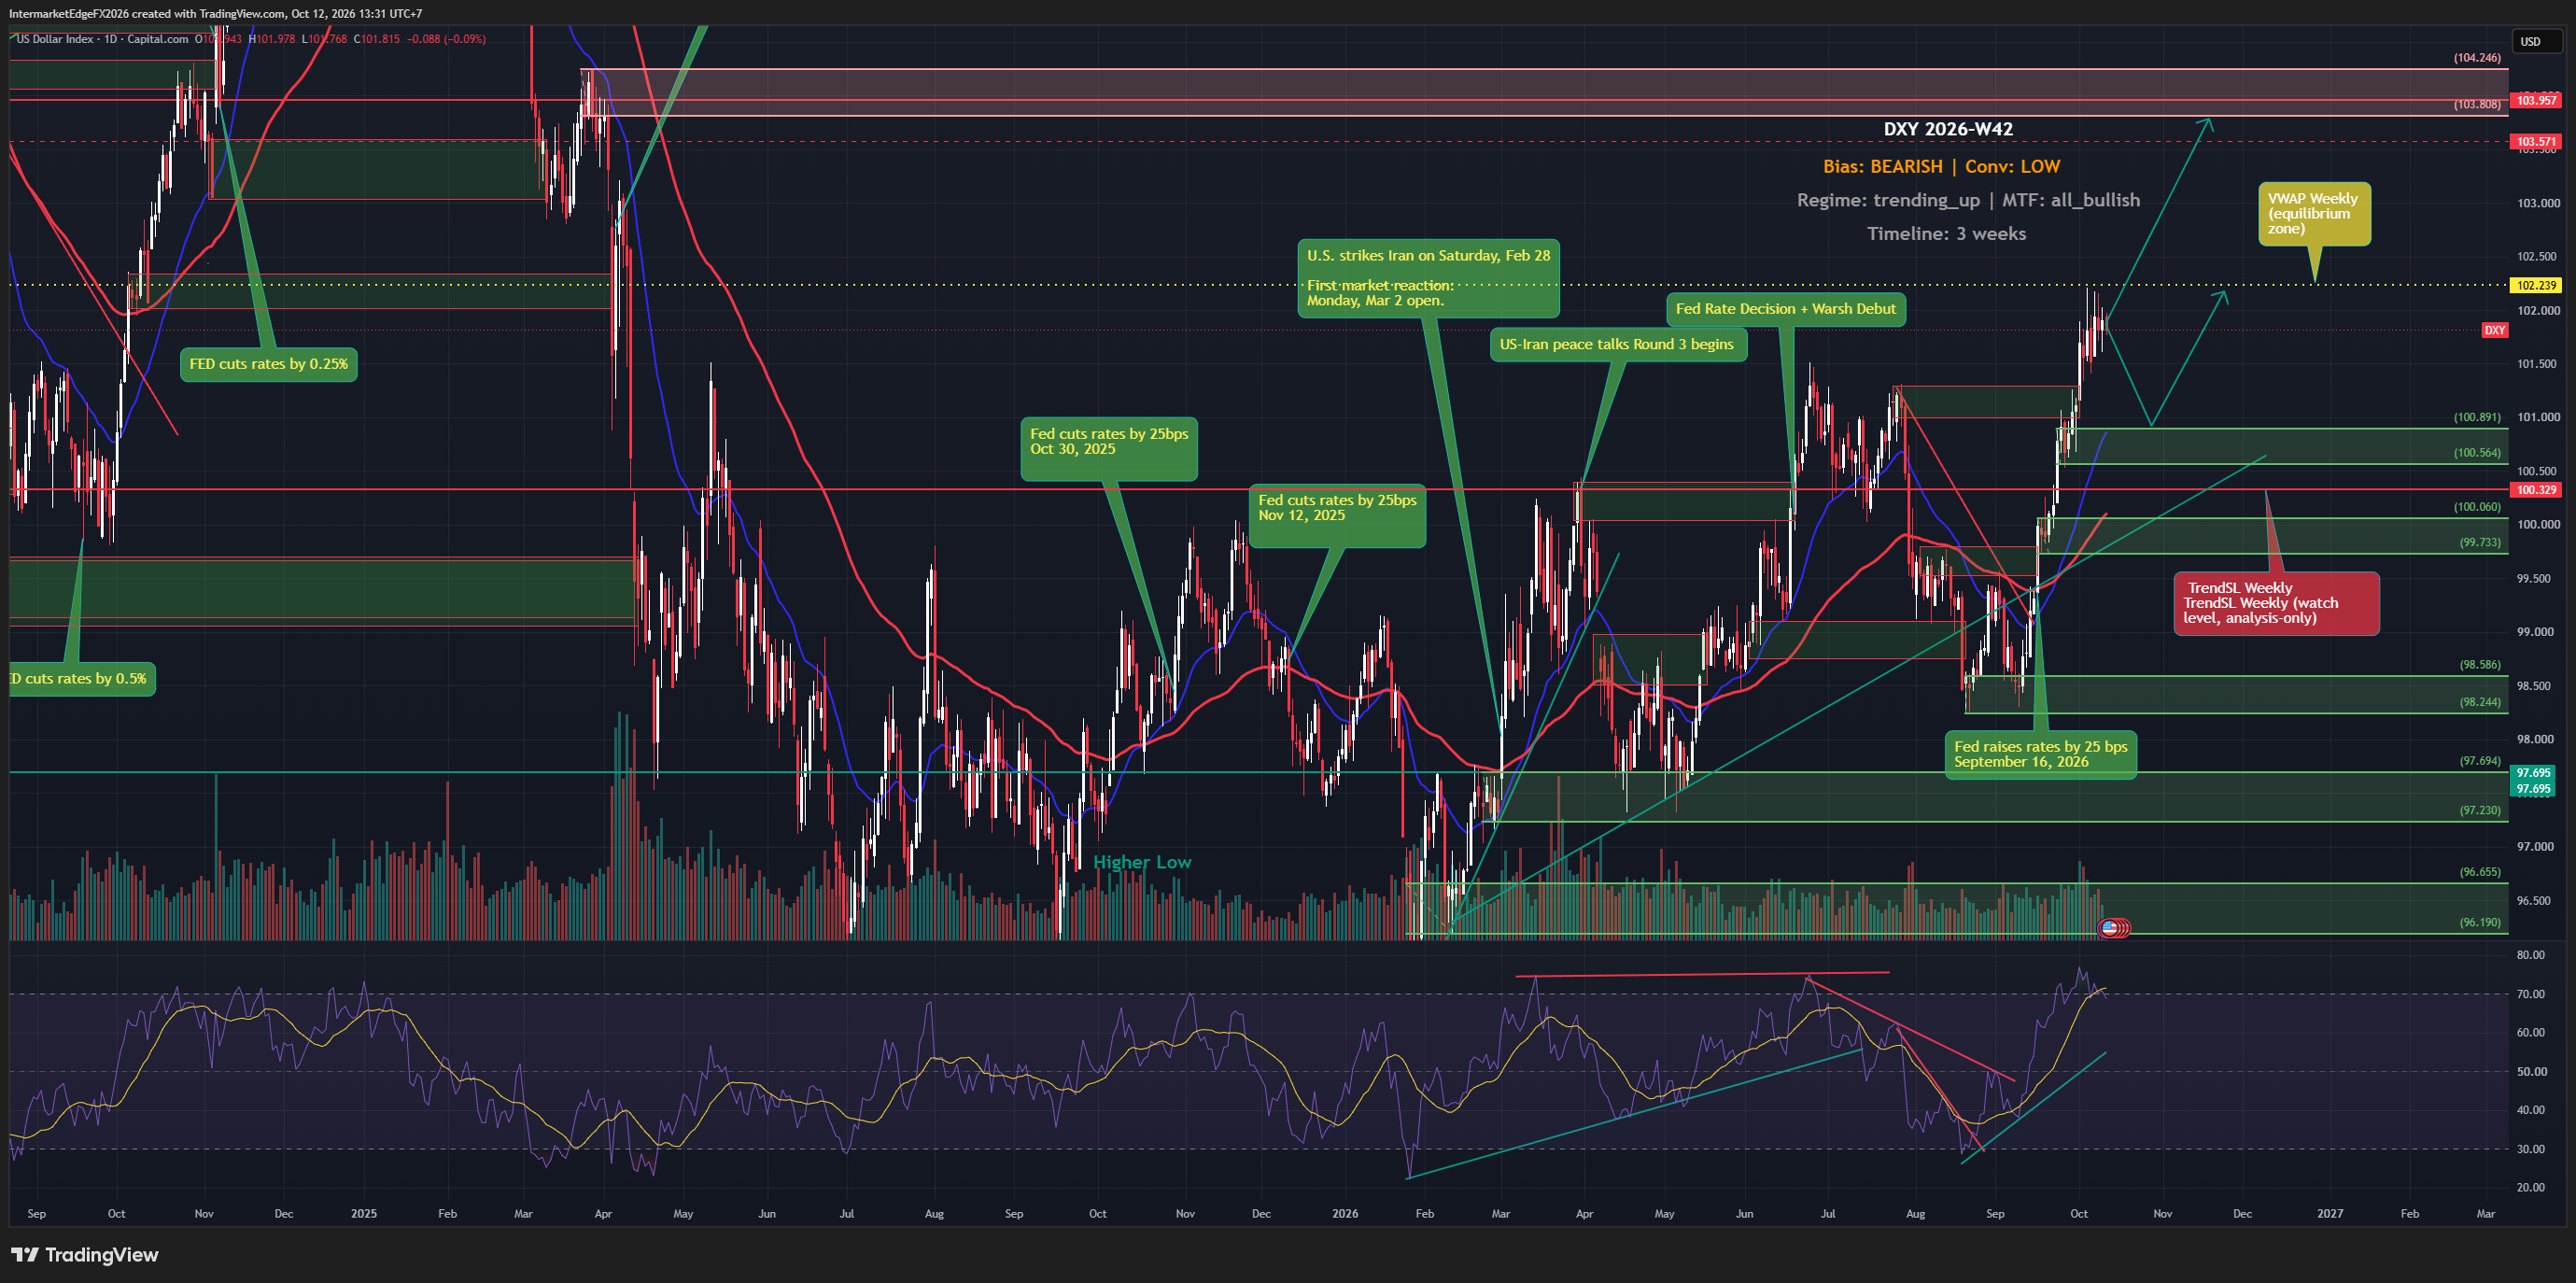
DXY W42 retains a bearish view with low confidence over three weeks, but daily, weekly and monthly trend assessments remain upward. The technical conflict is already active. At 12/10/2026 06:15 UTC, DXY was 102.218, below weekly VWAP 102.239. Price is already above weekly TrendSL 100.329. Source: yfinance:DX-Y.NYB:1m, a timestamped one-minute observation. A completed weekly close below 100.329 would provide bearish structural confirmation. This condition remains pending; an intraday move is not a completed weekly close. Sustained strength on the higher side of the weekly average would work against the bearish view. This momentum watch has no weekly-close requirement. A one-minute quote cannot establish sustained acceptance. Reuters on 12 October highlighted upcoming US inflation data and uncertainty around oil supply. ForexFactory lists CPI on 14 October, retail sales and PPI on 15 October, and a Fed Chair appearance on 16 October; it is a secondary calendar source. Monitor oil, EURUSD and yields together. Waiting for clearer agreement avoids confusing a directional view with an entry signal. --- Intermarket Edge | Institutional Macro & Intermarket Analysis For informational and educational purposes only. Not financial advice.
EURUSD W41: Fiscal Stress Weighs, but the Entry Case Remains Unclear

EURUSD W41: Fiscal Stress Weighs, but the Entry Case Remains Unclear

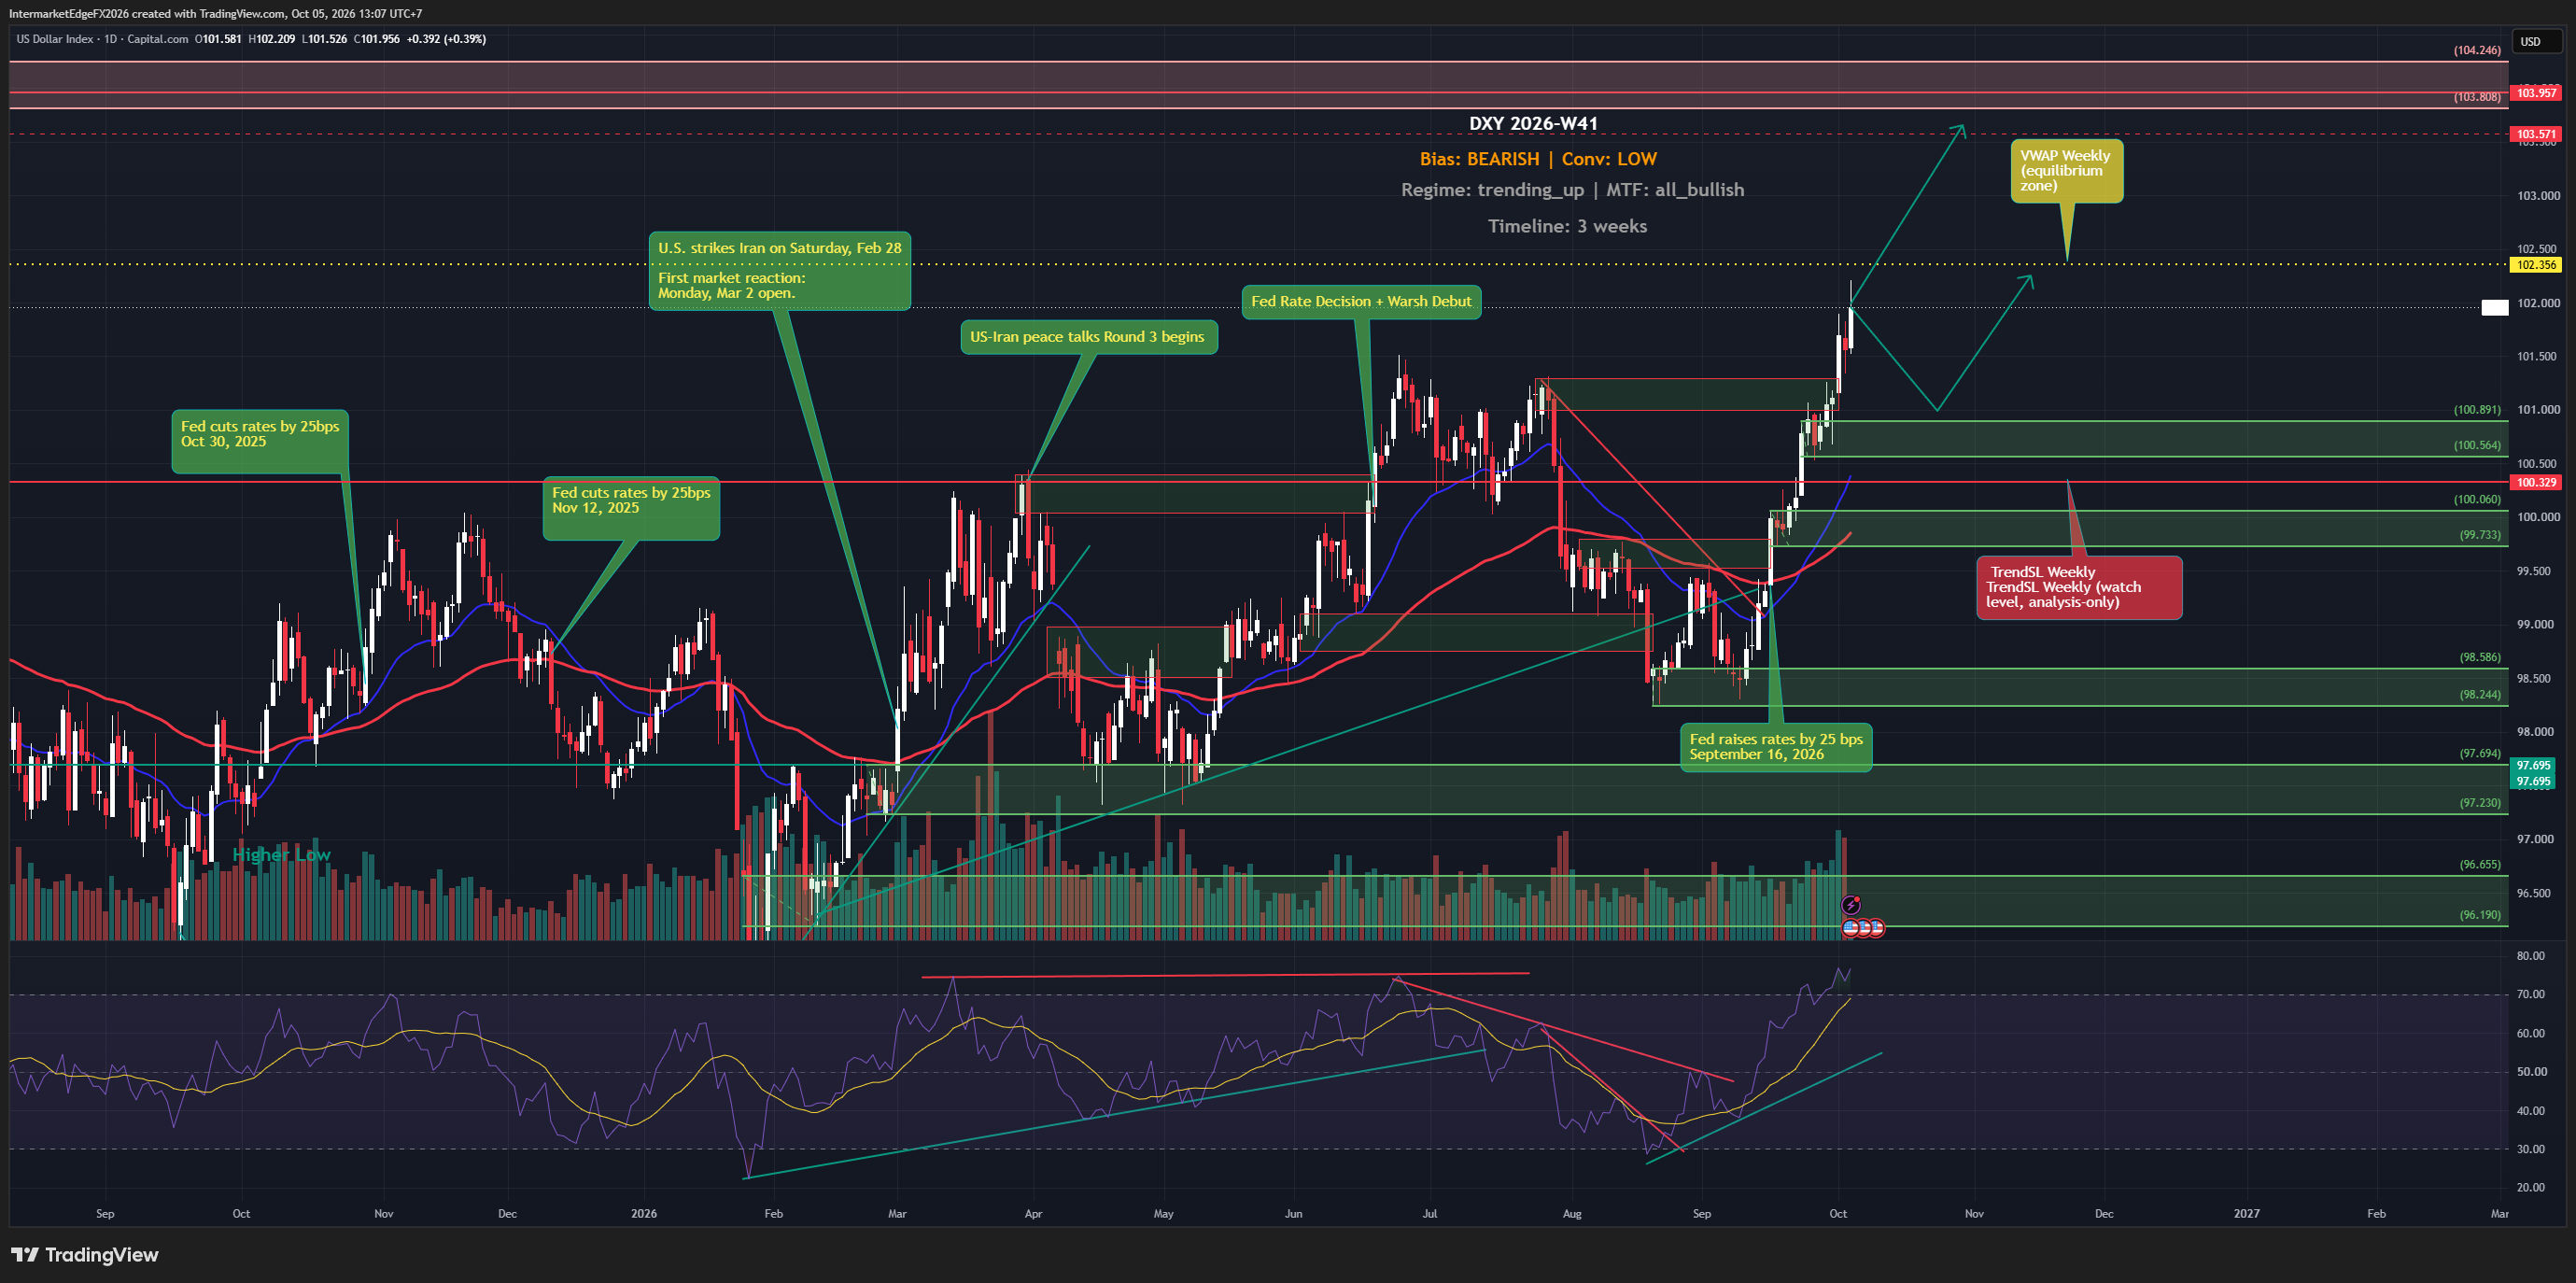
EURUSD W41 | Fiscal pressure, uncertain entry timing At 14:24 UTC on October 7, 2026, EURUSD was 1.11881 (MT5 EURUSD.sml:1m), below weekly VWAP 1.12167 and weekly TrendSL 1.14682. The broader trend points downward, but positive short-term signals reduce agreement. The bearish view has low conviction; standing aside avoids forcing a fresh entry. If price sustains above 1.12167, momentum would work against the bearish view and call for a short-side risk review. Only a completed weekly close above 1.14682 would invalidate the bearish structure. Both conditions remain pending at the quoted observation. FXSSI collected at 14:24:09 UTC on October 7: 77% Buy / 23% Sell. This is collection time. The broker retail sample does not represent the entire FX market or provide a standalone entry signal. Watch the dollar, comparable US-euro-area yields and French-German sovereign spreads. Related French fiscal headlines are not independent bearish confirmations. ForexFactory lists Fed minutes at 18:00 UTC on October 7 (01:00 GMT+7, October 8), after this snapshot. This secondary calendar is not officially verified. The minutes describe an earlier meeting, not its response to later data. Three weeks is a review horizon, not a target deadline. Prices are dated references, not live quotes. Intermarket Edge | Institutional Macro & Intermarket Analysis For informational purposes only. Not financial advice.
DXY W41: Softer US Jobs Meet a Weaker Euro

DXY W41: Softer US Jobs Meet a Weaker Euro

Weaker US hiring has reduced expectations of an October Fed increase, while French fiscal concerns are weighing on the euro. Those forces pull DXY in opposite directions: a less supportive US policy outlook versus weakness in the index's largest currency component. At 05/10/2026 05:55 UTC, DXY was 102.350 (source: yfinance:DX-Y.NYB:1m). Price was effectively at weekly VWAP 102.347 and above weekly TrendSL 100.329. Near-term momentum is balanced around the weekly average; a decisive move is not established. The broader trend assessment remains upward across daily, weekly and monthly charts at thesis generation. The bearish view therefore carries low confidence over the three-week horizon. Two references matter: • Weekly VWAP is a momentum reference, not an automatic structural break. A sustained recovery on its higher side would work against the bearish view. • Price is already above weekly TrendSL. A completed weekly close below 100.329 would provide bearish structural confirmation. That condition remains pending; an intraday move cannot activate it. -- Intermarket Edge

DXY Week W40-2026: Every Timeframe Points Up, Yet the Framework Calls Bearish — Who Is Wrong?

DXY Week W40-2026: Every Timeframe Points Up, Yet the Framework Calls Bearish — Who Is Wrong?

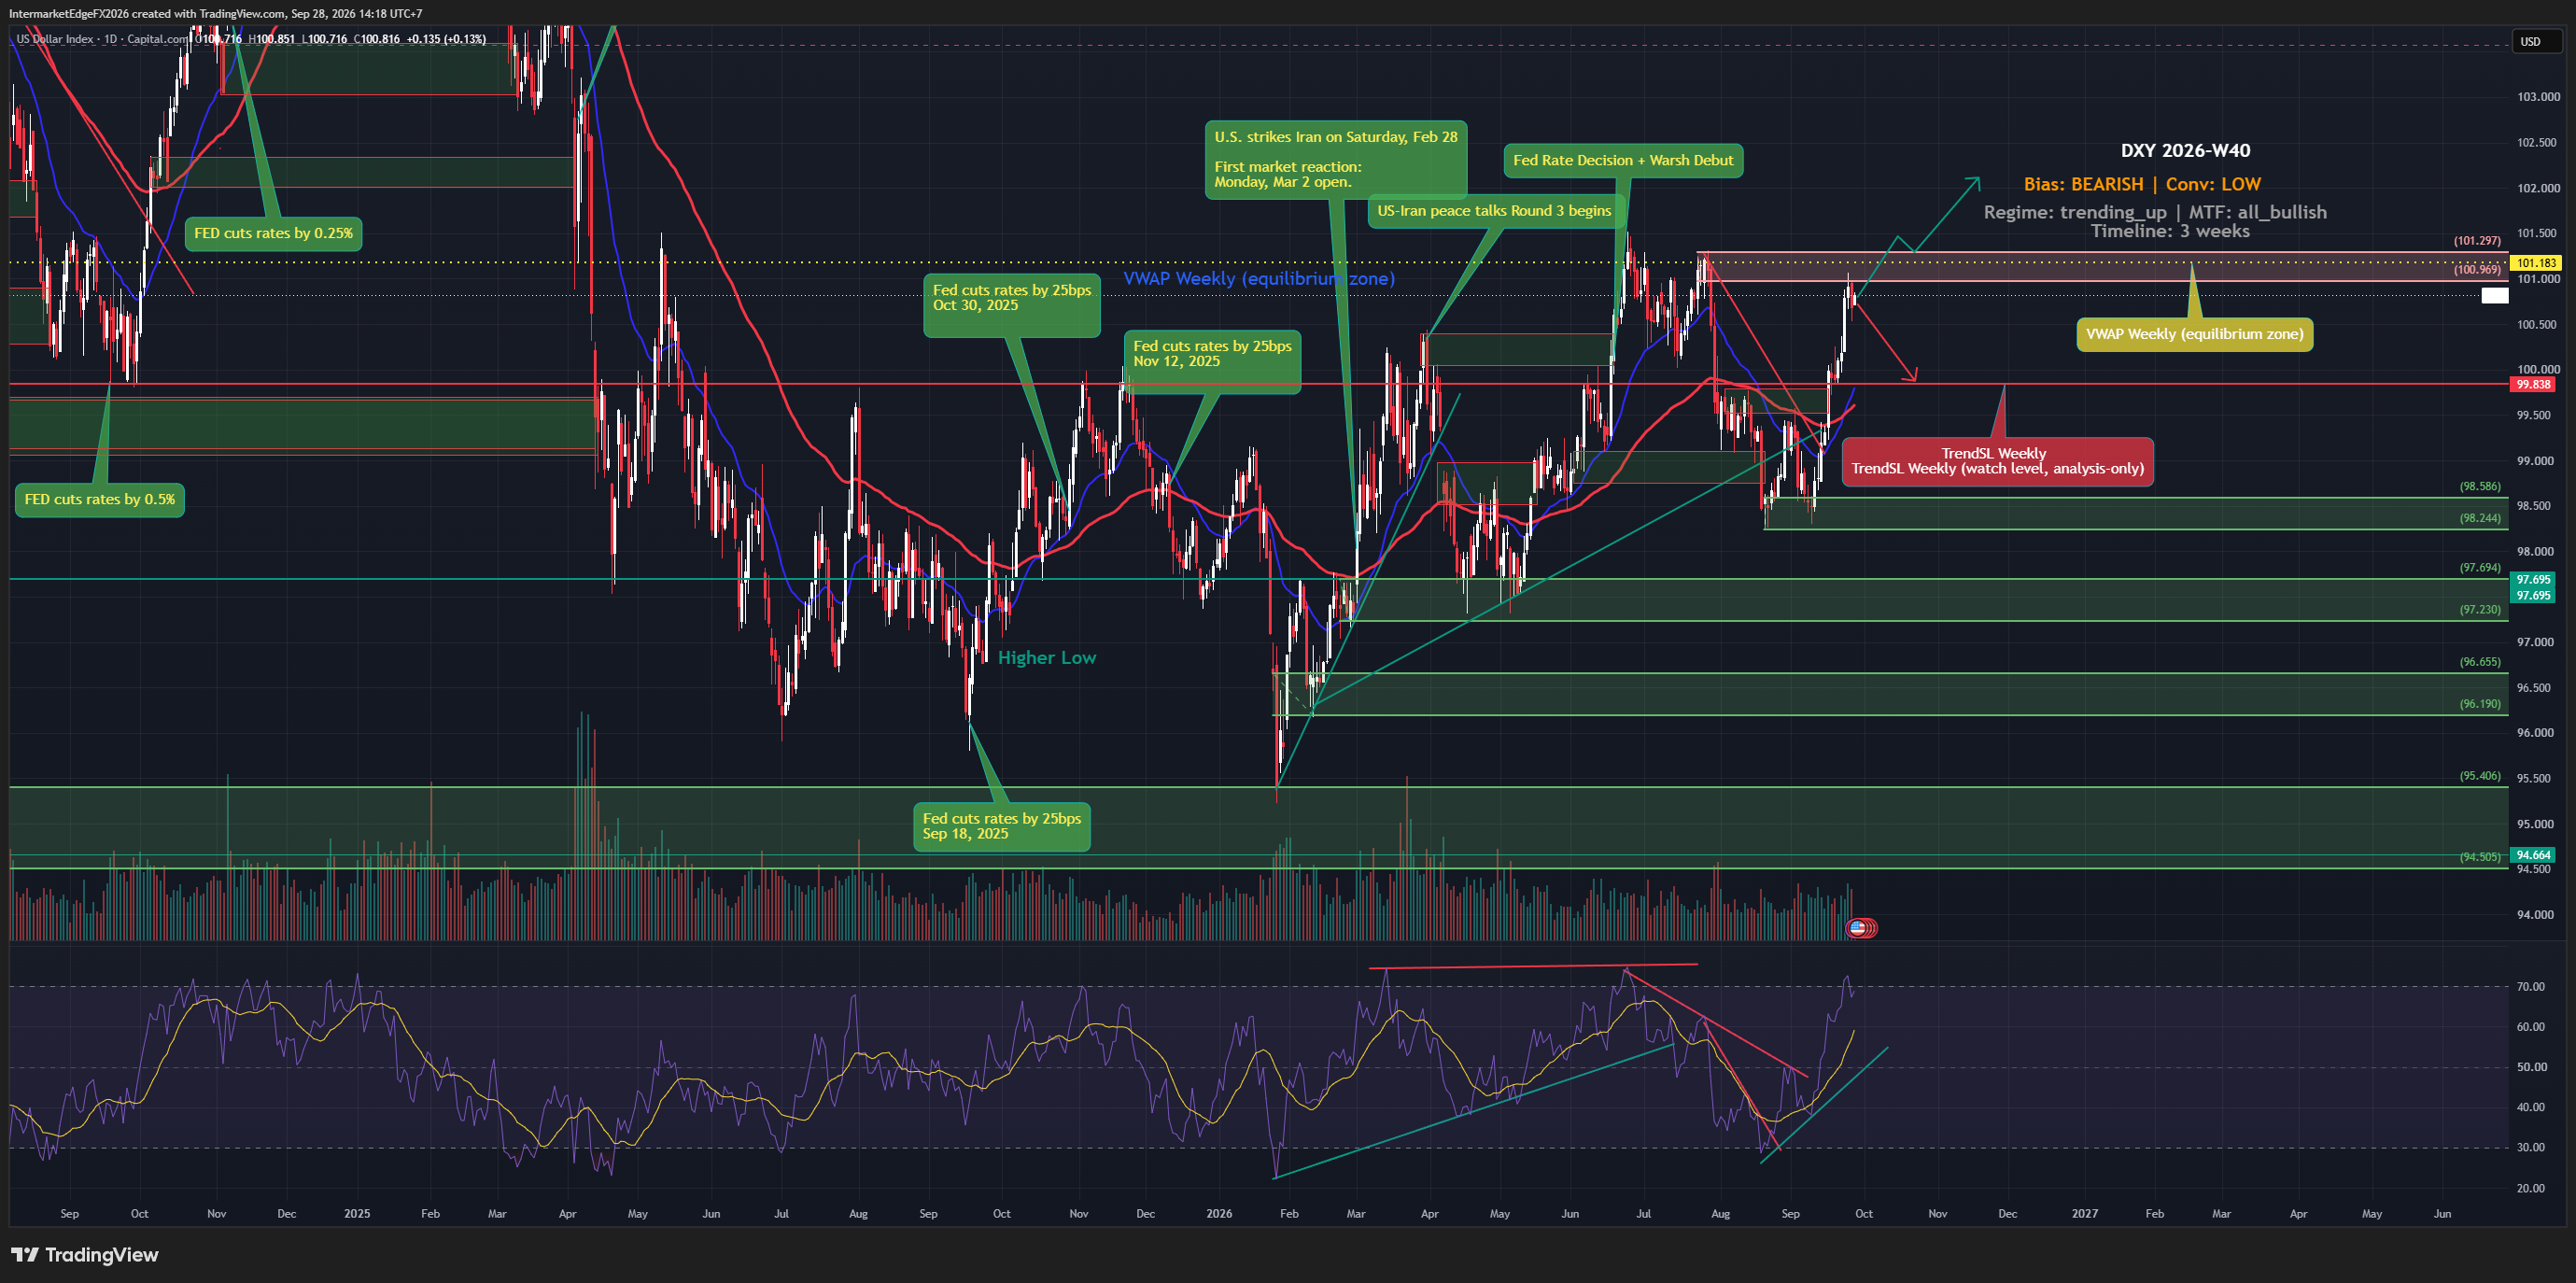
DXY W40: bullish structure challenges a low-conviction bearish bias. The framework remains bearish over a three-week horizon, but daily, weekly, and monthly technical signals are bullish. At 07:01 UTC on Monday, September 28, DXY was 101.188, testing the weekly VWAP area at 101.183 and remaining above the weekly TrendSL at 99.838. Reuters reports that US-Iran tensions are lifting oil while hawkish Fed expectations and Treasury yields are rising. That mix currently supports the dollar counter-case. The COT information in the brief lacks the report week, release date, CFTC code, and net-position figure, so it is directional context only and cannot confirm a current flow or trade trigger. A sustained reclaim of 101.183 would add near-term pressure against the bearish thesis. A completed weekly close below 99.838 would provide the first bearish structural confirmation; that condition remains pending. Core PCE and Final GDP are scheduled for September 30, followed by payrolls, earnings, and unemployment data on October 2, according to ForexFactory. These releases may change rate expectations, but their outcomes are still unknown. The practical decision is to wait for price or macro evidence to resolve the conflict rather than treat the bearish label as a standalone trade signal. Reference price: 101.188 at 07:01 UTC on September 28, 2026; source yfinance:DX-Y.NYB:1m. Educational content only.

USDJPY Week W39-2026: JGB Yields Hit 30-Year Highs Yet the Yen Still Can't Rally -- Who Is Trapped?

USDJPY Week W39-2026: JGB Yields Hit 30-Year Highs Yet the Yen Still Can't Rally -- Who Is Trapped?

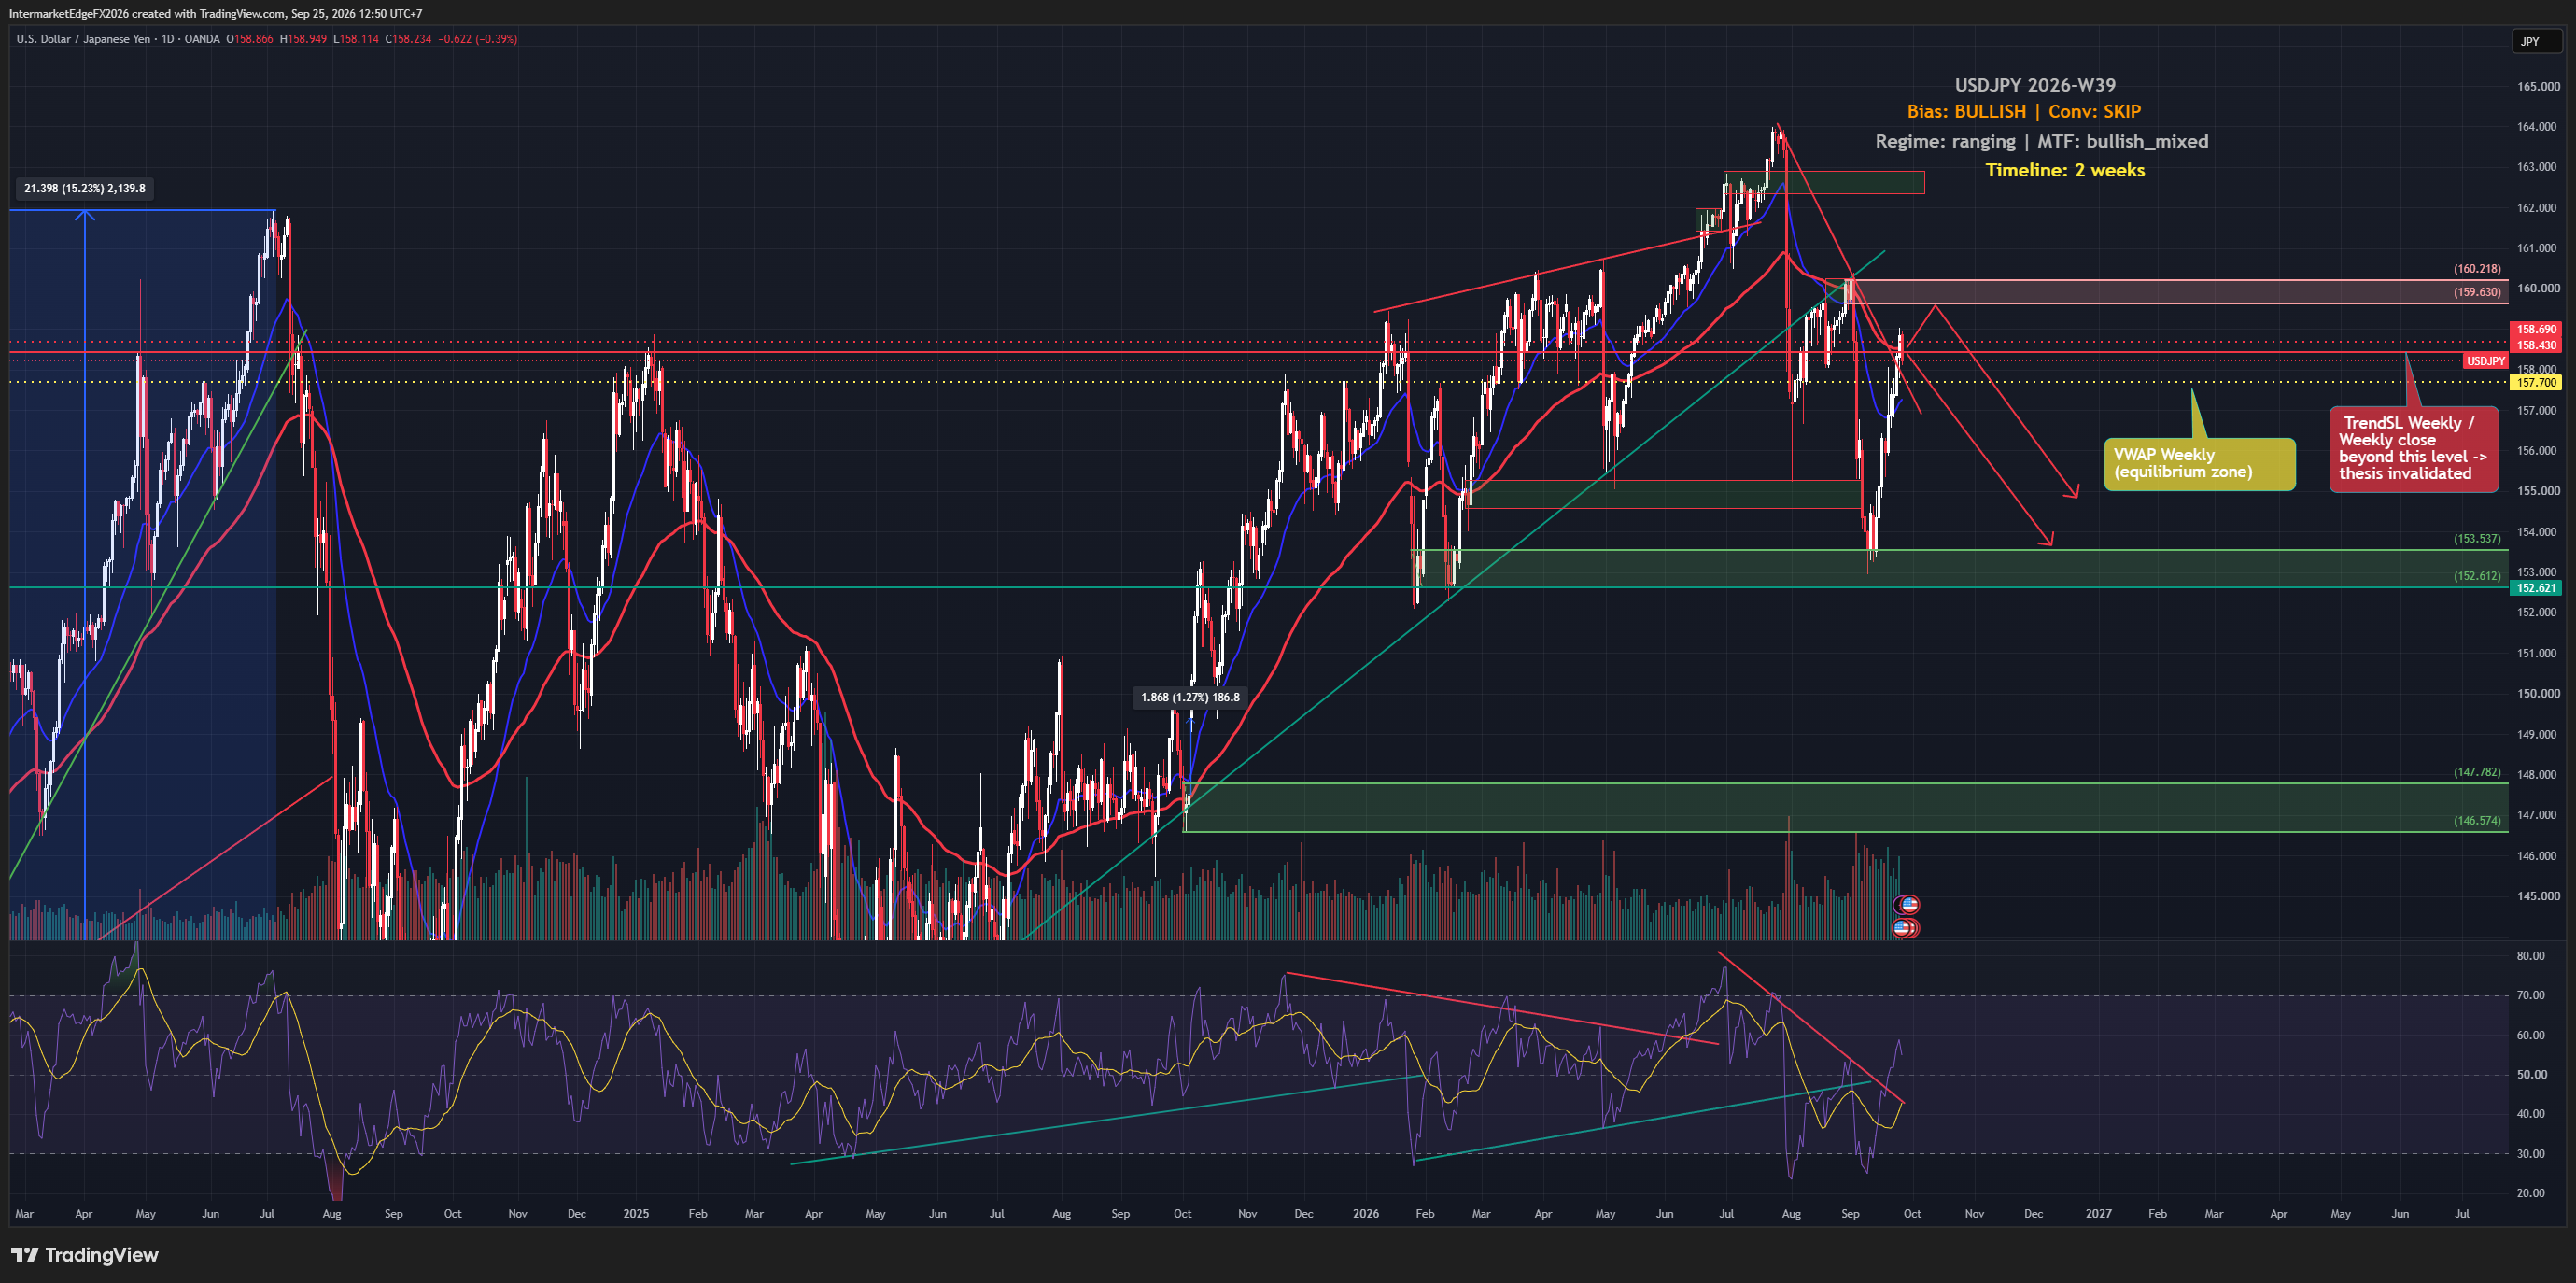
USDJPY is sitting at 158.47 as of Friday, 25 September 2026, having just cleared the weekly TrendSL at 158.43, a level that, if held on close, would mark the first genuine technical alignment with the bullish bias. But that clearance is barely four pips wide, and it arrives at the same moment Japan's 10-year JGB yield has surged to 3.115%, its highest since August 1996, raising serious questions about whether the yen's weakness can last. The analytical framework produces a bullish bias for USDJPY over the next two weeks, but the conviction attached to that bias is low enough that standing aside is the deliberate call, not because the direction is wrong, but because the evidence is not yet convincing enough to size a meaningful position. Understanding why requires separating the two forces that should, in theory, both be clear: macro supports dollar strength through rising US real yields and hawkish Fed expectations, and price action has technically edged above the weekly TrendSL at 158.43. That combination sounds straightforward. What makes it fragile is the COT signal, positioning data from derivatives markets shows speculative traders are already carrying a significant net bearish lean on USDJPY. The COT reading reported here should be read as directional evidence rather than a standalone citable statistic, since the specific report week, release date, and exact net-position figures are not available in this brief, but the directional weight it carries is material enough to cancel the bullish case built by price action alone. The deeper risk is structural. BOJ hawkishness is the most important counterweight in this cycle: higher Japanese yields can encourage repatriation and make yen-funded positions more expensive, allowing USDJPY to fall quickly if policy expectations shift. -- Intermarket Edge

EURUSD Week W39-2026: Dollar Firms Toward a Ten-Week Low as the Fed-ECB Rate Gap Widens

EURUSD Week W39-2026: Dollar Firms Toward a Ten-Week Low as the Fed-ECB Rate Gap Widens

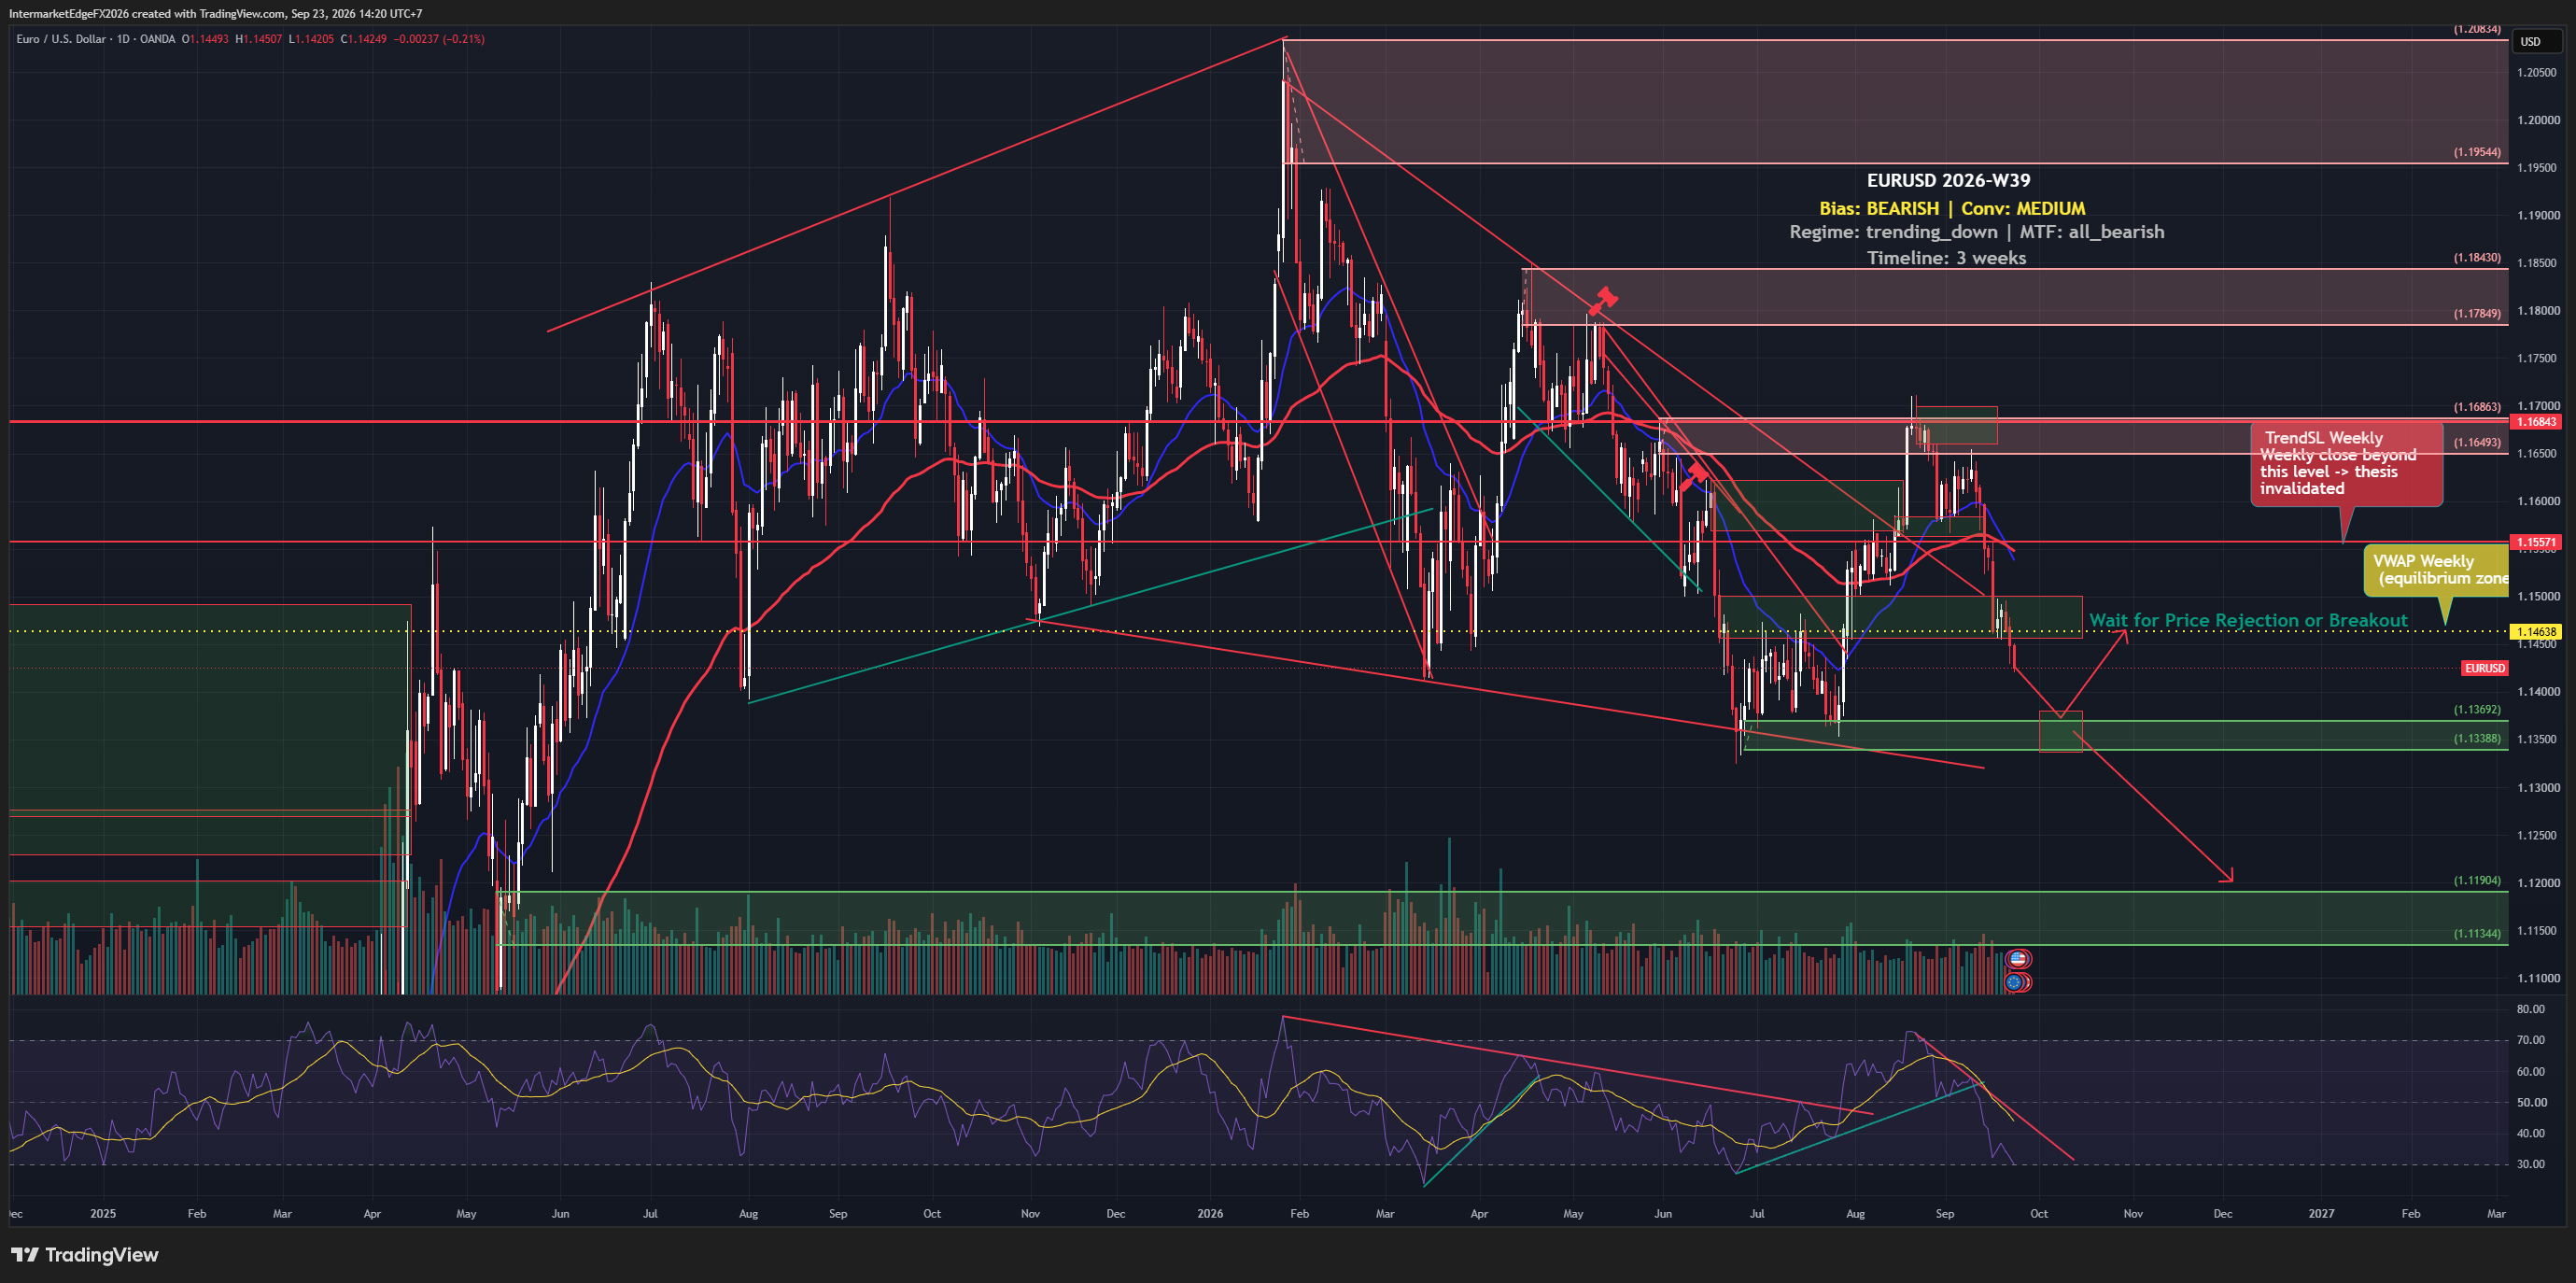
EURUSD is trading near a ten-week low, but the case is more specific than a simple strong-dollar story. At the Wednesday, 23 September 2026 observation, price was 1.14263, below weekly VWAP at 1.14638 and weekly TrendSL at 1.15571. The Fed's hawkish optionality and a US 10-year real yield of 2.62% leave the relative rate backdrop more supportive of the dollar, even after the ECB's September rate increase. Oil weakness could reduce part of the energy-inflation pressure behind the ECB's move, although that effect remains a scenario rather than a known policy outcome. DXY and short-term technical signals do not offer perfect confirmation, so conviction remains medium. FXSSI reports 66% of its broker-level sample net long EURUSD; that is contrarian context only. A sustained move above 1.14638 would warn that short-term momentum is turning against the thesis. A weekly close above 1.15571 would invalidate the bearish structure. The decision framework favors patience rather than chasing weakness near the recent low.

GBPUSD Week W38-2026: Yield Pushes Toward 5% but the Dollar Refuses to Confirm

GBPUSD Week W38-2026: Yield Pushes Toward 5% but the Dollar Refuses to Confirm

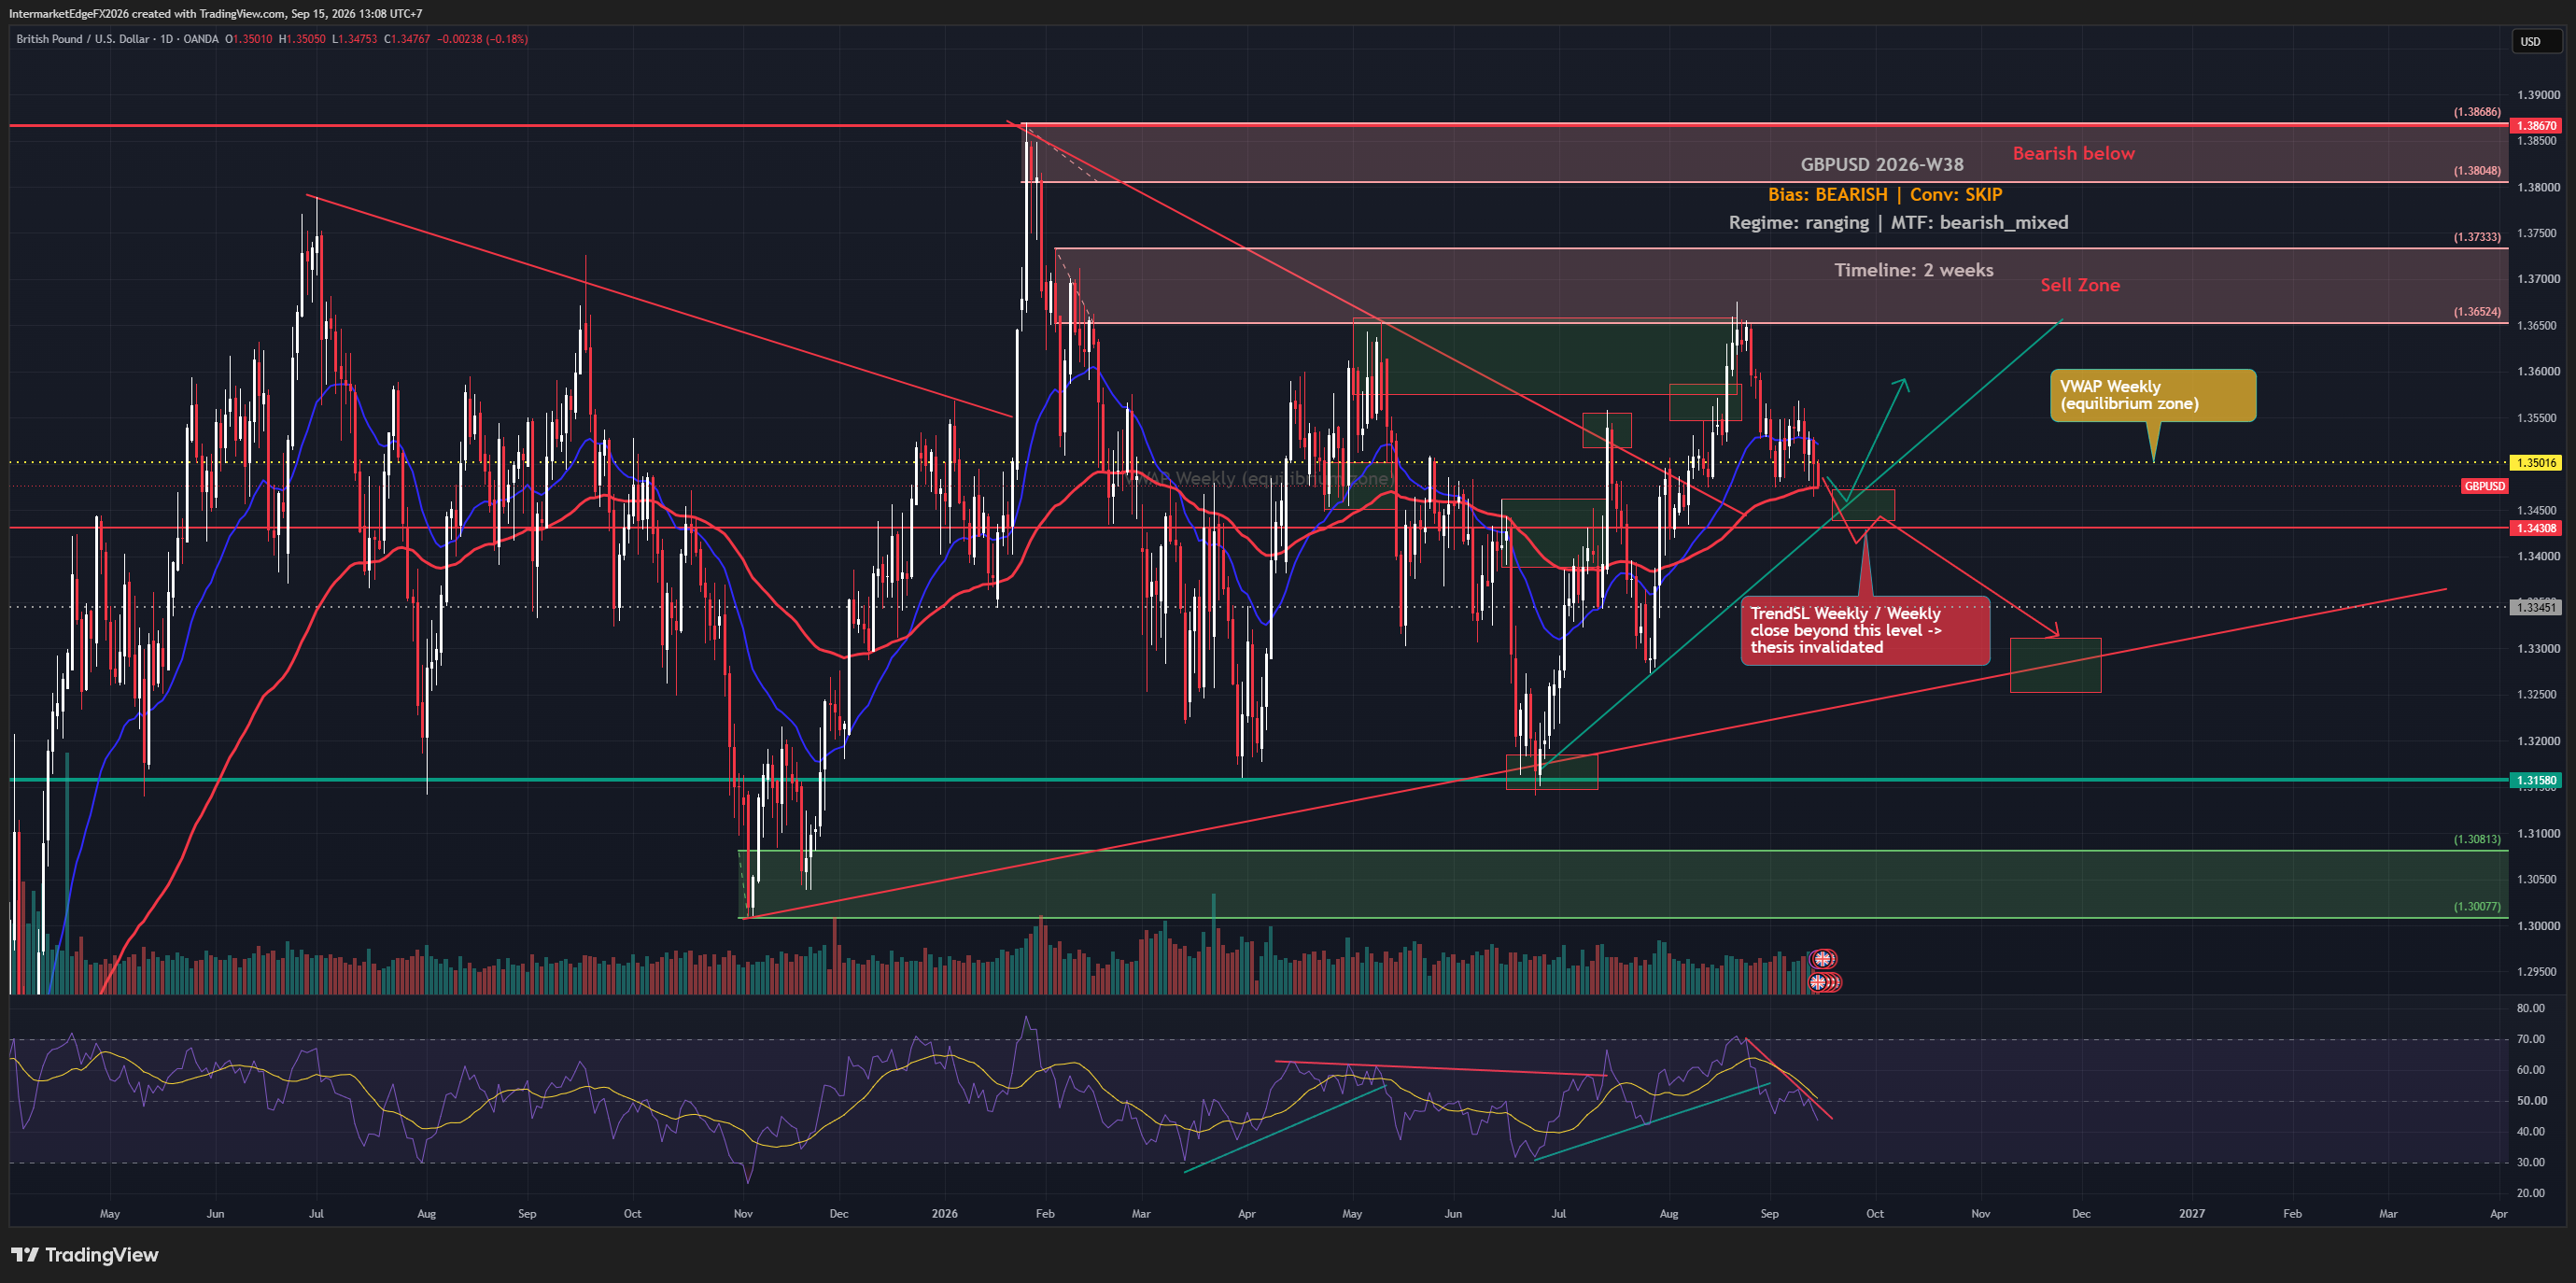
The US 10-year yield is pressing toward 5%, a level not seen since 2007, and that alone is enough to keep a bearish lean on GBPUSD for this week. But with the Federal Reserve decision due September 16 and the Bank of England following on September 17, the rate-differential story is incomplete. GBPUSD touched 1.3474 before recovering, and how it responds to those two decisions will matter far more than where it sits right now. The directional lean for GBPUSD this week is bearish, but the conviction behind that lean is deliberately thin, thin enough that staying out of a new position is the more defensible choice until the evidence consolidates. The entire bearish argument rests on one causal chain: a hawkish Fed stance pushes real yields higher, which widens the rate differential, the return gap between dollar and sterling assets, in the dollar's favor, making GBPUSD a structurally weaker pair. That chain is real and it is the clearest force in the setup. What is missing is any confirmation from price behavior or institutional positioning. COT data, which tracks how large speculative traders are aligned, contributes no directional score this week, meaning there is no evidence that professional money has built a meaningful short sterling position to amplify the macro thesis. Retail positioning at 54% long and 46% short, per broker sample data from fxssi on September 15, is effectively balanced and offers no contrarian signal in either direction. The TGA fell roughly 12% over four weeks to $843.7 billion as of September 9. A Treasury cash drawdown generally returns cash to the banking system, which can ease dollar funding conditions and work against the bullish dollar narrative at the margin. None of these cross-currents produce a clean picture. -- Intermarket Edge (Note: COT (Commitment of Traders) data is released weekly by the CFTC with a reporting-period lag -- it is not a real-time position feed. See cftc.gov for the exact release schedule.)

DXY Week W38-2026: Inflation Data Pushes Fed Hike Bets Higher, But the Dollar Sits Trapped Between Two Levels

DXY Week W38-2026: Inflation Data Pushes Fed Hike Bets Higher, But the Dollar Sits Trapped Between Two Levels

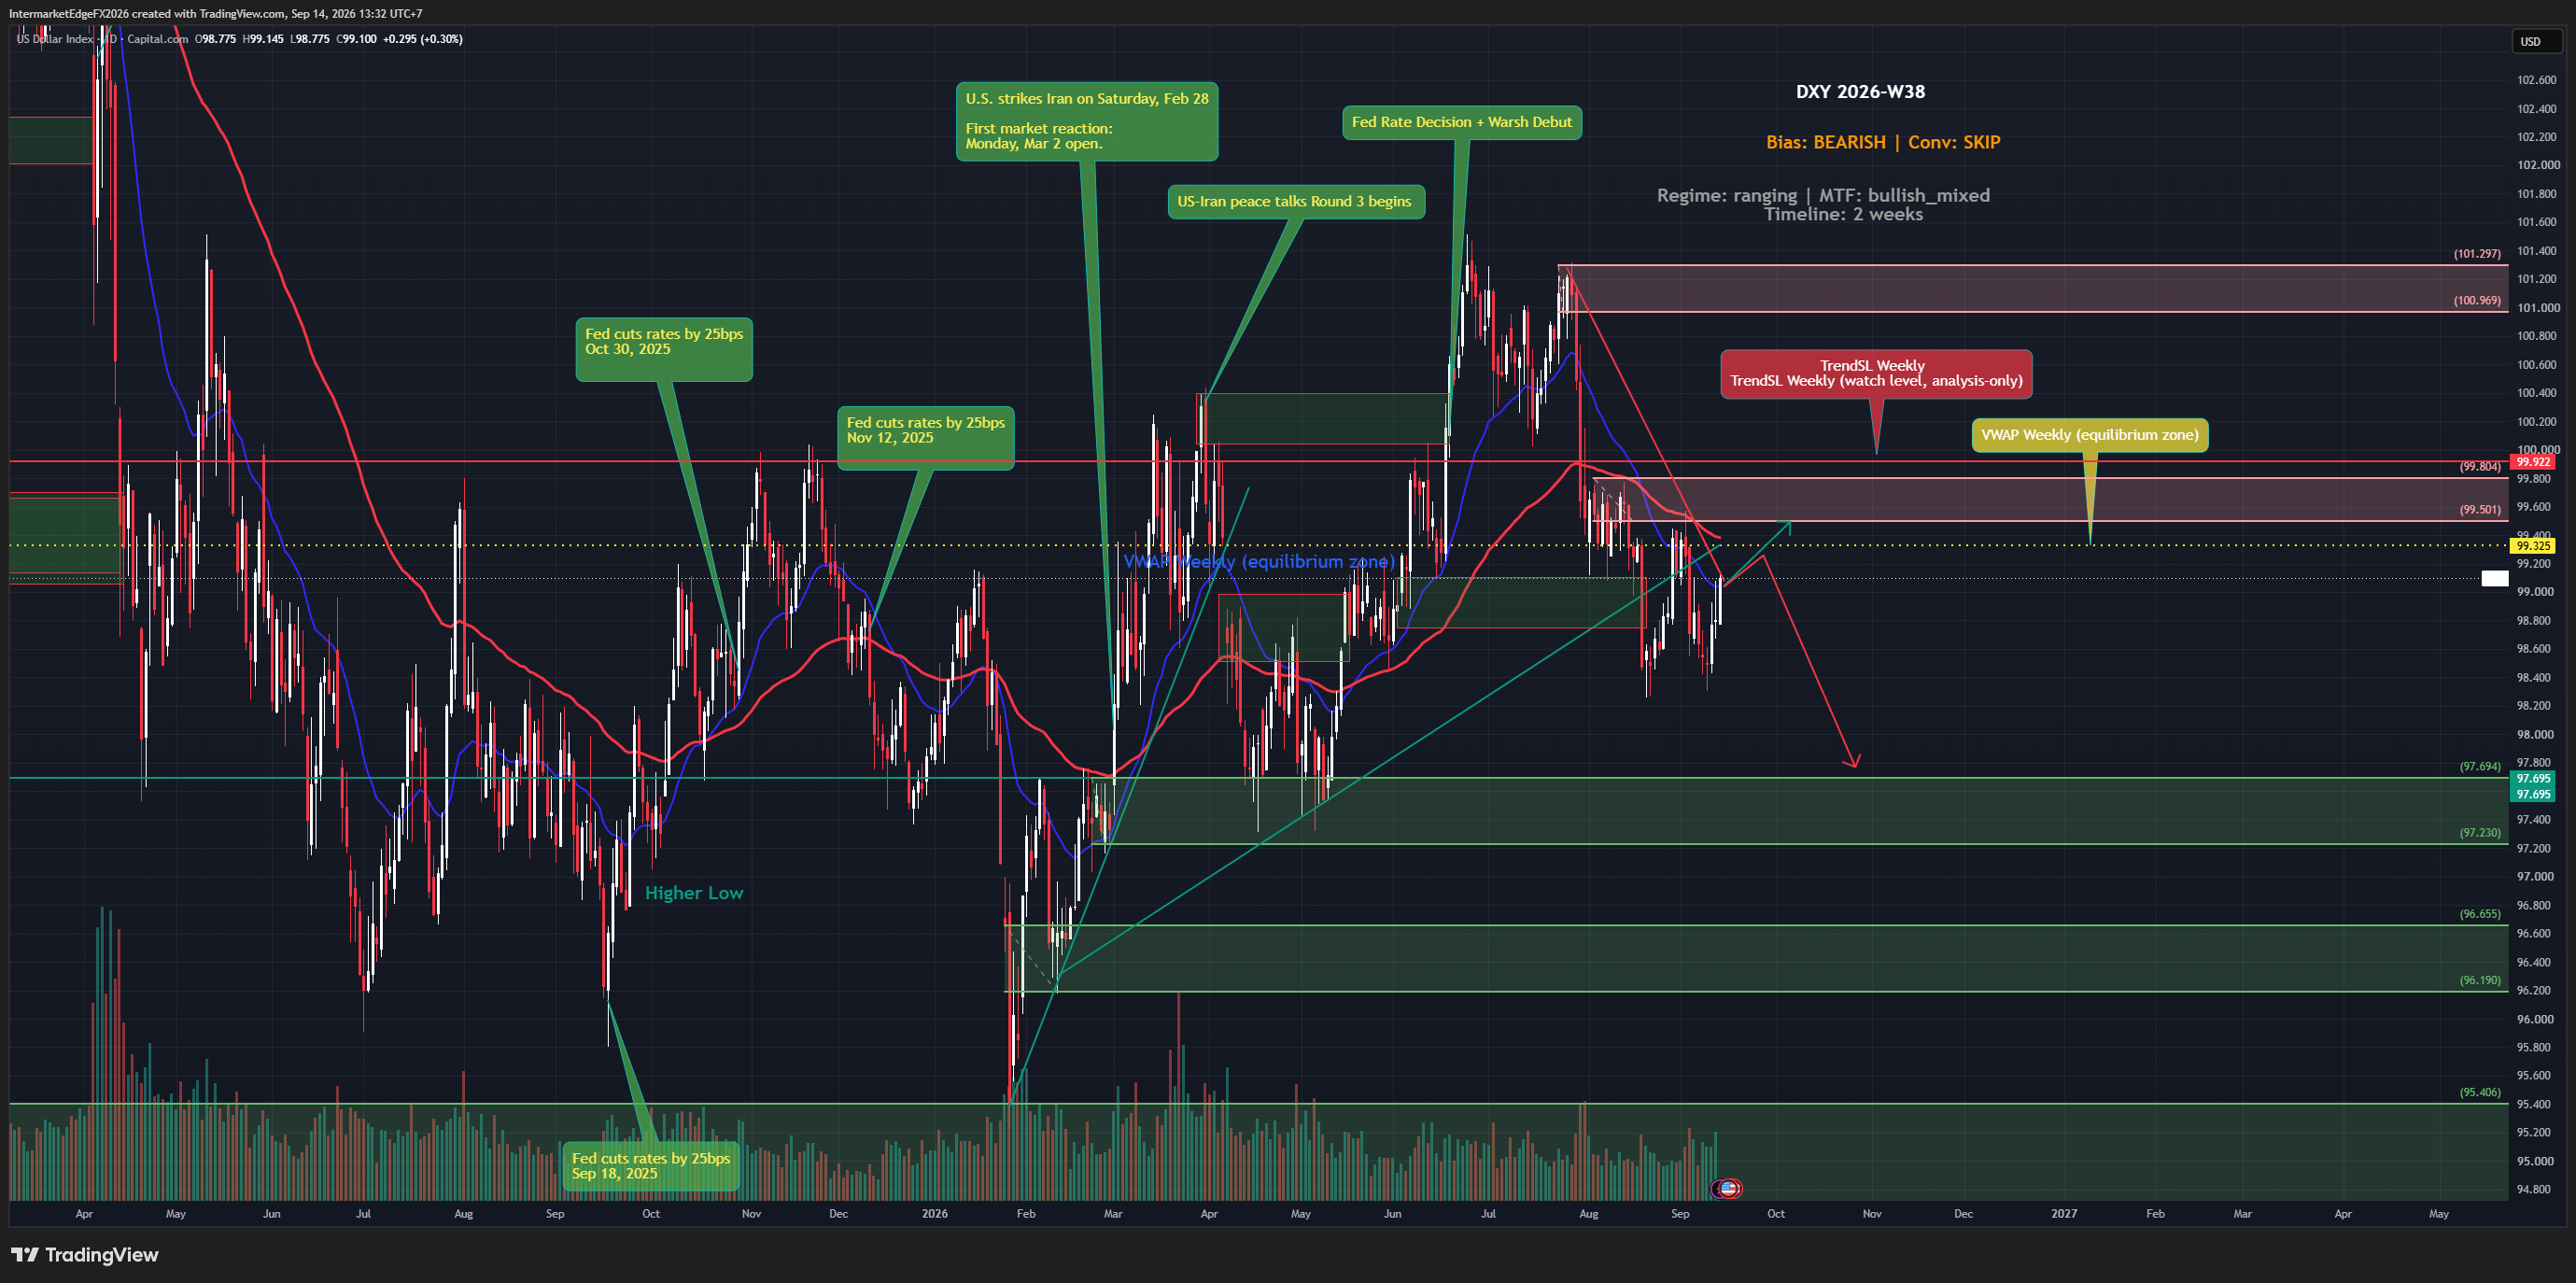
DXY is trading at 99.389 as of Monday, 14 September 2026 at 06:07 UTC. Price is above weekly VWAP at 99.325 and below weekly TrendSL at 99.922. Short-term momentum therefore runs against the bearish thesis, while the higher-time-frame bearish structure has not been invalidated. The macro picture is mixed ahead of the September 15-16 FOMC meeting. Inflation and a 2.55% US 10-year real yield support the dollar, but consumer sentiment at 47.8, rising inflation expectations and higher oil-shipping costs create a stagflationary policy problem. The US liquidity proxy increased by about $96.7 billion over four weeks, adding a modest structural headwind for USD. COT positioning points to stretched speculative dollar longs, although the brief lacks the exact report week and net-position figure. FXSSI retail positioning is balanced, with a derived DXY component reading near 53.5% long and 46.5% short. VIX and CNN Fear & Greed provide equity risk context rather than an FX signal. The weekly decision is to stand aside. A weekly close above TrendSL at 99.922 would invalidate the bearish framework. Price is already above VWAP, so sellers do not have short-term momentum confirmation. A sustained loss of VWAP support after FOMC would strengthen the bearish case. -- Intermarket Edge

Stay in the loop

Get notified about new research, macro insights, and market analysis.

InterMarketEdge

© 2026 InterMarketEdge. Financial intelligence for inter-market traders.