Tag: XAUUSD — InterMarketEdge

Tag: XAUUSD

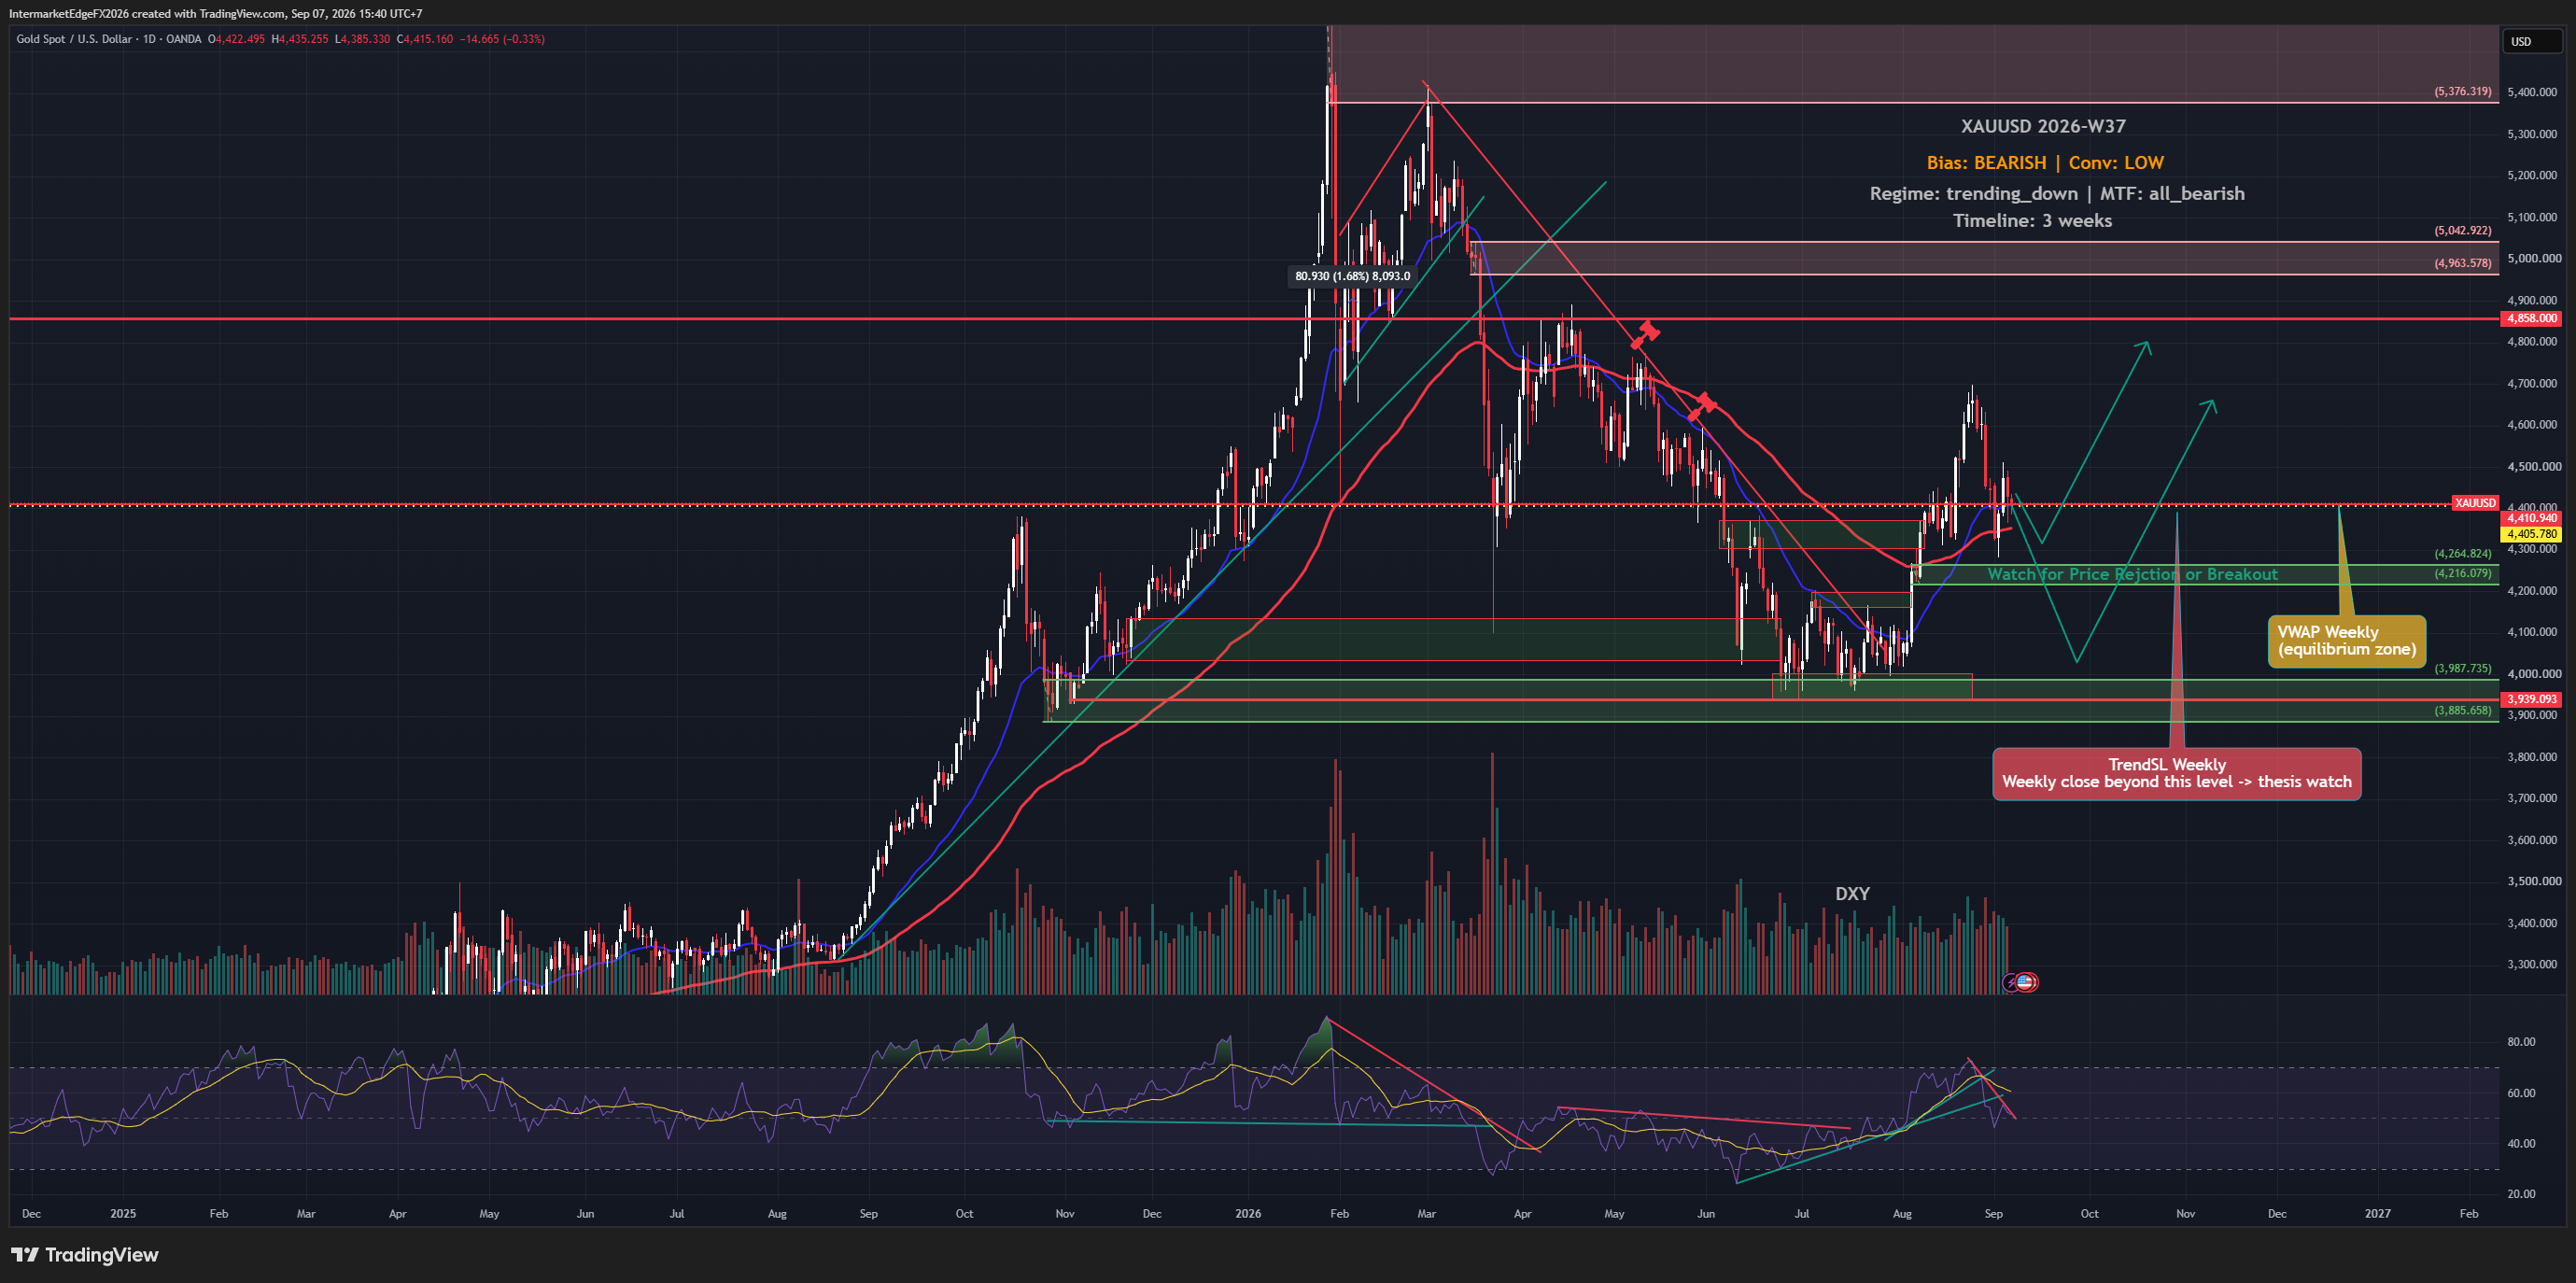
XAUUSD Weekly Outlook: Hawkish Shock, Unconfirmed Bull Case

XAUUSD Weekly Outlook: Hawkish Shock, Unconfirmed Bull Case

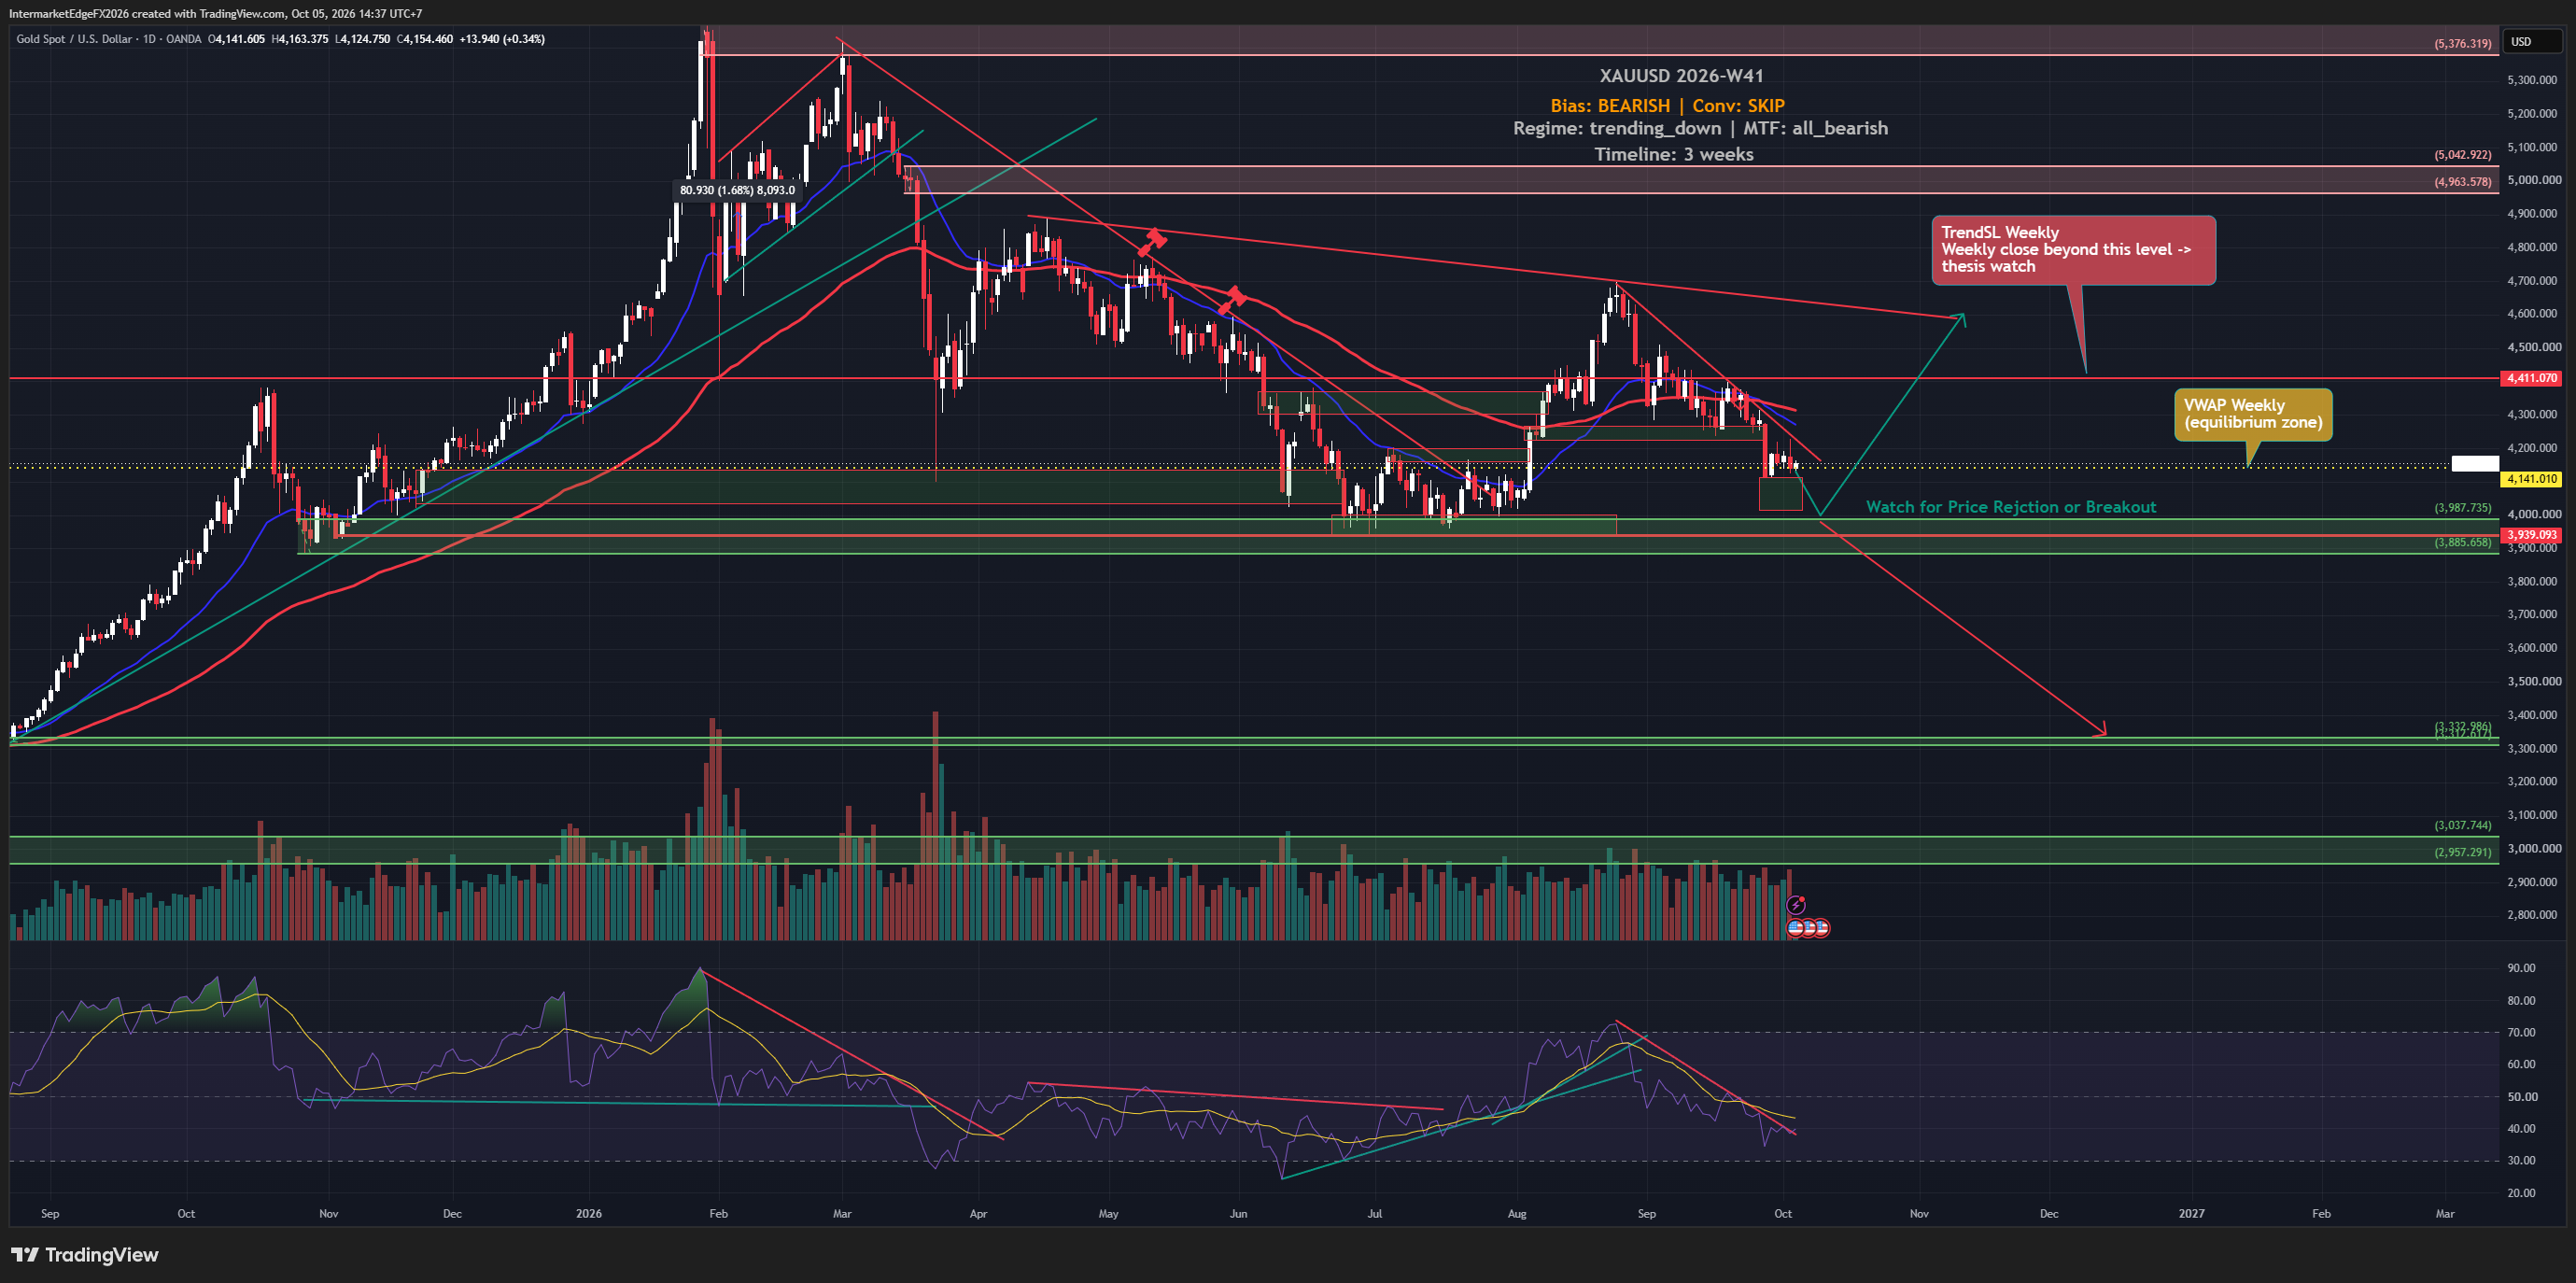
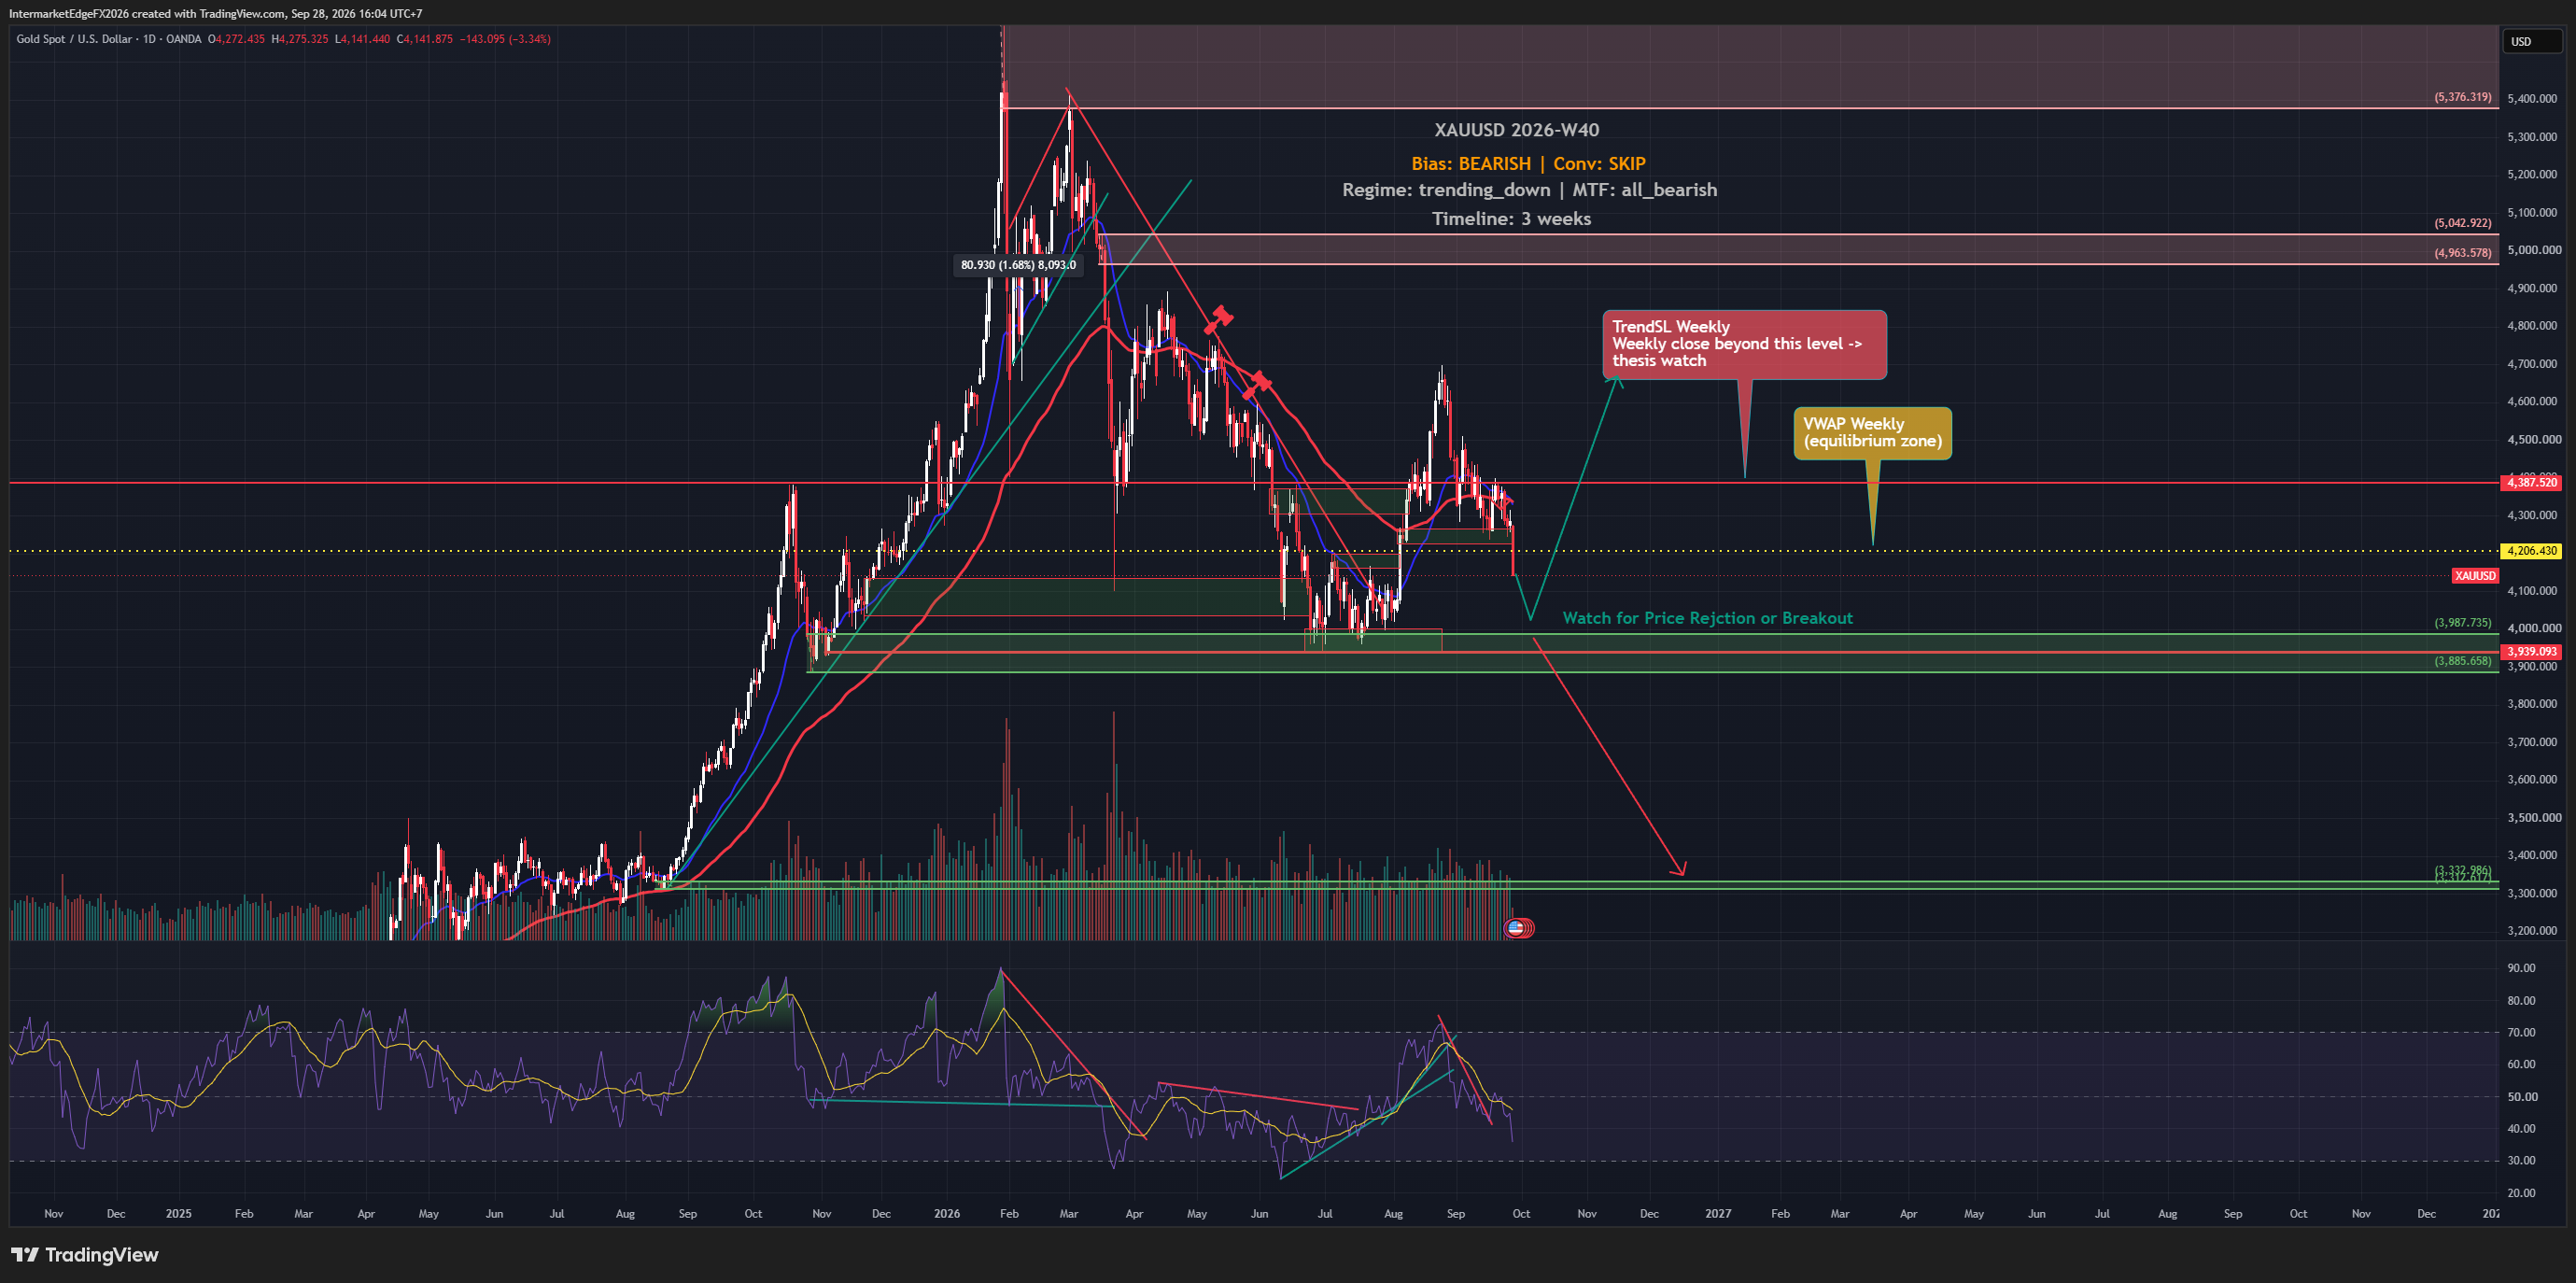
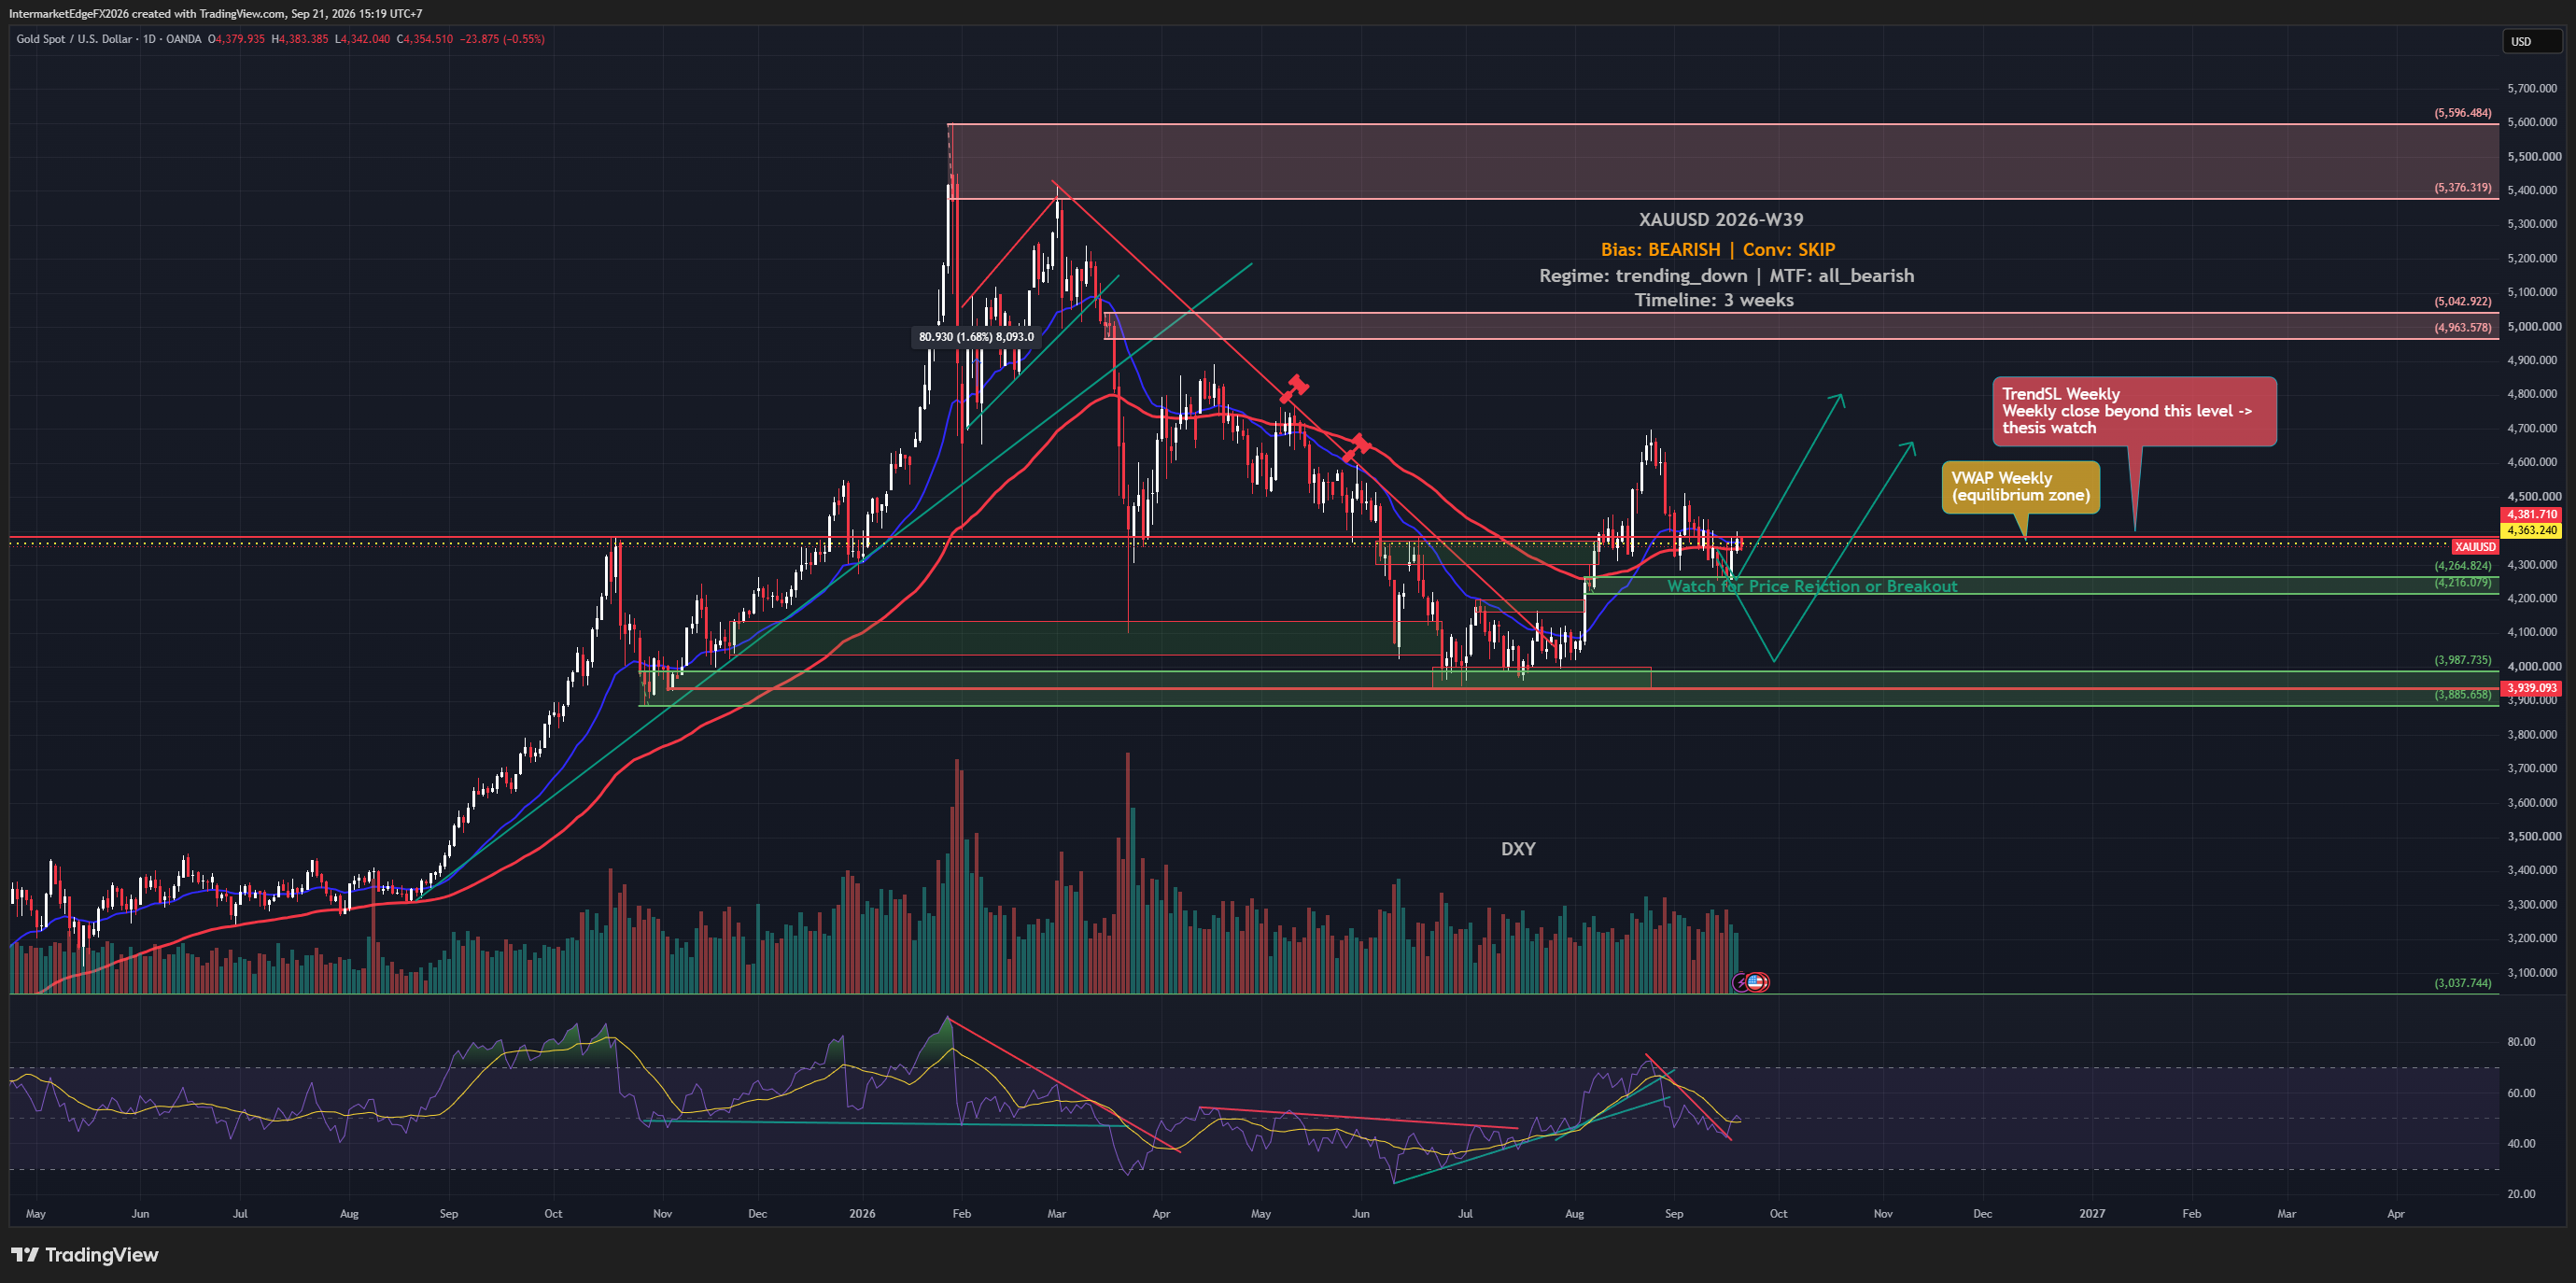
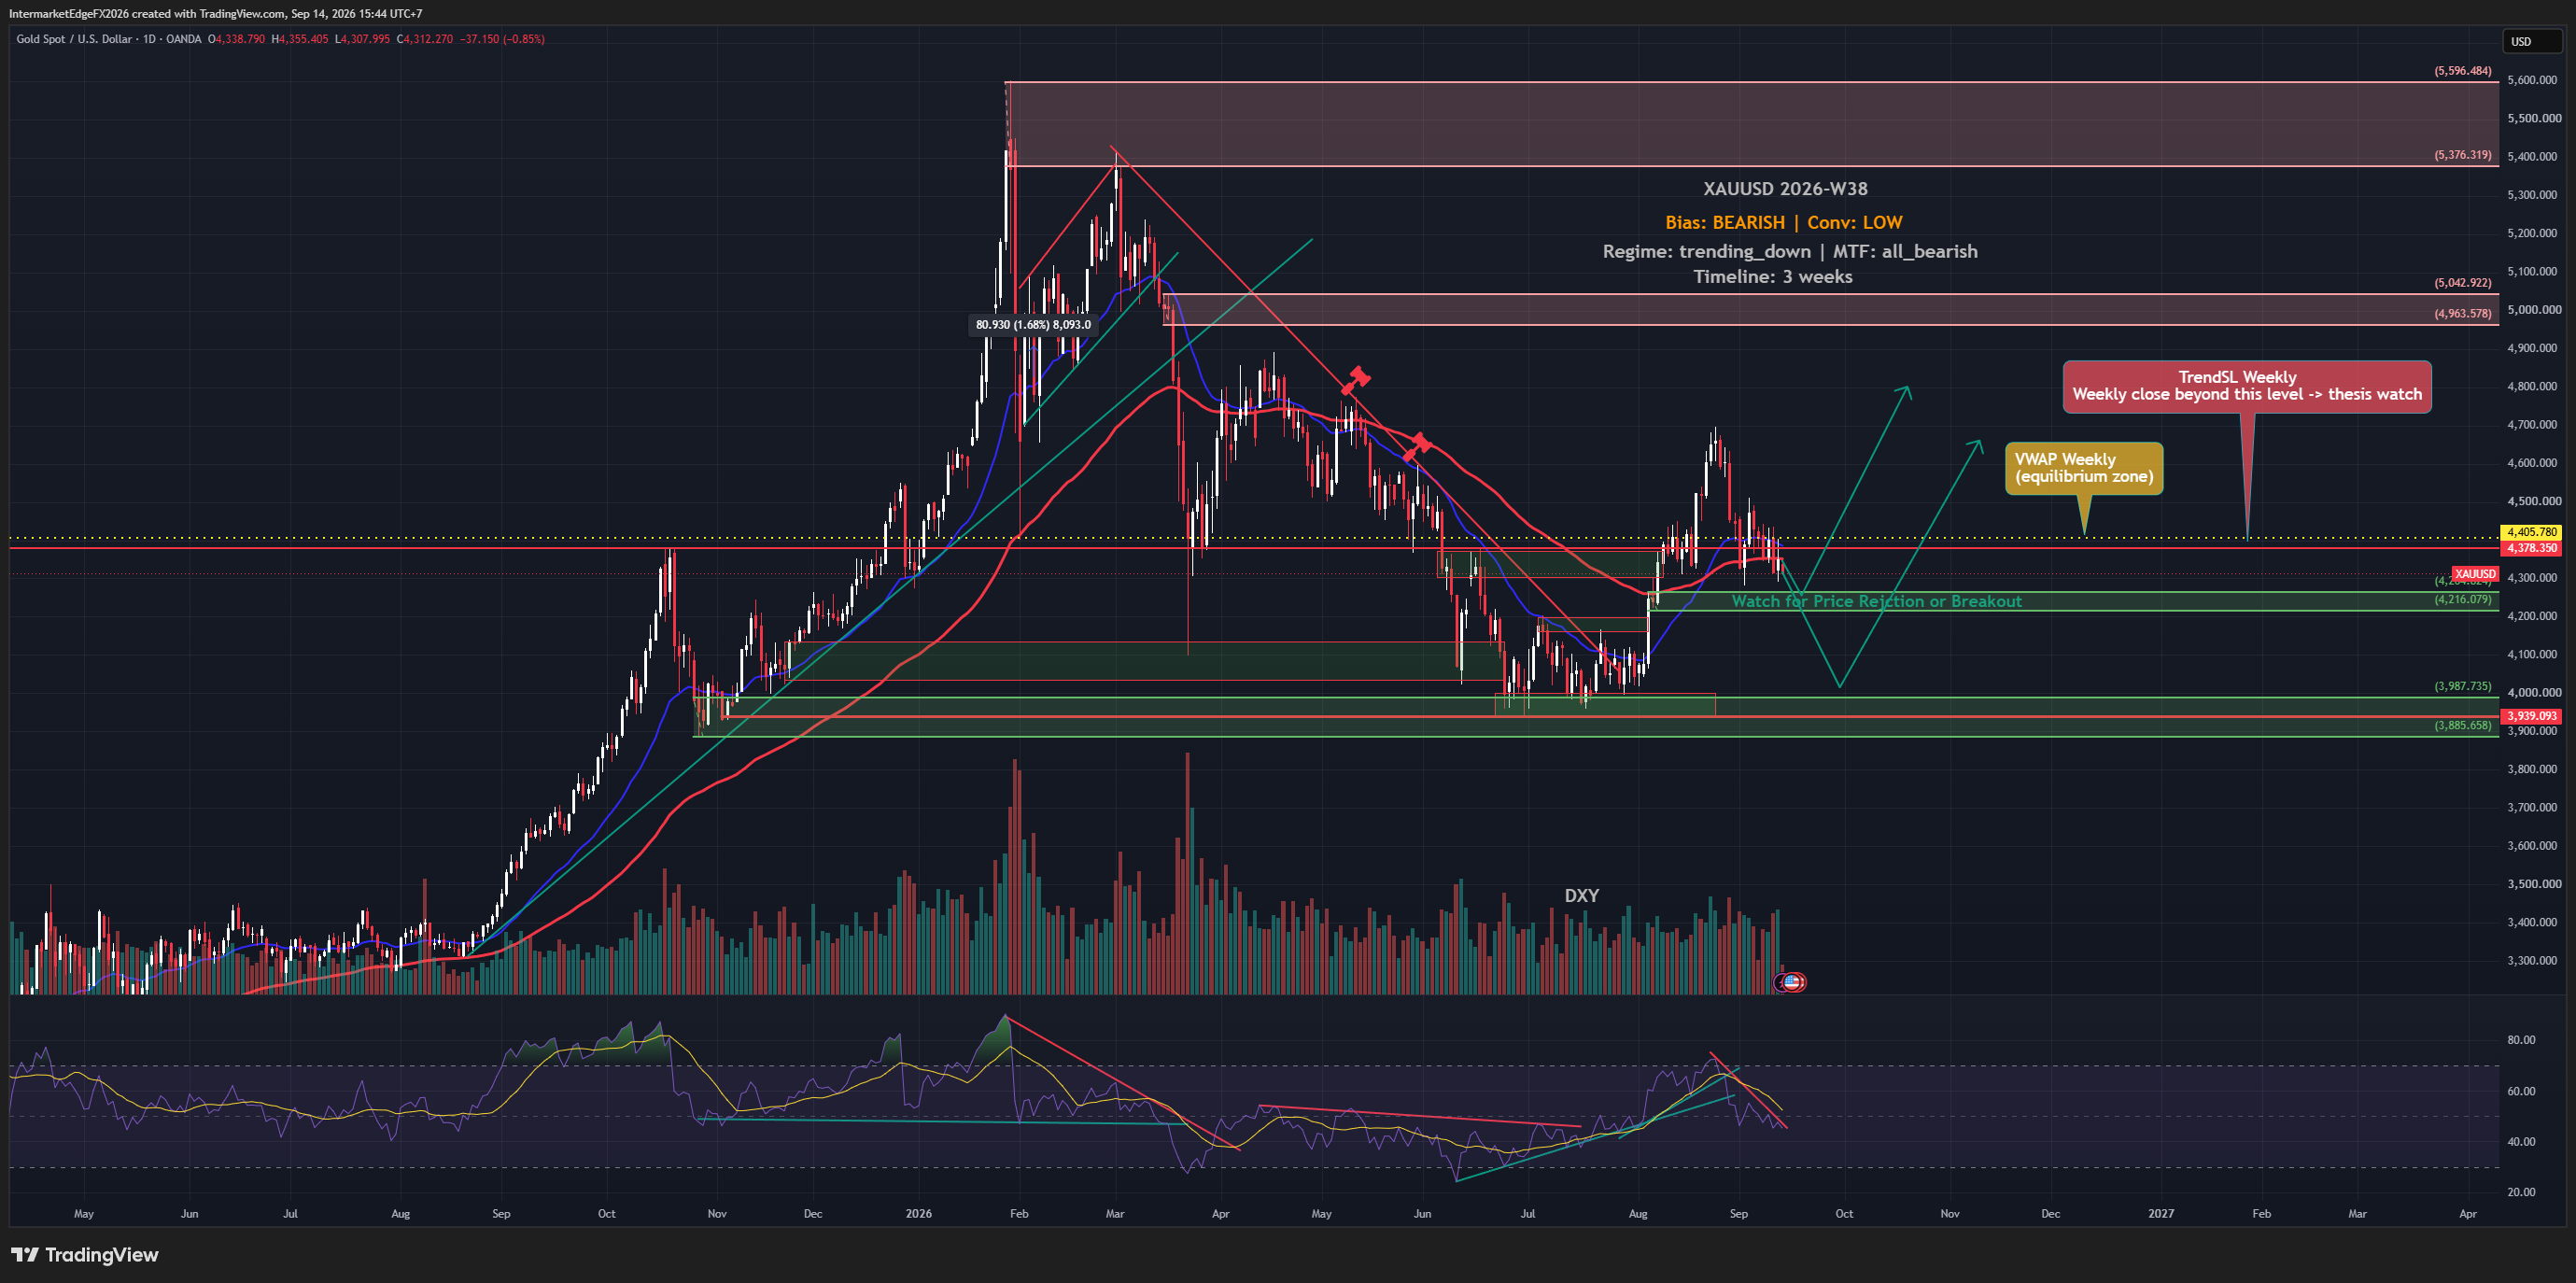
Gold fell more than 3% in a single session after Fed Chair Kevin Warsh signaled further rate hikes if inflation does not clearly return toward 2%, lifting September hike probability from roughly 36% to around 62%. Yet despite that sharp Friday selloff, spot gold near 4,448 dollars remained on course for its strongest monthly gain since January. That contradiction, brutal single-session damage inside a bullish monthly trend, is exactly the kind of setup where traders read the direction right and still get hurt. The framework labels XAUUSD bullish for the two-week window, but deliberately attaches a stand-aside posture to that label, meaning the evidence is not convincing enough to size a position, and that is a considered analytical conclusion rather than an absence of a view. Understanding why that gap exists between the directional label and the action status is the practical takeaway. Price signals, the inputs the analysis weighs most heavily for direction, lean bullish. But the COT data through August 25 showed managed money net long 144,747 COMEX gold contracts, up 3,099 from the prior week. It is worth noting that this COT reading predates Friday's sharp selloff, so the actual positioning picture after that session is unknown and must be treated as lagged. Even before accounting for that lag, the level itself is a crowding risk: when speculative longs are already concentrated at an extreme, the question becomes who is left to push price higher, and the answer often determines whether a bullish thesis accelerates or reverses violently on any negative catalyst. That COT reading conflicts directly with the bullish price signals, and the framework flags this openly rather than resolving the conflict artificially. -- Intermarket Edge (Note: COT (Commitment of Traders) data is released weekly by the CFTC with a reporting-period lag -- it is not a real-time position feed. See cftc.gov for the exact release schedule.)

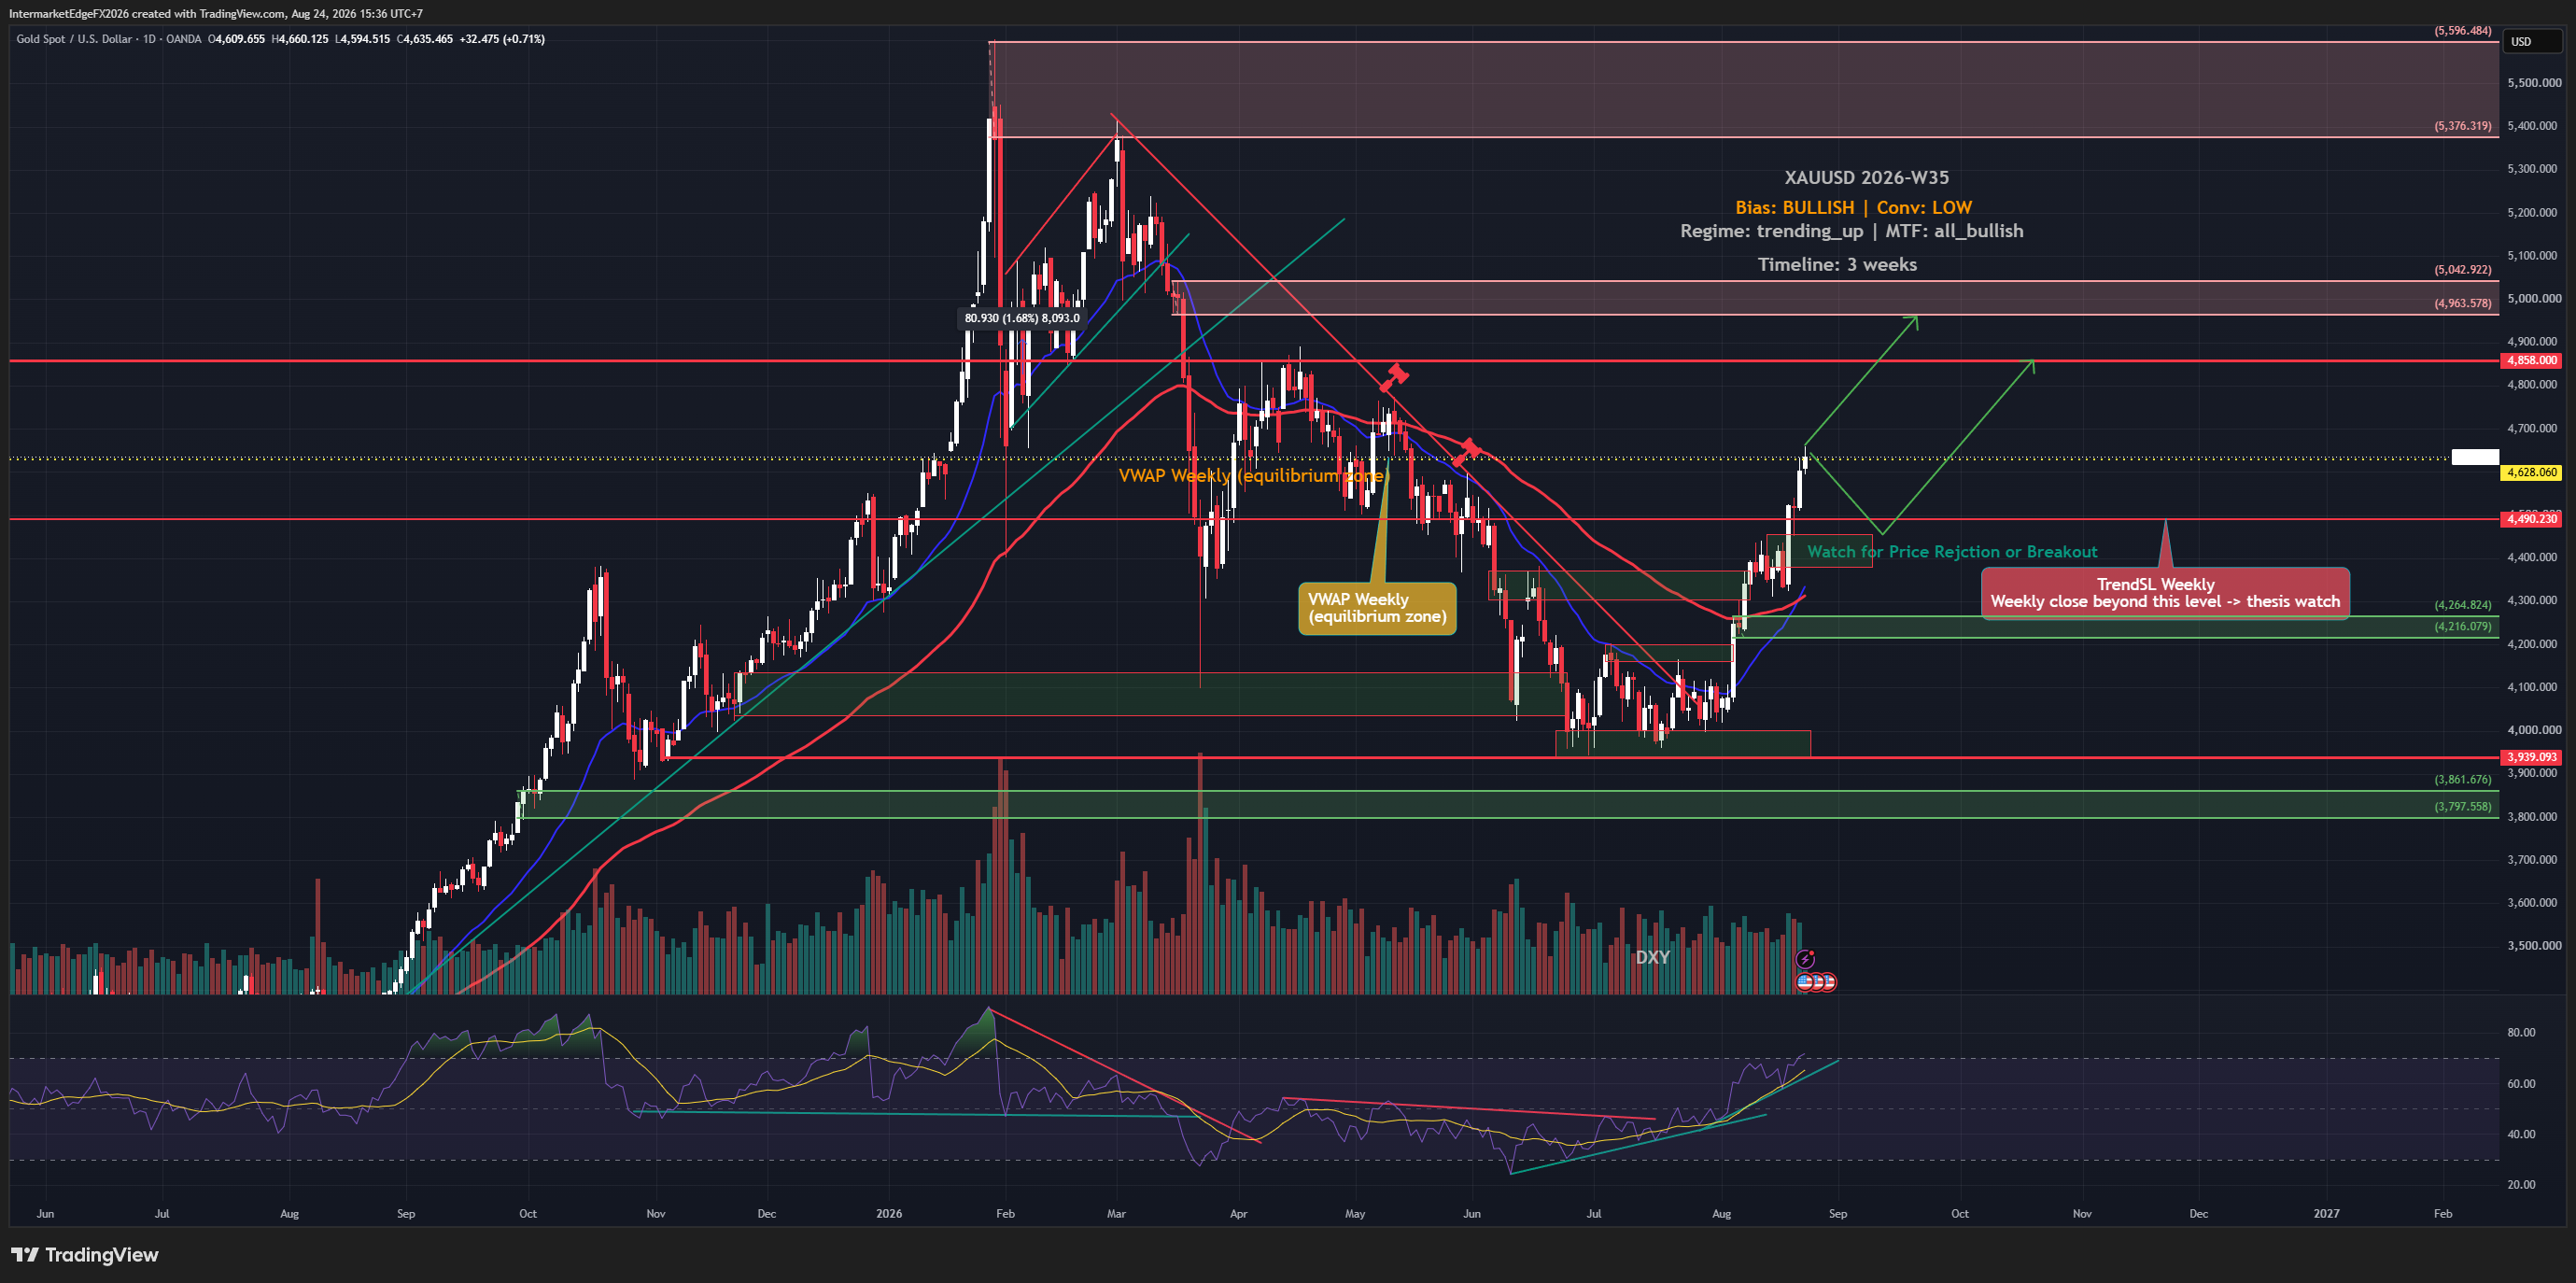
XAUUSD Week W35-2026: Gold Hits a Three-Month High as Fiscal Fears Collide With a Real Yield Warning

XAUUSD Week W35-2026: Gold Hits a Three-Month High as Fiscal Fears Collide With a Real Yield Warning

Gold traded at 4641.1 on Monday, 24 August 2026, reaching levels not seen in over three months ahead of a week packed with US inflation and labor data. The move is real, daily, weekly, and monthly structure all point the same direction. But the macro headwind is equally real: a US 10-year real yield of 2.35% is the kind of opportunity cost that historically slows gold rallies. Knowing which force wins this week is the actual question. The bullish bias on gold this week rests on two pillars: price structure and derivatives-market positioning, specifically the COT signal. Every major timeframe, daily, weekly, monthly, has its trend stop-loss pointing in the same direction, which is the highest form of technical agreement the framework registers. That kind of multi-timeframe alignment (MTF all_bullish) means trend-following systems and discretionary traders anchored to weekly and monthly structure are pulling in the same direction, reducing the probability of sharp mean-reversion moves against the trend. The COT signal adds a second, independent layer. When the positioning pattern currently active has fired historically, over 41 observed weeks, the bullish outcome was correct roughly 70.7% of the time, with average conviction rising substantially across those instances. That figure should be read as a directional probability, not a guarantee; the sample size is moderate and the methodology details are not fully disclosed in what is available here, so treat it as supporting evidence, not standalone proof. What keeps conviction at the low end despite these positives is the absence of any sentiment or liquidity confirmation. The bullish case is built entirely on price structure and COT; neither sentiment flow nor liquidity conditions are contributing. -- Intermarket Edge

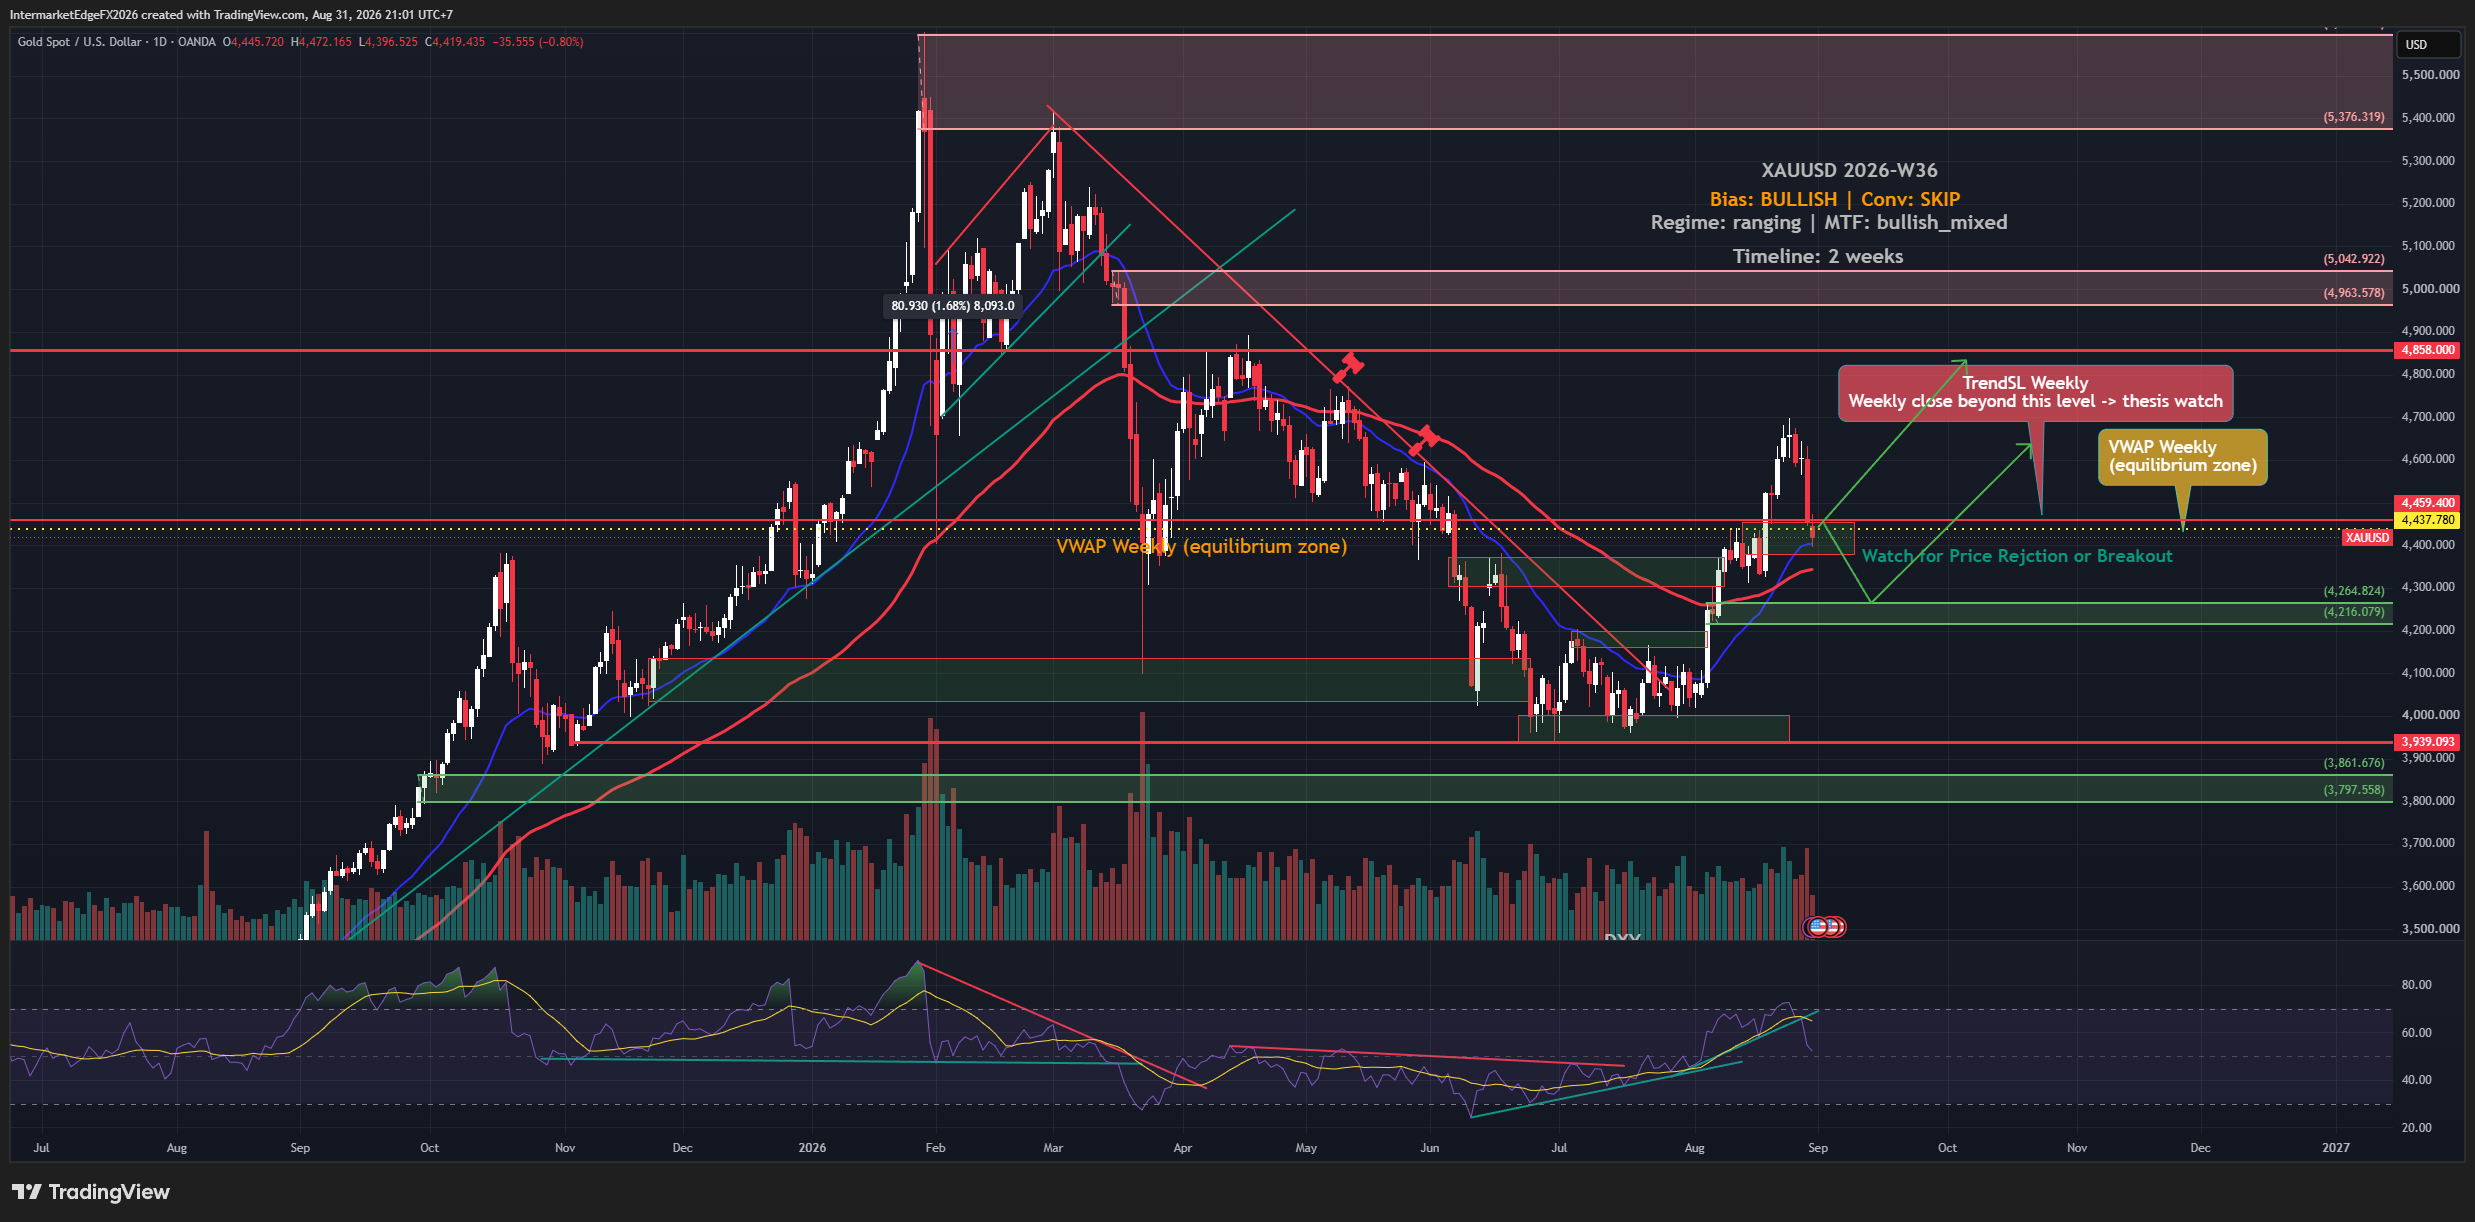
XAUUSD Week W34-2026: Fed-Hike Bets Collapse and Gold Climbs, But the Structural Ceiling at 4438 Remains Unbroken

XAUUSD Week W34-2026: Fed-Hike Bets Collapse and Gold Climbs, But the Structural Ceiling at 4438 Remains Unbroken

Gold is climbing toward $4,400 as Fed rate-hike bets collapse and the dollar softens, yet the bullish structure is not yet confirmed. Price on Monday, 17 August 2026 sits at 4394.5, marginally above the weekly VWAP but still well below the key trend structure level at 4438.43. The driver that was supposed to cap gold, Fed hawkishness, has been largely invalidated by the market itself, flipping the conventional bearish narrative on its head. The framework's bias for XAUUSD this week is bullish, but that label requires immediate qualification: conviction is low, and the structural picture at the time of thesis generation actually argues against the bullish call rather than supporting it. The reference close price of 4397.83 was already sitting below the weekly trend structure level at 4438.43 when the thesis was set, which means the bullish label is a directional lean, driven primarily by price action and COT positioning, not a technically confirmed trend. That distinction matters because it changes how much weight any given piece of confirming evidence should carry. The two active pillars supporting the bullish case are price behavior and COT positioning. On the COT side, commercial and speculative positioning in Comex gold futures and options as of the August 14 report leans bullish, but the specific net-position figure and the precise breakdown between commercial hedgers and large speculators are not available here, so this should be read as directional evidence, not a citable standalone number. On price, the multi-timeframe alignment is described as bullish-mixed: some shorter timeframes confirm the directional lean, others do not. Cutting across both pillars is a live Fed-hawkish causal chain that argues the opposite direction, rising real yields reducing gold's appeal, and these forces are partially offsetting each other right now. -- Intermarket Edge (Note: COT (Commitment of Traders) data is released weekly by the CFTC with a reporting-period lag -- it is no

XAUUSD Week W33-2026: Gold Crosses the Line, but Confirmation Must Wait

XAUUSD Week W33-2026: Gold Crosses the Line, but Confirmation Must Wait

Gold printed a flat zero on the July Core CPI reading, the kind of number that should send an inflation hedge sharply higher. Instead, XAUUSD is hovering within a handful of dollars of a technical level that the bullish case still needs to close above on a weekly basis. The contradiction between a cooling inflation print and a 2.4% real yield that keeps the Fed's pressure alive is exactly the tension defining this week's tape. The overall lean for gold this week is bullish, but the honest framing is that this is a low-conviction technical bias rather than a macro-supported directional call. Price action and COT positioning, where large speculator positioning is tilted bullish, though the specific report date, net-position figure, and sample period are not disclosed in the underlying data, so treat this as directional evidence rather than a citable statistic, are carrying most of the analytical weight. The macro contribution is marginal, and both liquidity and sentiment indicators are quiet, offering no additional confirmation in either direction. The hawkish Fed causal chain is the key headwind worth understanding precisely: higher real yields reduce gold's relative appeal because bonds now compete meaningfully for capital, creating persistent downward pressure on prices. That chain has been deliberately downweighted in the framework after backtesting showed it produced correct directional calls only roughly 35.9% of the time when applied to XAUUSD specifically, a figure that comes without disclosed sample size or test period, so treat it as a caution flag rather than a hard statistical rule. The practical takeaway is that price and positioning should lead the analysis, not macro narratives alone. What makes this week's setup particularly difficult is that the CPI miss does not resolve the conflict, it creates a new one. -- Intermarket Edge

XAUUSD Week W32-2026: Gold Snaps Four-Month Losing Streak but Stalls Below VWAP 4120.87 as US-Iran Talks and a Core CPI Miss Send Conflicting Signals

XAUUSD Week W32-2026: Gold Snaps Four-Month Losing Streak but Stalls Below VWAP 4120.87 as US-Iran Talks and a Core CPI Miss Send Conflicting Signals

Gold just snapped a four-month losing streak, but the recovery is already showing cracks. As of Monday, 03 August 2026 at 05:50 UTC, XAUUSD on the GC=F futures contract used as proxy is trading at 4114.9, sitting below the weekly VWAP of 4120.87 and testing from underneath. The bullish label is technically alive, but the setup carries the lowest possible conviction rating this week, and the fundamental backdrop is genuinely conflicted. The formal bias for XAUUSD in Week W32-2026 is technically bullish, but traders need to understand exactly how weak that label is before acting on it. The bullish signal is being carried almost entirely by price action, no COT positioning signal, no liquidity signal, and no sentiment signal fired this week to provide corroborating evidence. The CFTC Commitments of Traders data for Comex Gold Futures and Options as of July 31 was noted in the news feed but contributed zero directional signal, which is itself meaningful: positioning is not lending support to the bullish case. It is important to note that COT data does not identify 'smart money' with precision, and the specific net-position figure, report week, and release date are not detailed in the available brief, so any inference from it should be treated cautiously. The macro contribution to the bullish score is minimal, and the active causal chains are openly conflicting: a hawkish Fed impulse driven by elevated real yields points in the bearish direction, while separate BOJ-hawkish and inflation-related signals send mixed cross-currents. The net result is that the fundamental backdrop is genuinely ambiguous, not simply unclear, the forces are offsetting rather than aligned. The ranging regime designation, assessed at 70% confidence, reinforces a mean-reversion FX implication, suggesting that sharp directional moves in either direction are statistically unlikely to sustain over the two-week horizon. -- Intermarket Edge

XAUUSD Week W31-2026: Ceasefire Pause Lifts Gold Toward VWAP at 4098.87, But All-Bearish Structure Keeps Shorts Alive

XAUUSD Week W31-2026: Ceasefire Pause Lifts Gold Toward VWAP at 4098.87, But All-Bearish Structure Keeps Shorts Alive

As of 27 Jul 2026 (08:57 UTC, yfinance GC=F), gold trades at 4098.1 — fractionally below the weekly VWAP of 4098.87, testing it from underneath. That level is a live thesis-break warning: a sustained close above VWAP would signal short-term momentum running against the bearish structural read. The week's dominant driver has been geopolitical, not macro. Gold gained over 1% on a pause in US-Iran fighting, reversing an earlier dip below $4,100 that had been triggered by Fed tightening prospects. Separately, Brent crude lost over 4% while gold rose, although the available data does not establish a direct capital rotation between the two markets. Comex futures are consolidating above $4,000. Signals are directly conflicting and that is the core risk. The multi-timeframe structure is all-bearish and regime confidence sits at 0.70 trending-down. But COT positioning is firmly bullish, and price action is technically constructive. These two inputs are not confirming each other. On the macro side, US 10Y real yield at 2.43% is a genuine headwind for gold — but the Fed hawkish causal chain has shown low historical reliability (~36% / 35.9% accuracy in back-testing, sample/period not specified in the brief), so it is downweighted here. BOJ hawkishness and hot CPI signals partially cancel each other out, adding noise rather than direction. Conviction is low. Size conservatively, avoid high-leverage directional bets. Key levels: bearish structure invalidates on a weekly close above 4467.85 (TrendSL); reduce shorts if price holds sustained above VWAP 4098.87. FOMC meets 28-29 July 2026 -- the near-term catalyst. -- Intermarket Edge

XAUUSD Week W29-2026: Breaks Below $4,000 as US-Iran Conflict Fuels Fed Rate-Hike Bets, Bullish Thesis Hangs by a Thread

XAUUSD Week W29-2026: Breaks Below $4,000 as US-Iran Conflict Fuels Fed Rate-Hike Bets, Bullish Thesis Hangs by a Thread

Gold closed at 3,992, slipping below the $4,000 psychological level — a technically meaningful break given price is now also under the weekly VWAP at 4,037.87. That VWAP breach is one of this framework's thesis-break conditions: price sustained below that level signals short-term momentum is running against any bullish case. The driver is counterintuitive but real: the US-Iran conflict is pushing oil sharply higher, reviving higher-for-longer inflation fears and hardening Fed rate-hike expectations. Gold, which typically benefits from geopolitical stress, is instead being sold because the war-inflation channel is hawkish, not a safe-haven trigger right now. Gold is on track for its biggest weekly loss in six weeks. This is happening despite a genuinely dovish CPI print — Core CPI MoM came in at 0.0% vs 0.2% forecast, a meaningful miss that would normally support gold via USD weakness. DXY bias is indeed bearish (low conviction), but that tailwind is being overwhelmed by the rate-hike repricing story. MTF alignment is all-bearish. Regime is trending_down (confidence 0.70), and the FX implication is trend-follow — meaning the path of least resistance is lower. COT and macro signals tilt bullish on paper, but the technical picture and recent price action are speaking louder. Overall bias is logged as bullish with low conviction — an honest reflection of conflicting signals. With price below VWAP and momentum firmly downward, this is not a long entry environment. The TrendSL at 4,522.20 is far above current price; a weekly close above that would be required to validate any bullish structural recovery — that is not a near-term scenario. Watch whether $4,000 becomes resistance on any bounce. -- Intermarket Edge

XAUUSD Week W28-2026: Softer US CPI Sparks a Bounce Off the Below-$4,000 Low, But All-Bearish MTF Structure Keeps the Trend Intact

XAUUSD Week W28-2026: Softer US CPI Sparks a Bounce Off the Below-$4,000 Low, But All-Bearish MTF Structure Keeps the Trend Intact

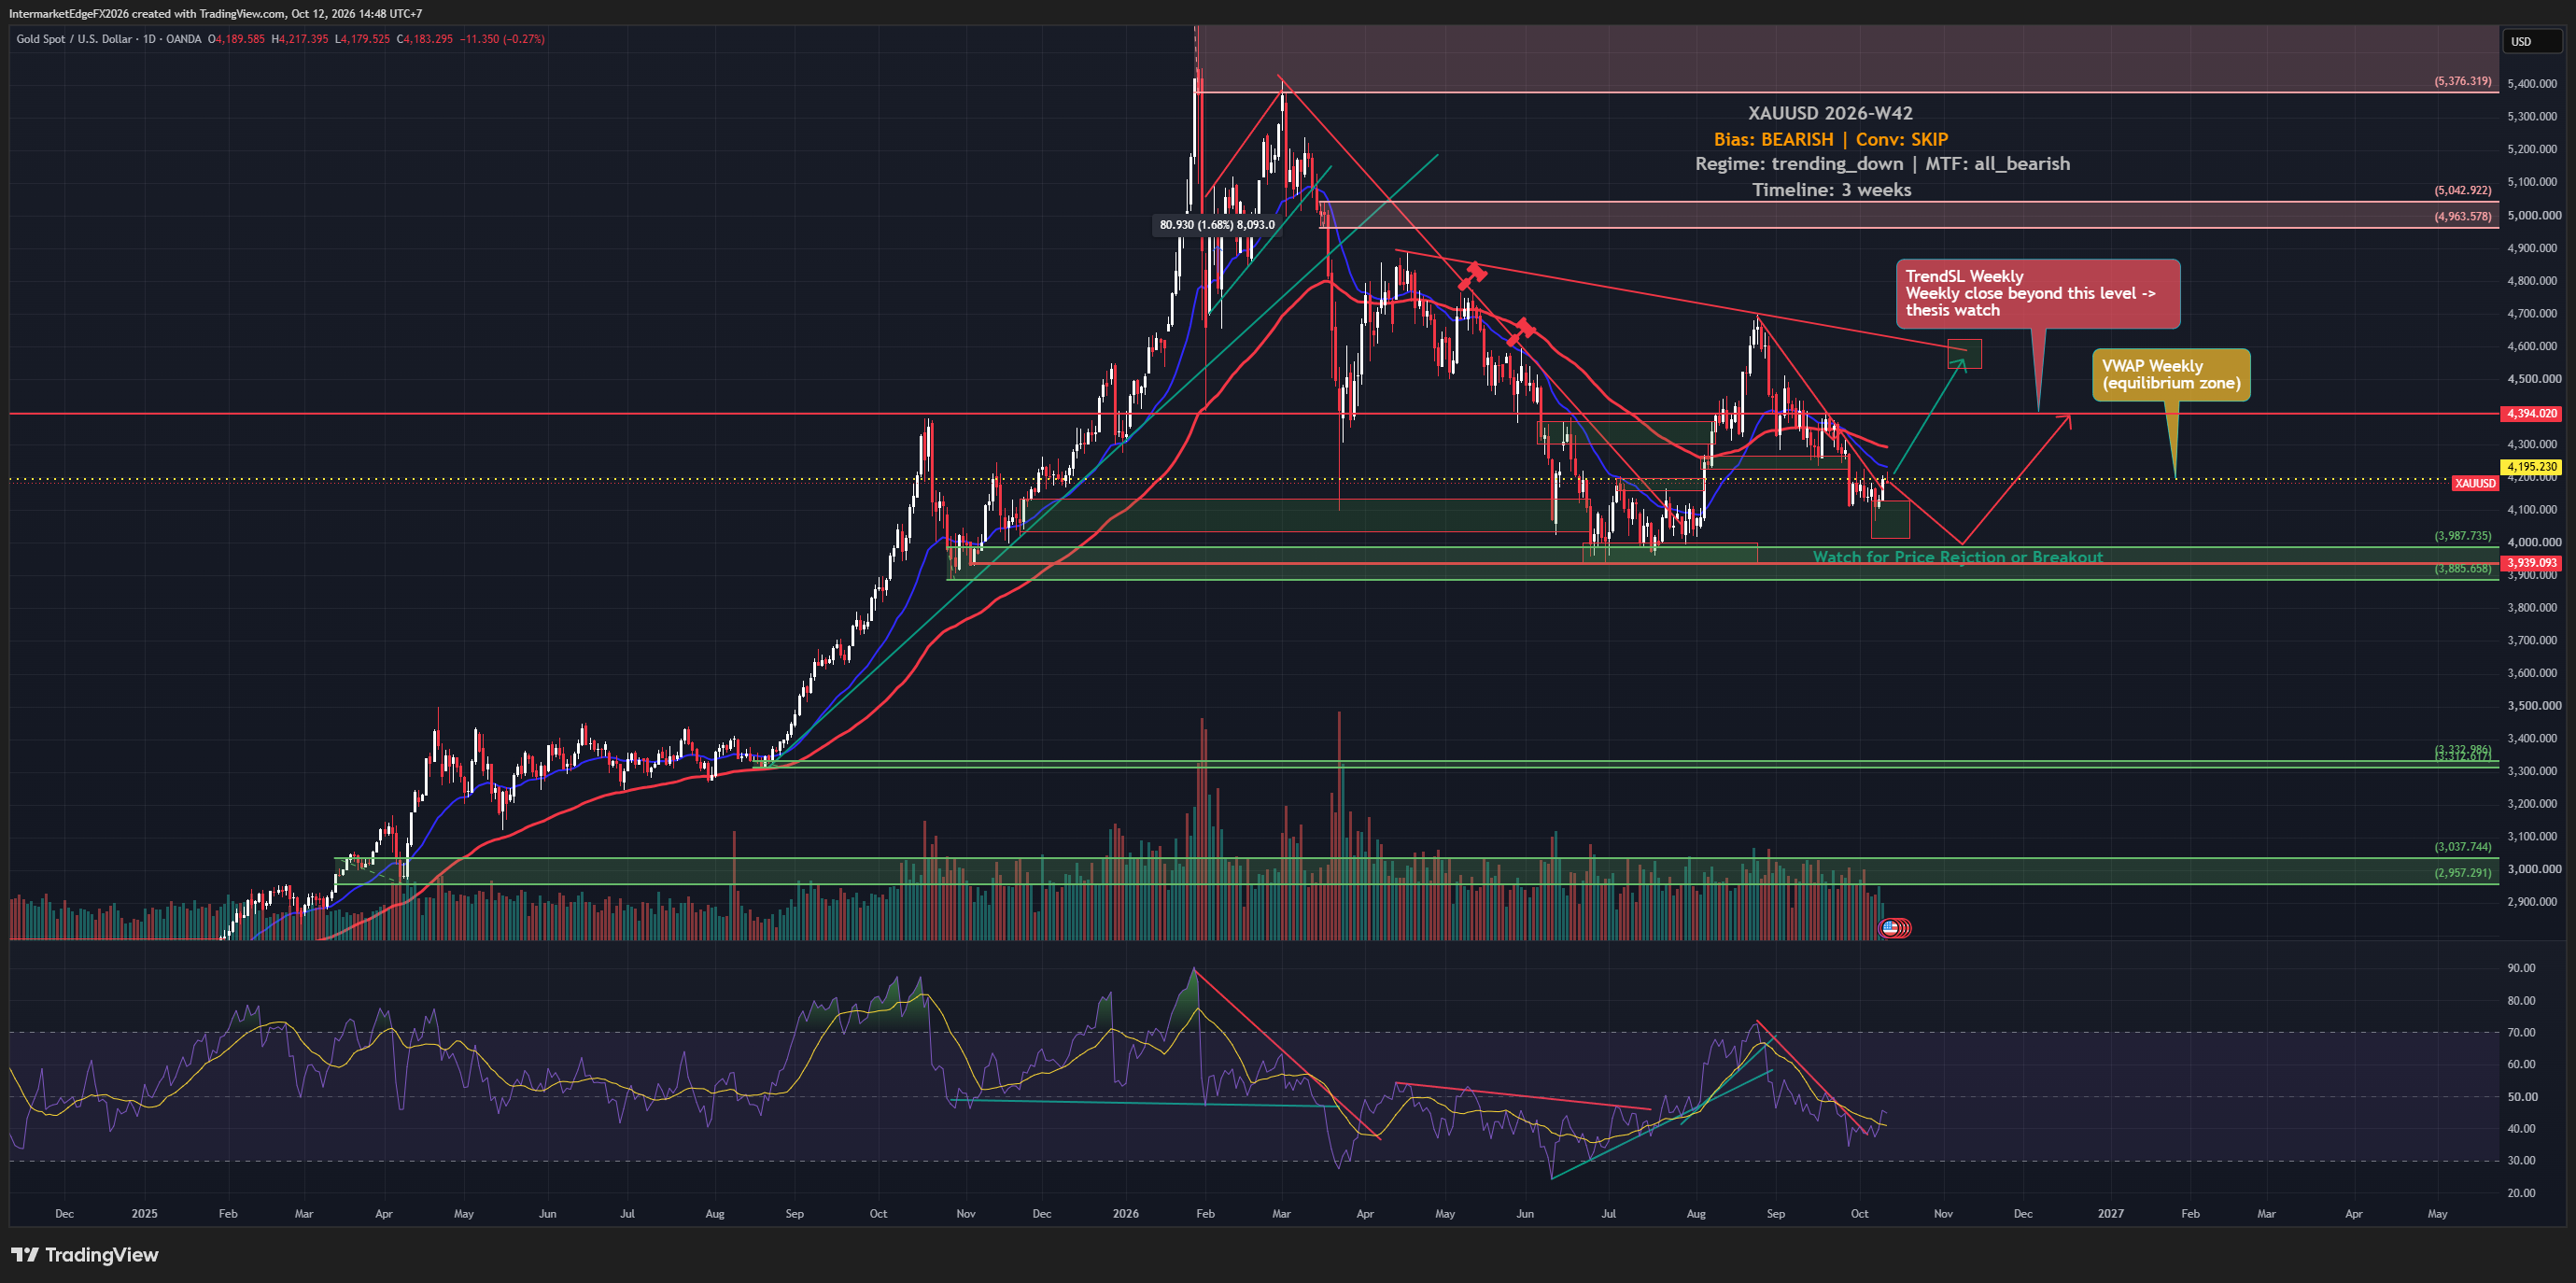
Gold slid below $4,000 to a two-week low earlier this week as an oil price surge reignited rate-hike fears, before snapping back after June CPI printed sharply below consensus. Headline CPI came in at -0.4% M/M (vs -0.1% expected) and +3.5% Y/Y (vs +3.8% expected); core was flat at 0.0% M/M (vs +0.2% expected) and +2.6% Y/Y (vs +2.9% expected). The disinflationary read briefly lifted gold sentiment, but price has only recovered to roughly the weekly VWAP at 4114 — not a momentum-shifting breakout. The broader regime remains trending down (confidence 0.70). Multi-timeframe alignment is fully bearish. Real yields at 2.32% and DXY holding a medium-conviction bullish bias at 100.81 both maintain structural headwinds for gold via the rate-differential channel (higher real rates raise the opportunity cost of holding a non-yielding asset). Conviction is rated skip this week — the CPI bounce introduces enough near-term noise that the risk/reward for fresh shorts is unclear. Price hugging the weekly VWAP at 4114 is a key watch: a sustained close above that level would signal short-term momentum turning against the bearish thesis and warrants reducing exposure. Full structural invalidation only if price reclaims the TrendSL at 4565.55. No trade signal is issued; this is analysis only. -- Intermarket Edge

XAUUSD - Wave (4) Running After the 5,100 Peak Confirmed, 4,296 Broken and Price Seeking Its Floor at 3,797-3,881

XAUUSD - Wave (4) Running After the 5,100 Peak Confirmed, 4,296 Broken and Price Seeking Its Floor at 3,797-3,881

XAUUSD - SUMMARY 29/06/2026 Regime: Wave (4) In Progress, Medium Bear. XAUUSD 4,023.995 (-1.57%), the 4,296-4,381 support zone broke this week. Following wave 3 completion at the ~5,100 peak (April 2026), gold is executing a wave (4) structural correction with four forces aligned bearish. Bias: Medium Bear, wave (4) in progress. Four bearish drivers: actual real yield +0.172% (pipeline 1.972% wrong -- uses stale CPI 2.4%; actual 4.2%), Fed Warsh hawkish hold (H2 2026 hike not excluded), DXY structurally bullish (wave (5) targeting 103-104, inverse relationship with gold active), risk-on SPX +0.68% VIX 18.7 (reduced safe-haven demand). XAGUSD -1.68% declining faster than gold confirms structural bearish trend. Data corrections: CPI 4.2% (not 2.4%); real yield +0.172% (not 1.972%); JP10Y 2.63% (not 1.47%); ECB neutral 2.00% (not cutting 2.50%). D1 structure: 4,296-4,381 broken, flipped to resistance. Wave (4) target: 3,881 (Fib 0.382) then 3,797. RSI ~34 near oversold may generate technical bounce toward 4,100-4,200 without altering structure. Extended wave (4): 3,500-3,600. Invalidation: daily close above 4,296. Hard invalidation: below 2,997. Scenarios: wave (4) continues to 3,797-3,881 (55%); bounce to 4,100-4,200 then resumes (25%); NFP miss + geopolitical spike reclaims 4,296 (15%); extended to 3,500-3,600 (5%). Do not buy the dip before NFP 3 July. Wait for reversal signals at 3,797-3,881. For informational purposes only. Not financial advice.
Stay in the loop

Get notified about new research, macro insights, and market analysis.

InterMarketEdge

© 2026 InterMarketEdge. Financial intelligence for inter-market traders.