Articles — InterMarketEdge

Articles

Financial intelligence, macro research, and inter-market analysis.

EURUSD | May 19, 2026 The Euro at 1.1621 - Holding Above 1.14 While the World Reprices the Dollar

EURUSD | May 19, 2026 The Euro at 1.1621 - Holding Above 1.14 While the World Reprices the Dollar

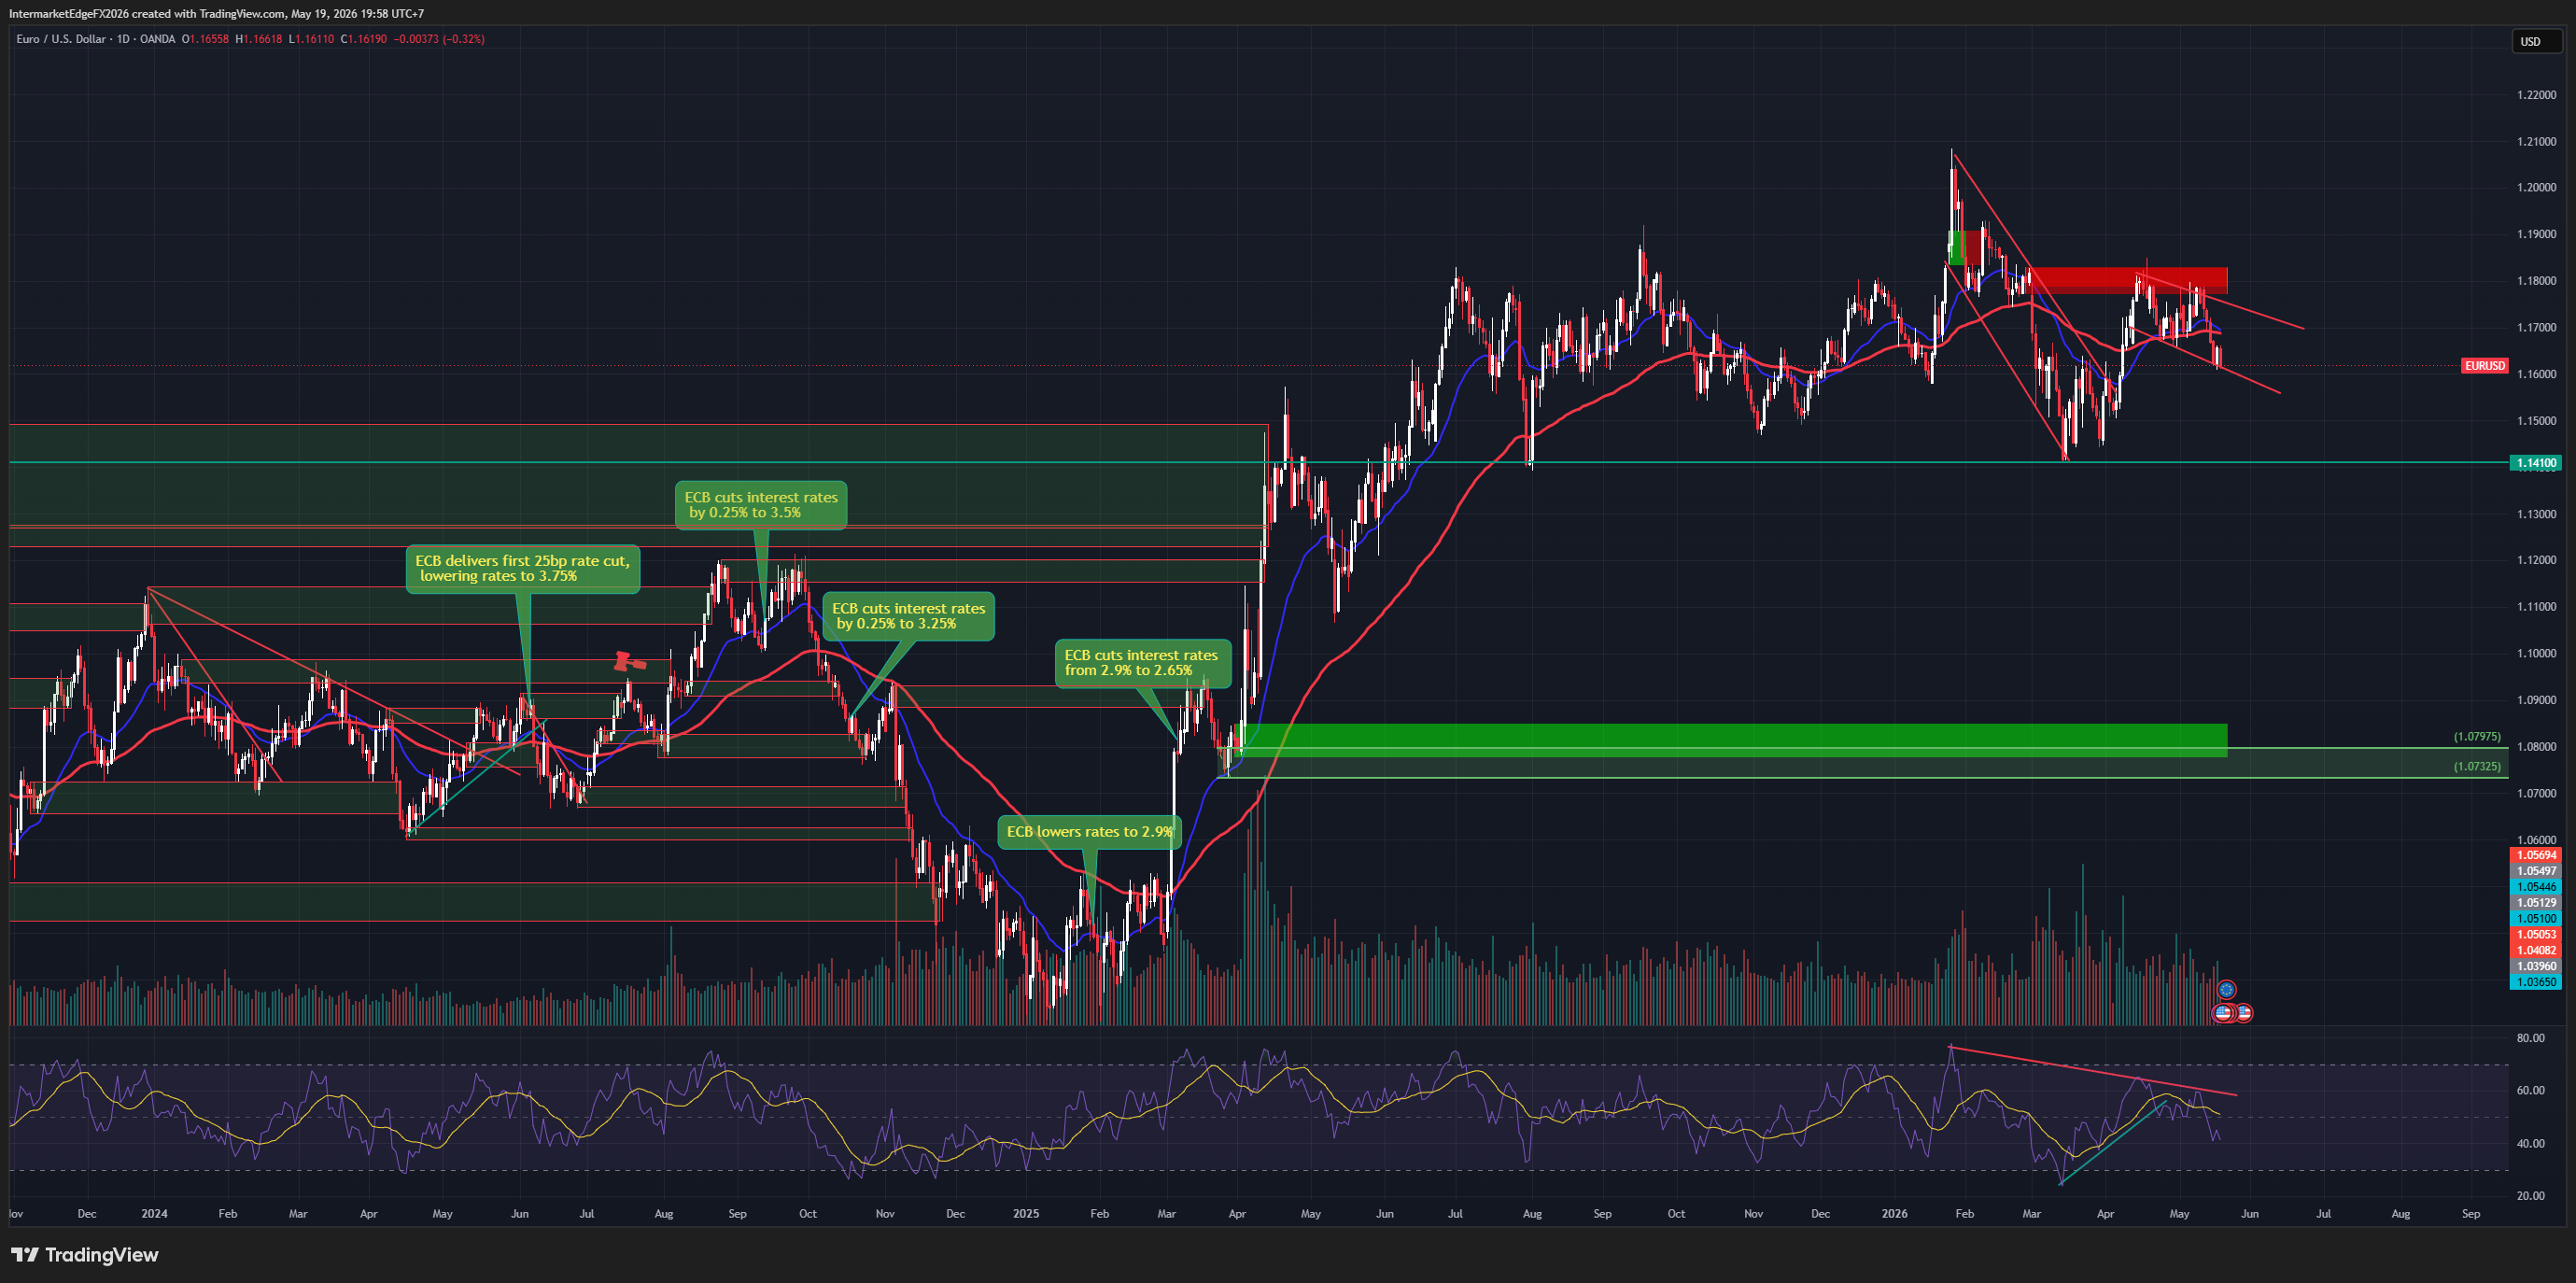
**EURUSD | May 19, 2026** EURUSD is trading at 1.1621 tonight. By every classical measure, it should not be here. The ECB is in a cutting cycle with the deposit rate at 2.50%. Eurozone CPI is at 2.2%. The DE-US 10Y yield spread is -163 basis points - one of the widest structural disadvantages for EUR in over a decade. Every rate differential model says EURUSD should be closer to 1.08-1.10. The fact that it is trading 600 pips above that range is the most important macro signal in FX right now. Something structural has changed. Global central banks and sovereign wealth funds - particularly from the Middle East, Asia, and emerging markets - have been systematically reducing USD exposure since the SWIFT exclusion of Russia in 2022. The Iran war shock of February 2026 accelerated that process. EUR is the deepest and most liquid alternative to USD in global reserve portfolios, and it is absorbing a structural bid that has nothing to do with ECB versus Fed policy. This is the regime that explains the anomaly. De-dollarization flows are non-price-sensitive and do not stop for weekly data releases. They provide a persistent floor under EUR demand that the standard interest rate model cannot see. Two additional forces are reinforcing this bid: Warsh uncertainty - the new Fed Chair has zero established reaction function, keeping institutional dollar positioning tentative - and Brent crude above $110, which signals the Hormuz premium is still active and the geopolitical urgency driving reserve reallocation has not eased. The near-term structure is consolidation between 1.14 and 1.19. No collapse without a hawkish Warsh shock or genuine Hormuz resolution. No breakout above 1.19 without US data deterioration or further geopolitical escalation. Watch Brent and EURGBP daily - they tell you whether the regime is intact before EURUSD price does.
GBPUSD | May 19, 2026 Sterling at 1.3412 - Holding the Line While the Dollar Searches for Direction

GBPUSD | May 19, 2026 Sterling at 1.3412 - Holding the Line While the Dollar Searches for Direction

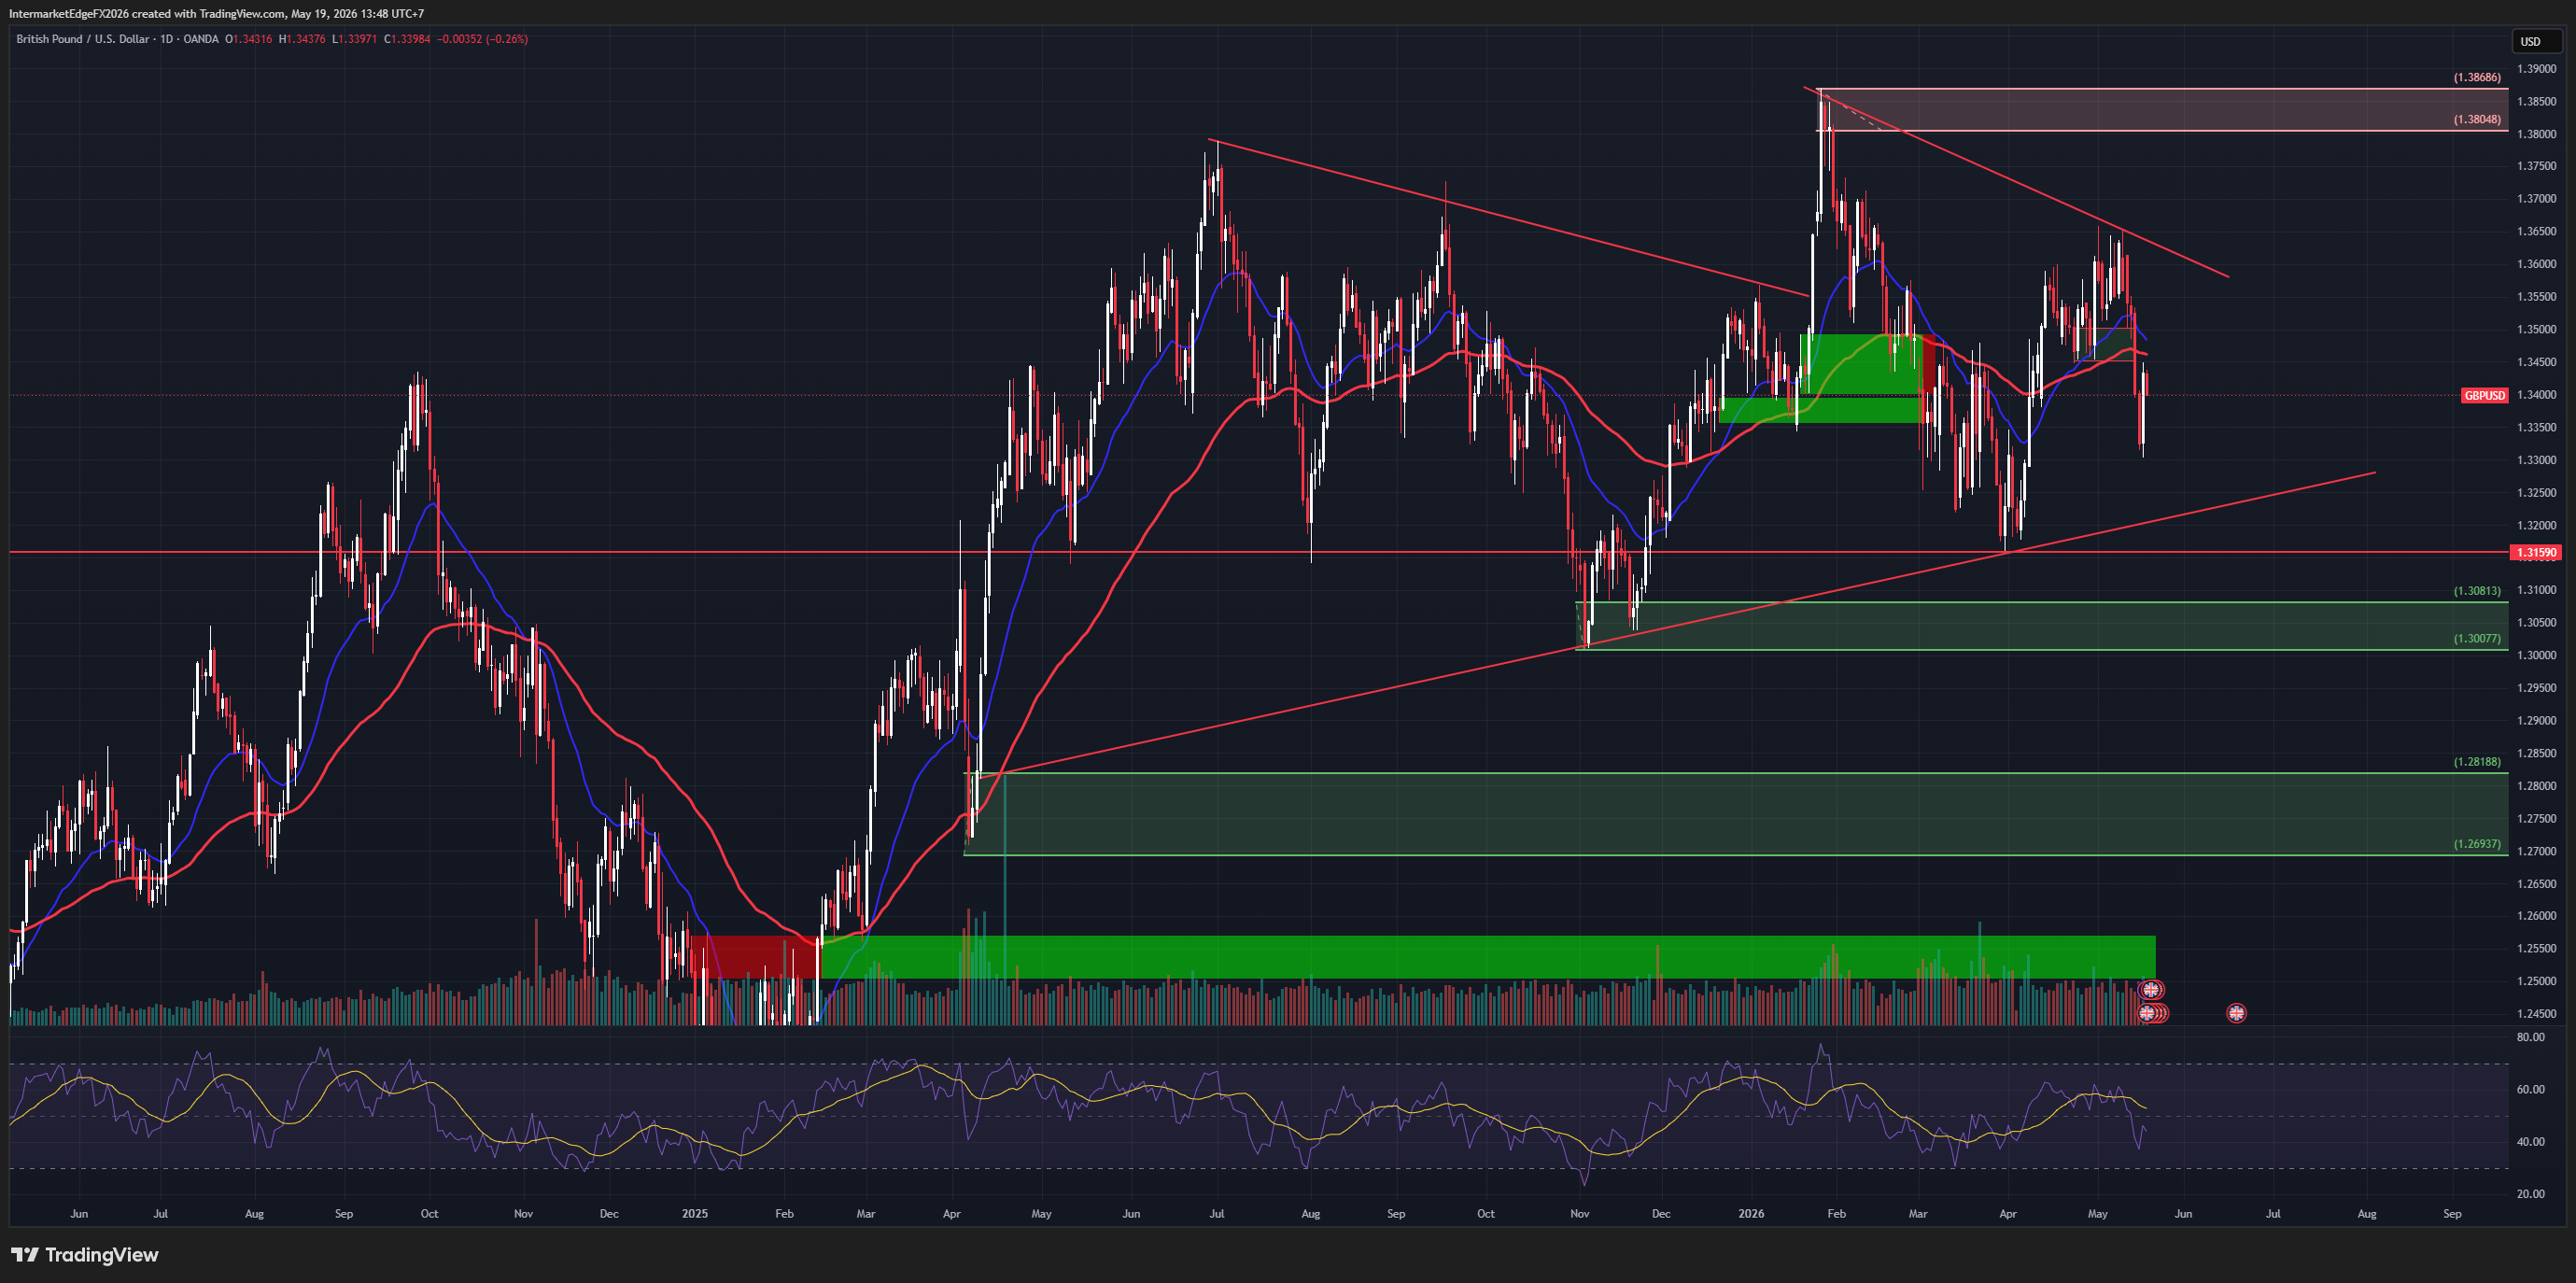
GBPUSD is trading around 1.3412 within a descending wedge structure that has been developing since the January 2026 highs. The pair is now approaching a key compression point, with UK labor market data on May 19 likely to determine the next breakout direction. From a macro perspective, the USD remains trapped in a “stagflationary ambiguity” regime: inflation is still elevated while growth is slowing, leaving the Fed without a clear path forward. Despite higher US yields, DXY remains capped below 100 due to EUR strength and broader de-dollarization flows, indirectly supporting GBPUSD. On the UK side, the economy faces its own stagflation pressures. Inflation remains sticky, growth is weak, and the BoE is stuck in a difficult position — unable to tighten aggressively but not ready to ease either. EURGBP at 0.8682 confirms that GBP has been underperforming EUR, meaning GBPUSD resilience has been driven more by USD weakness than genuine sterling strength. Three major drivers are shaping GBPUSD this week: 1. UK labor data (Claimant Count & Unemployment Rate) Weak data would pressure GBP lower, while stable employment and strong wages could support an upside breakout. 2. USD direction via Fed communication and DXY A move above DXY 100 would create renewed downside pressure on GBPUSD. 3. The wedge compression structure itself The market is nearing the wedge apex, suggesting a significant breakout is likely within 1–2 weeks. Key technical levels: * Resistance: 1.3500 → 1.3727 → 1.3800 * Support: 1.3308 → 1.3196 → 1.2700 Bullish scenario: * UK labor data remains firm and DXY stays below 100 → GBPUSD could break higher toward 1.3500 and potentially 1.3727. Bearish scenario: * UK labor data deteriorates while DXY breaks above 100.48 → GBPUSD could fall below 1.3308 and reopen the path toward the 1.28 region. Overall, the technical structure remains moderately bullish, but the fundamental outlook is still heavily dependent on UK labor data and the bro

The Dollar at 98.78 - Warsh Era Begins, Dollar Searches for Direction

The Dollar at 98.78 - Warsh Era Begins, Dollar Searches for Direction

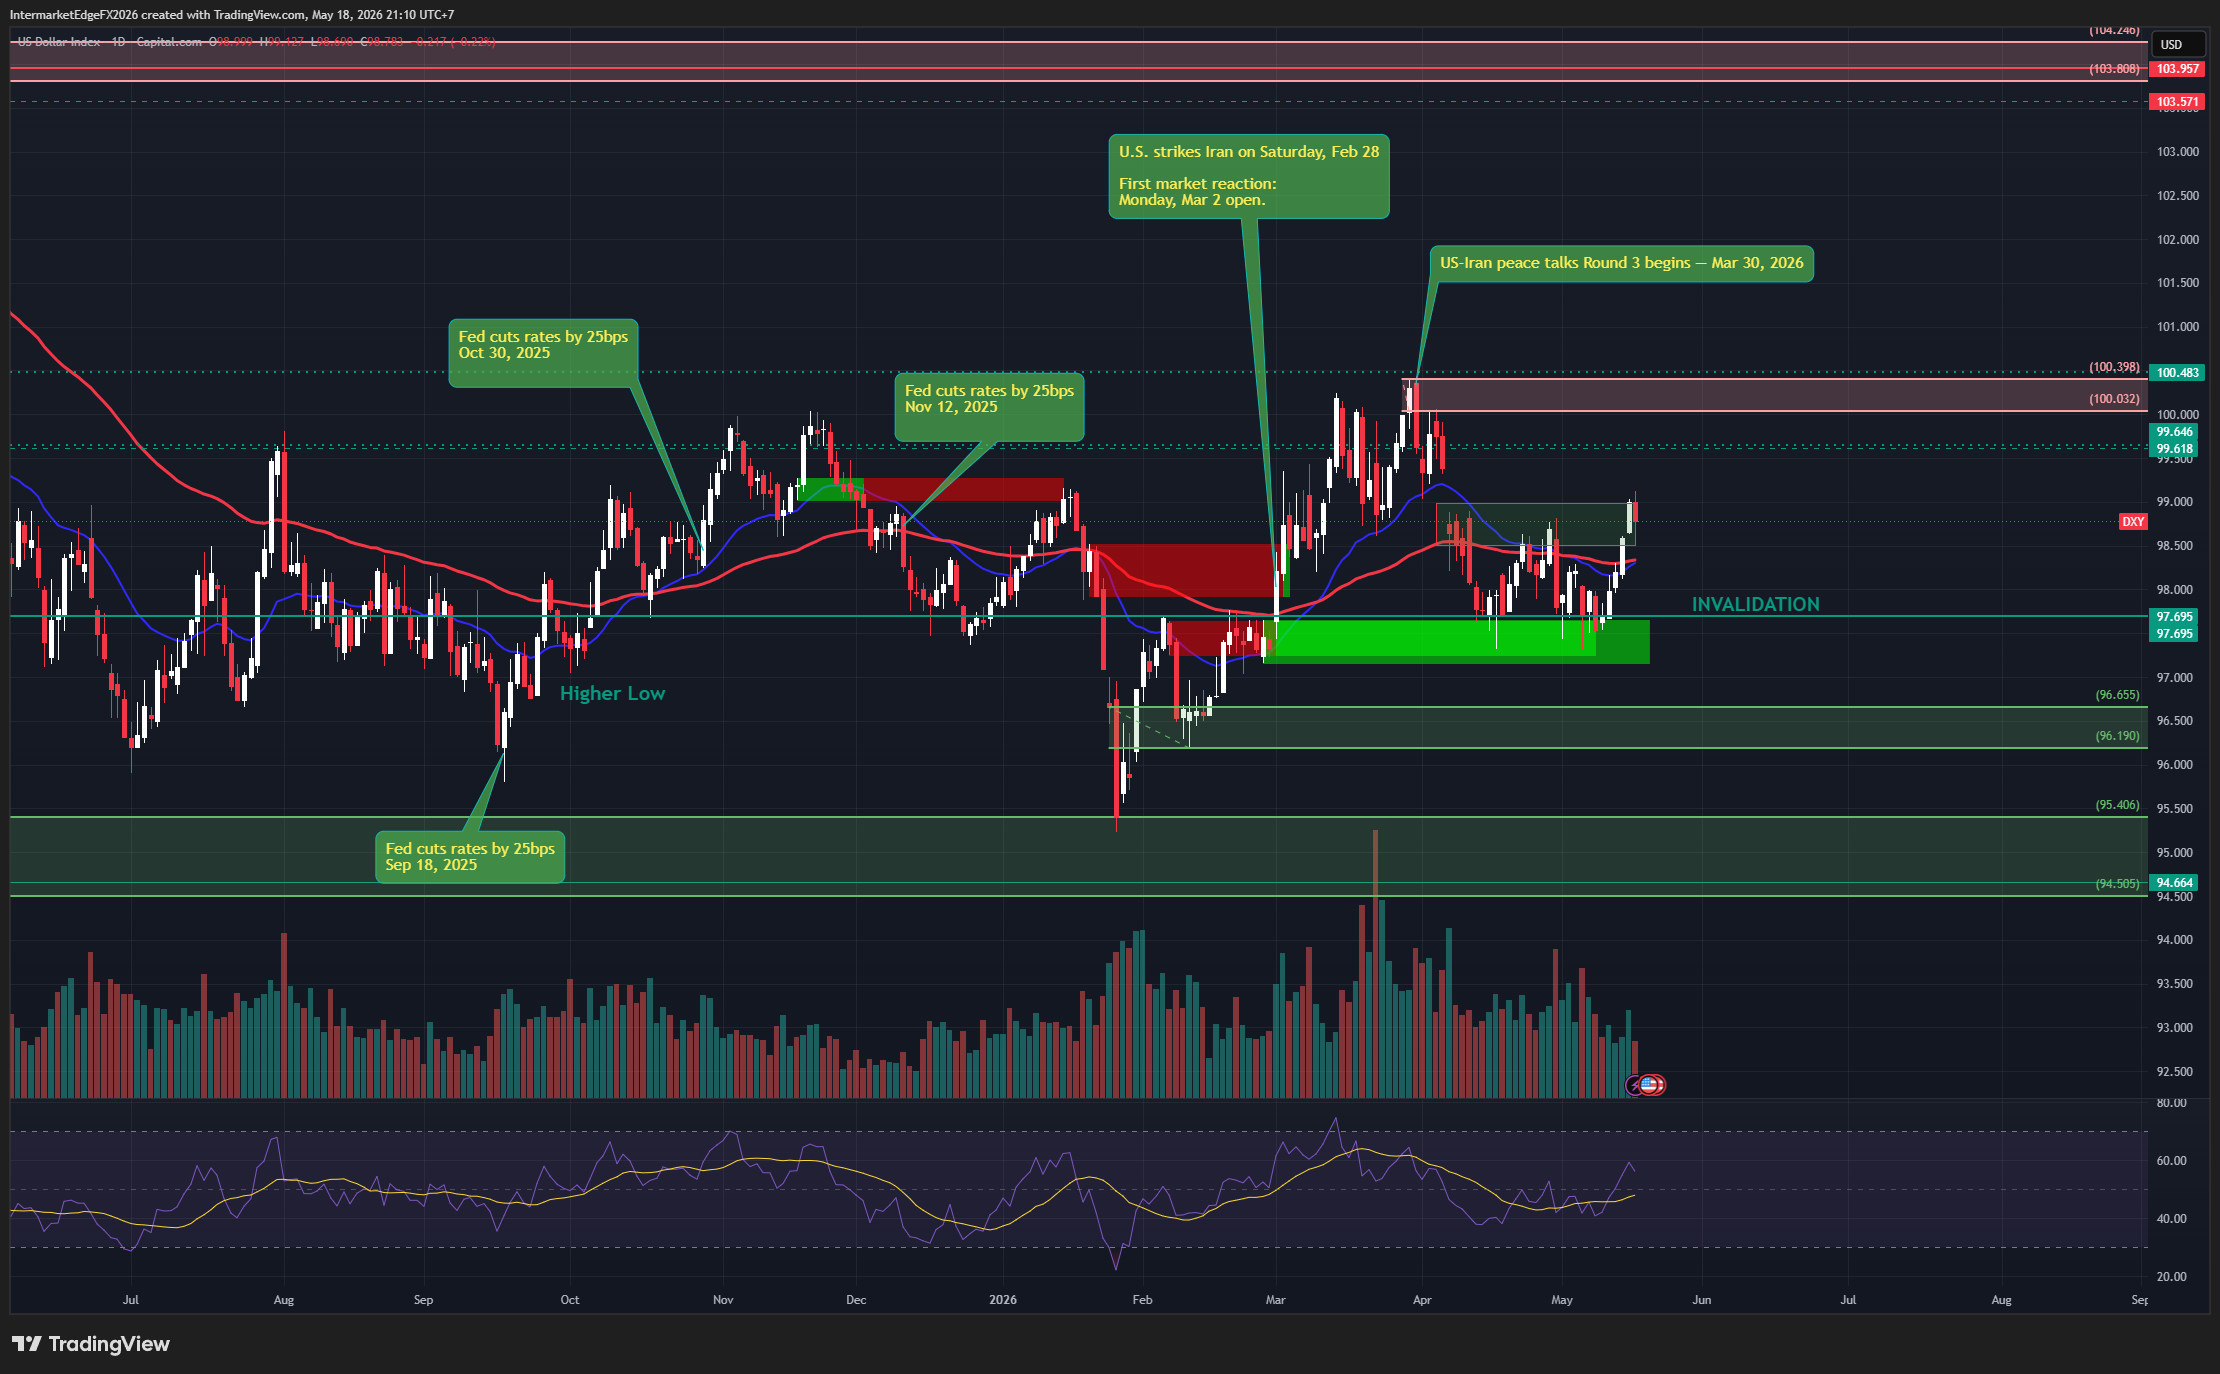
**DXY | Weekly Outlook - May 19, 2026** DXY is at 98.78. By every classical input it should be higher. That gap between where the dollar is and where the macro narrative says it should be is the most important question in FX this week. The United States has a new Fed Chair with a hawkish reputation. April CPI printed at 3.8%. CME FedWatch is pricing 40% probability of a rate hike by April 2027. In any previous tightening cycle, this configuration produces a stronger dollar. Yet DXY has been unable to reclaim 100 for nearly three months - since the Iran war began in late February and restructured the way institutional allocators think about reserve assets. What is holding DXY below 100 is not weakness in the US economy. It is the mechanical weight of EURUSD at 1.1651 - which alone accounts for 57.6% of the index - combined with a de-dollarization structural bid from EM central banks and sovereign wealth funds that does not respond to weekly rate moves. Global yields are also rising in parallel across DE10Y, JP10Y, and UK10Y, which limits the relative yield advantage that would normally drive institutional dollar buying. The regime is Stagflationary Dollar Ambiguity. Two forces are fighting simultaneously and neither has won: the inflation case for dollar strength and the geopolitical case for reserve asset diversification away from USD. This week, the resolution comes from one event: FOMC Member Waller speaks Tuesday May 19. Three scenarios - hawkish confirmation sends DXY toward 99.62 then 100.48, ambiguity keeps the range, dovish surprise breaks 97.695 support. Conviction is Medium-Low. This is not a week for directional dollar positioning ahead of Tuesday.

Gold at $4,553 - What Is the Market Still Pricing In?

Gold at $4,553 - What Is the Market Still Pricing In?

**XAUUSD | Weekly Outlook - May 19, 2026** Gold at $4,553 is not a speculative bubble price. It is a regime price - and understanding that distinction is the entire thesis of this analysis. Six months ago, $4,500 gold was a tail-risk scenario in institutional forecasting models. Today it is the base. The forces that drove it here - central bank accumulation running since 2022, the Hormuz geopolitical premium keeping Brent above $110, Warsh uncertainty creating a genuine unknown about the real yield path, and a structural de-dollarization bid from EM central banks and sovereign wealth funds - have not reversed. They are still active, still measurable, and still doing heavy lifting that the yield math alone cannot explain. What makes this regime unusual is that gold is holding all-time highs despite positive real yields. Classical monetary theory says this should not be happening. The fact that it is tells you the geopolitical and reserve asset restructuring layers are overriding the standard yield-gold relationship. This week, the directional catalyst is singular: FOMC Member Waller speaks Tuesday May 19. If he signals hikes are genuinely on the table for 2026, gold faces -$100 to -$150 intraday risk as the market reprices the real yield assumption embedded in current prices. If he maintains ambiguity, the $4,650-$4,700 upside target remains in play. Key support at $4,420. Invalidation on daily close below that level. Conviction: Medium-High. Structure favors the long side. Timing is Tuesday.

Oil Rises, CAD Doesn't - The Market Is Telling You Something

Oil Rises, CAD Doesn't - The Market Is Telling You Something

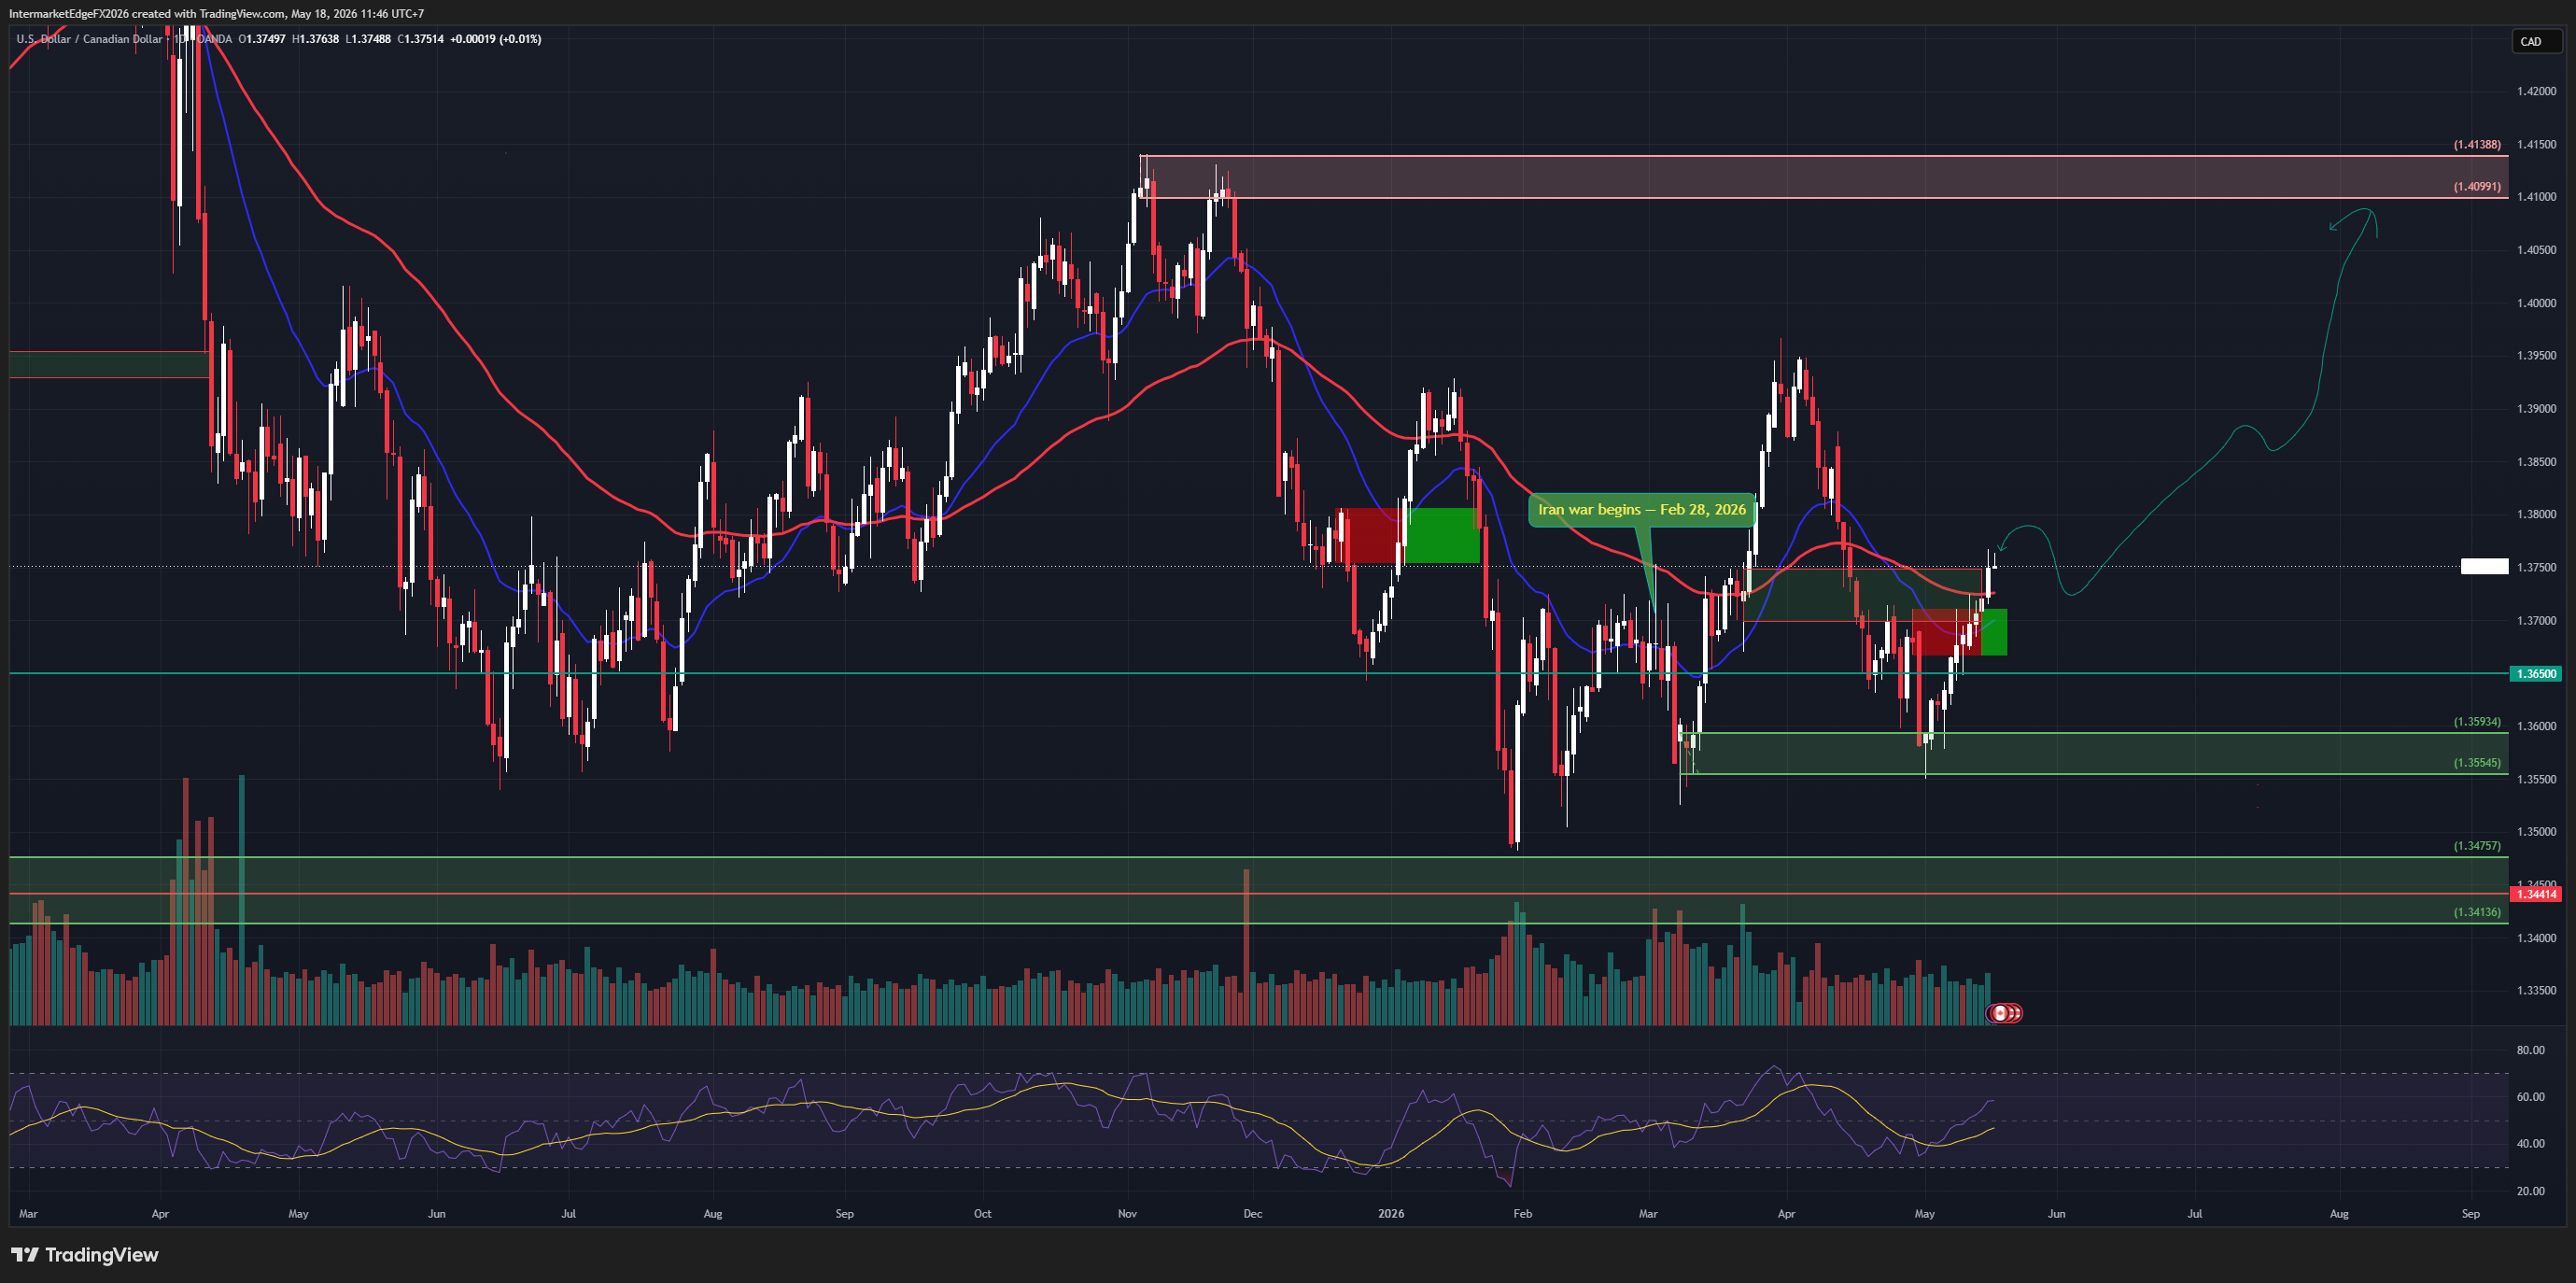
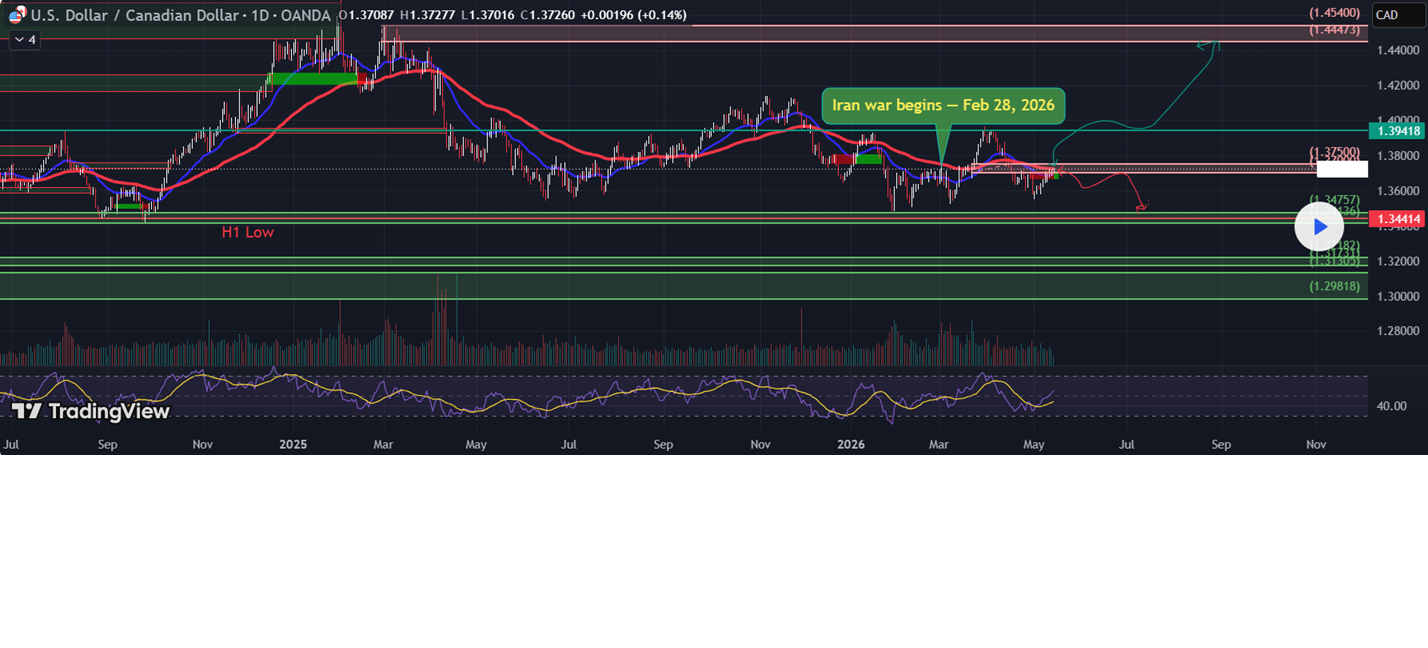
There is something unusual happening with USDCAD this week that most traders will miss if they only look at the exchange rate in isolation. WTI is trading above $103. Brent is above $111. At these oil levels, the textbook says USDCAD should be moving lower - CAD is a petrocurrency, and its correlation with W

BULLISH structural — the Brent-WTI divergence is telling the most important story in the oil mark

BULLISH structural — the Brent-WTI divergence is telling the most important story in the oil mark

Something unusual is happening in the oil market this morning that most traders will miss if they are only watching one benchmark. WTI is down sharply, -3.56% to 98.38, while Brent is up +0.49% to 109.75 — the Brent-WTI spread has blown out suddenly to approximately 11.37 USD. This is one of the widest readings since the Hormuz crisis began, and it is telling a very specific story about the structure of the

Stay in the loop

Get notified about new research, macro insights, and market analysis.

InterMarketEdge

© 2026 InterMarketEdge. Financial intelligence for inter-market traders.