Tag: Loonie — InterMarketEdge

Tag: Loonie

USDCAD Week W36-2026: CAD Strengthens Despite a Hawkish Bank of Canada

USDCAD Week W36-2026: CAD Strengthens Despite a Hawkish Bank of Canada

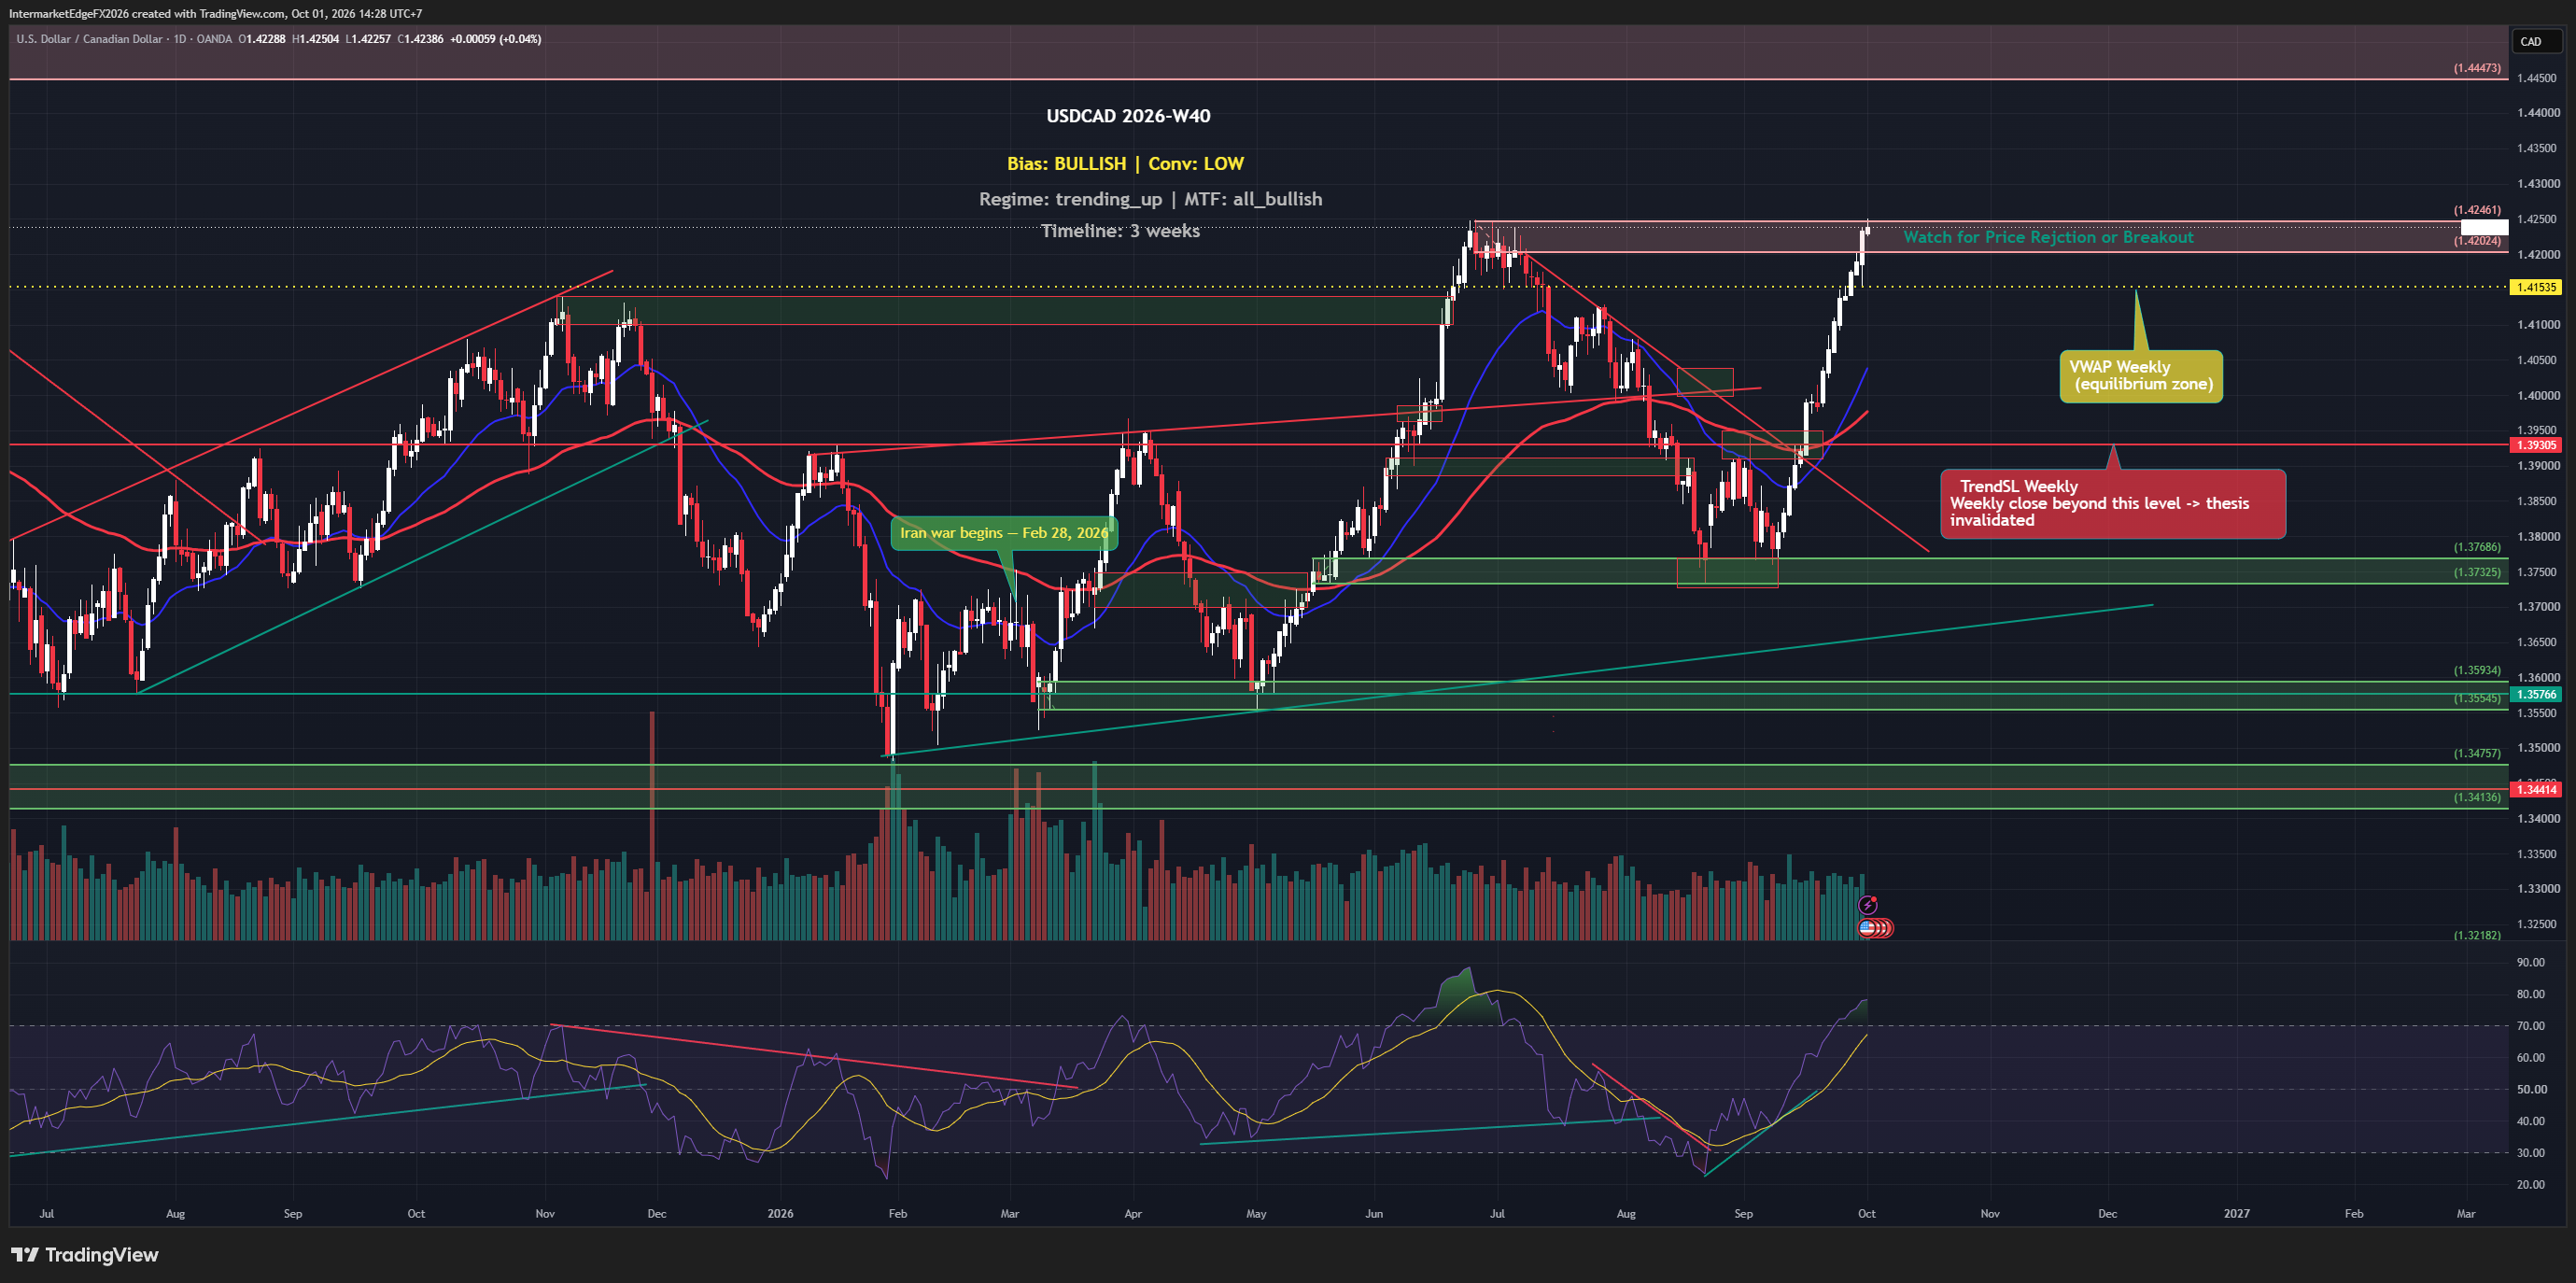
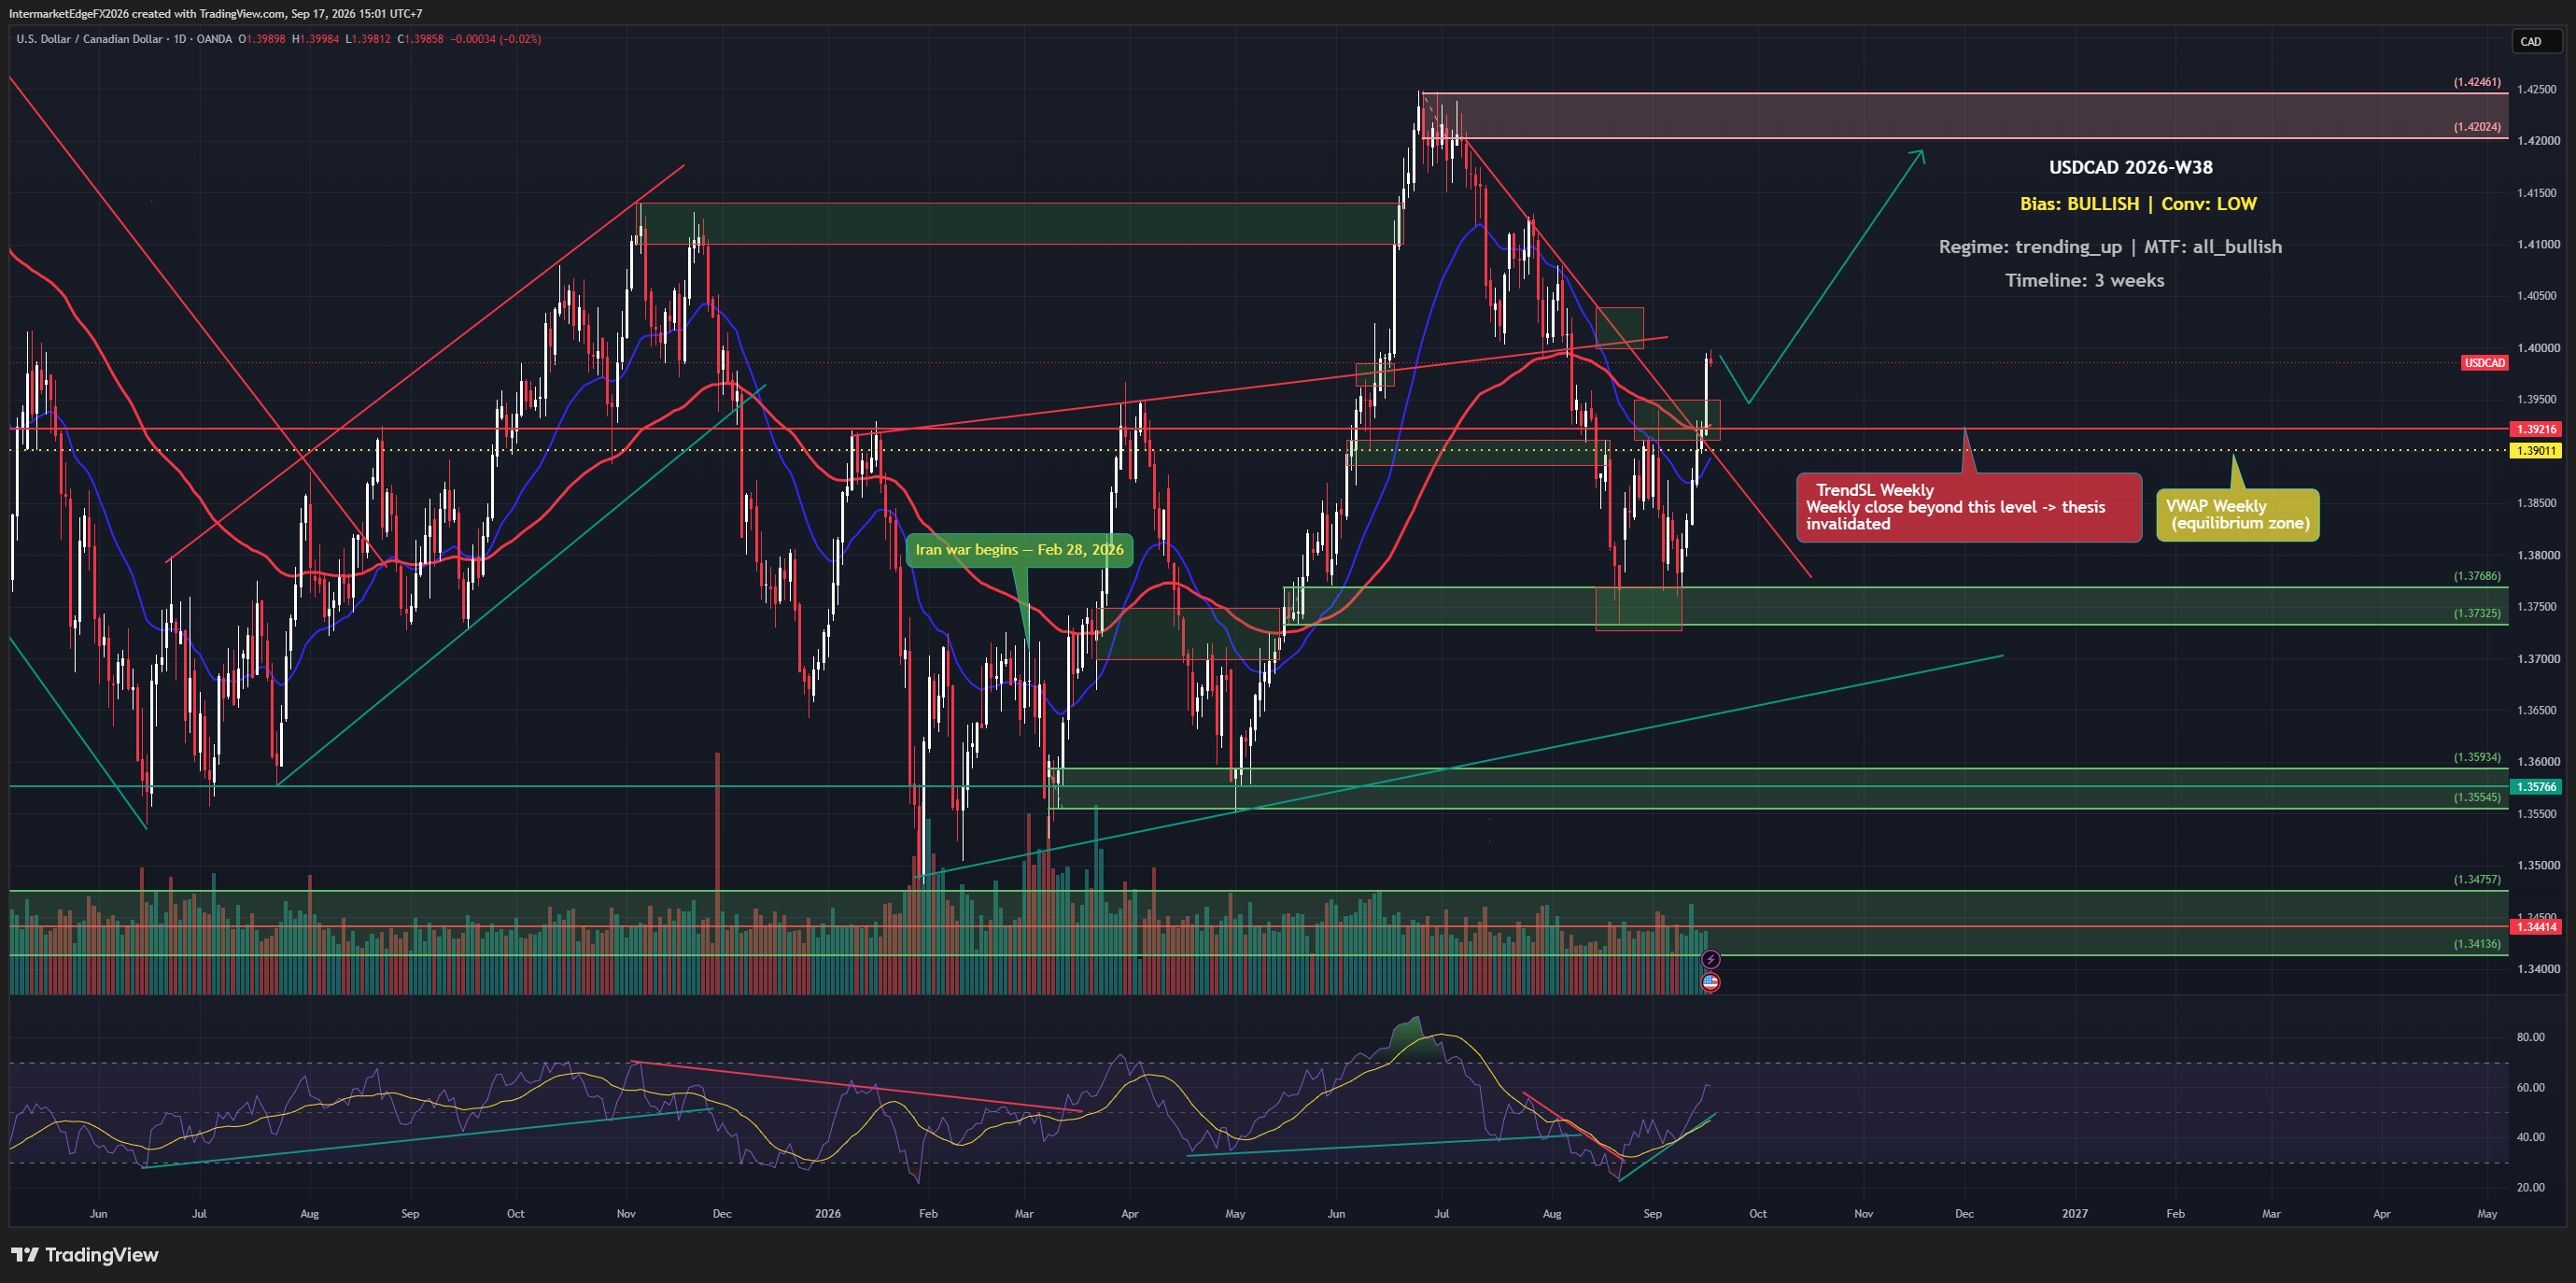
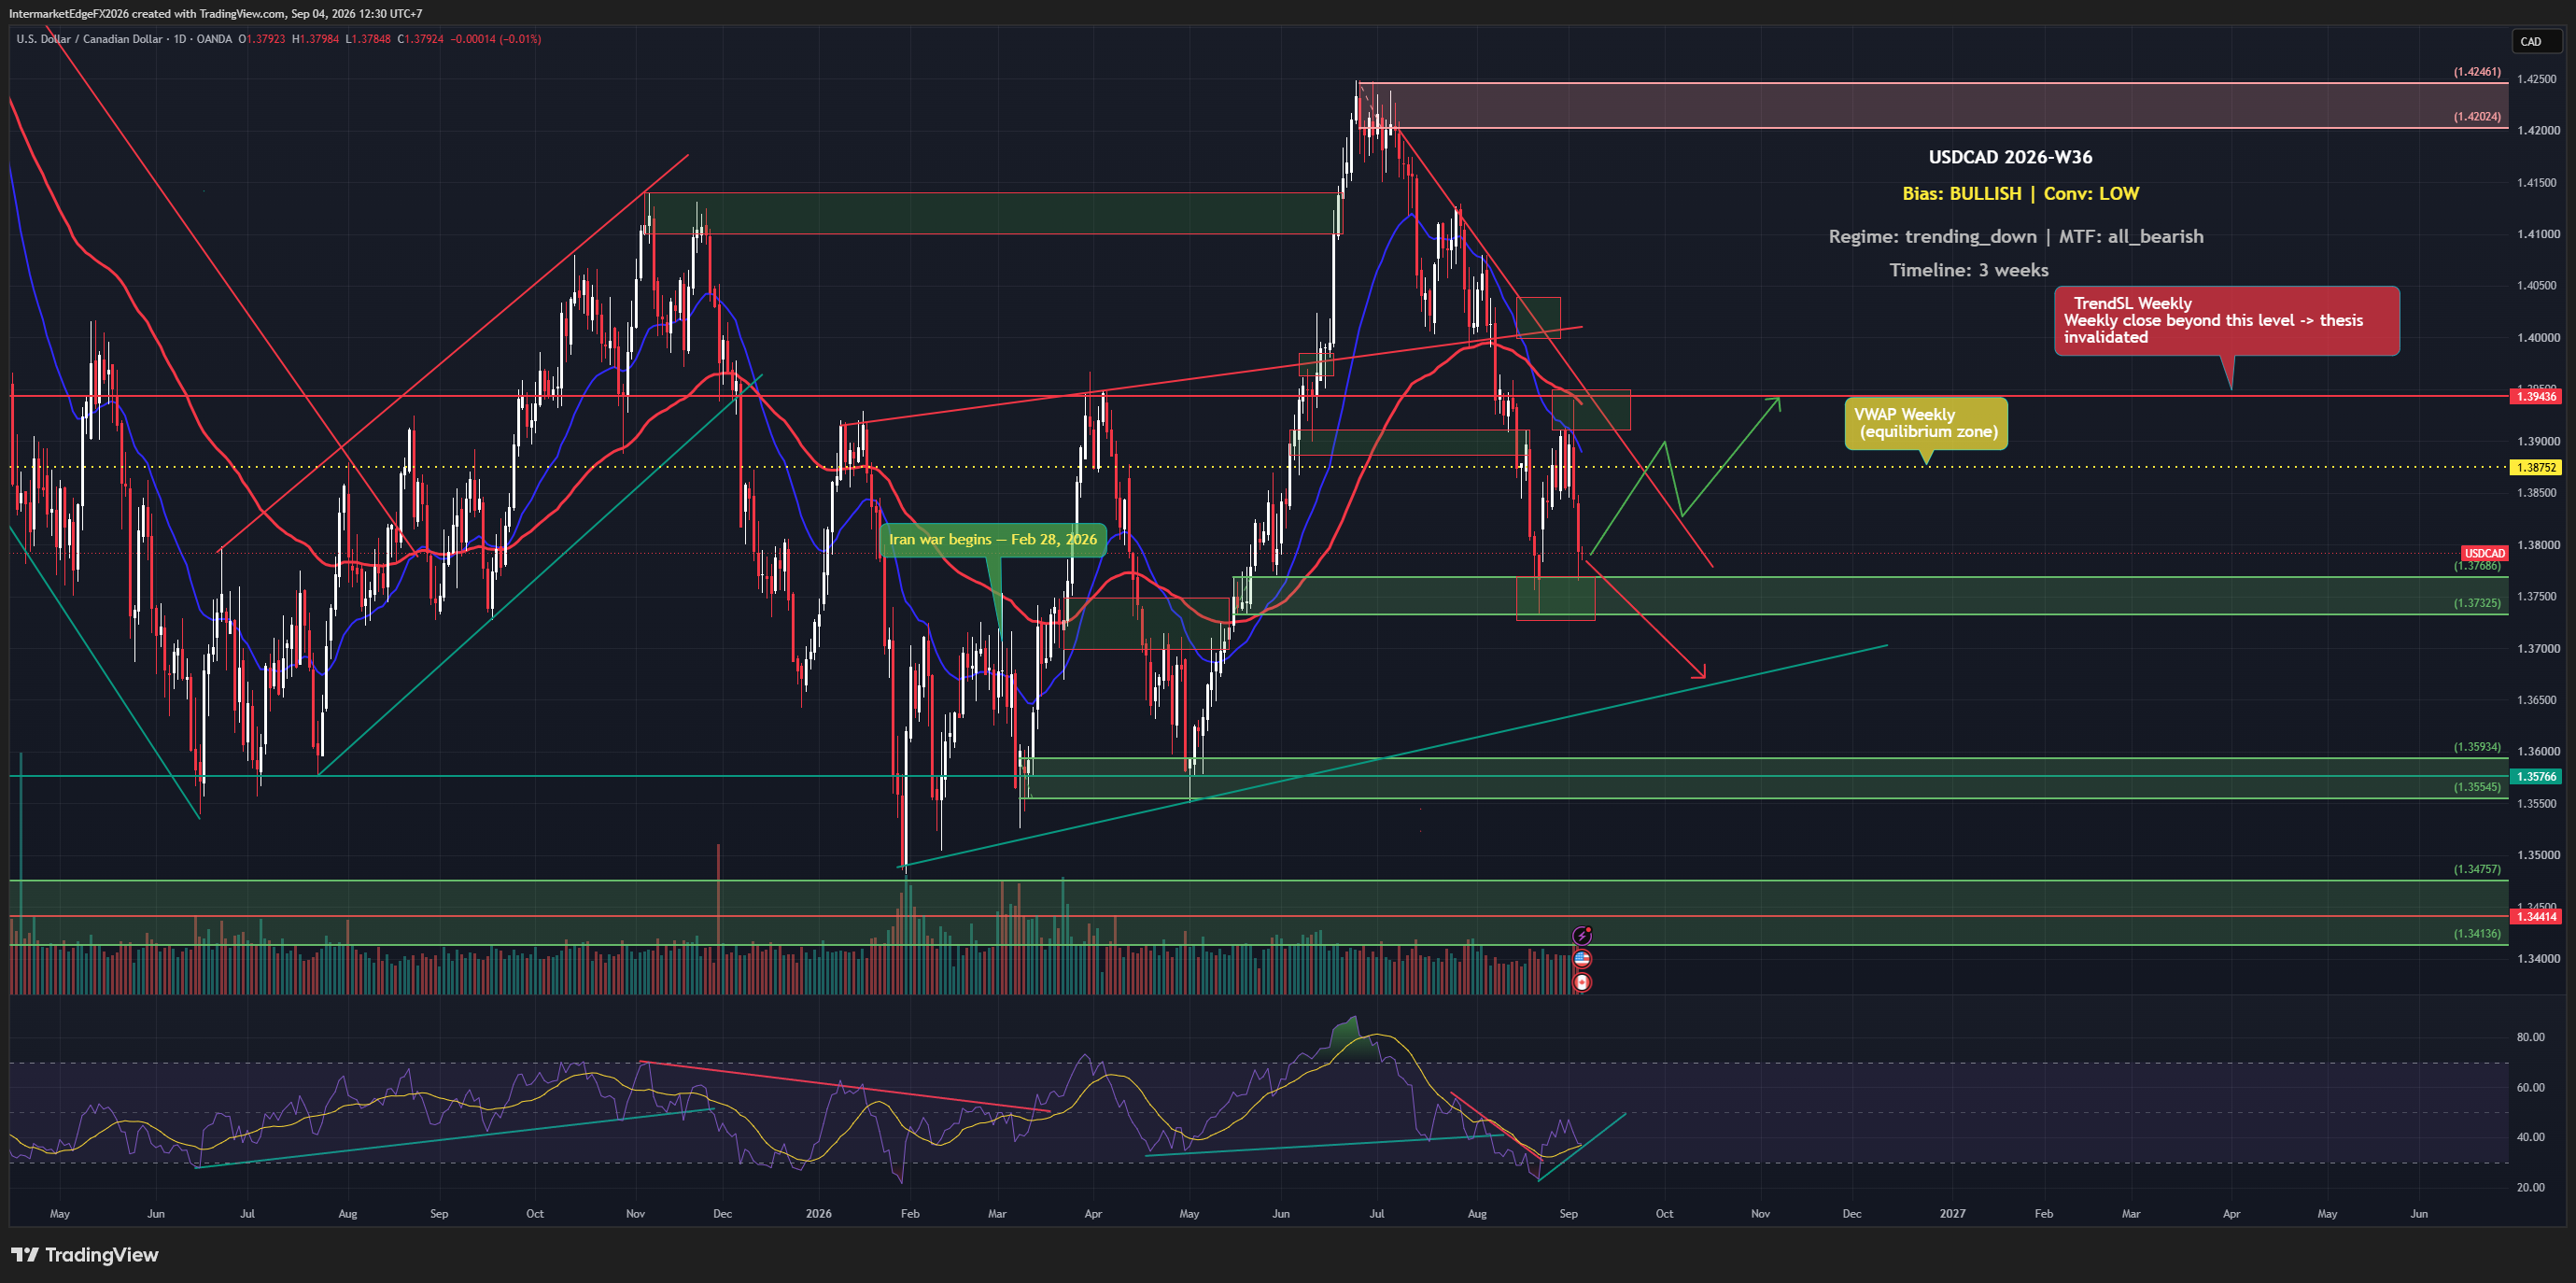
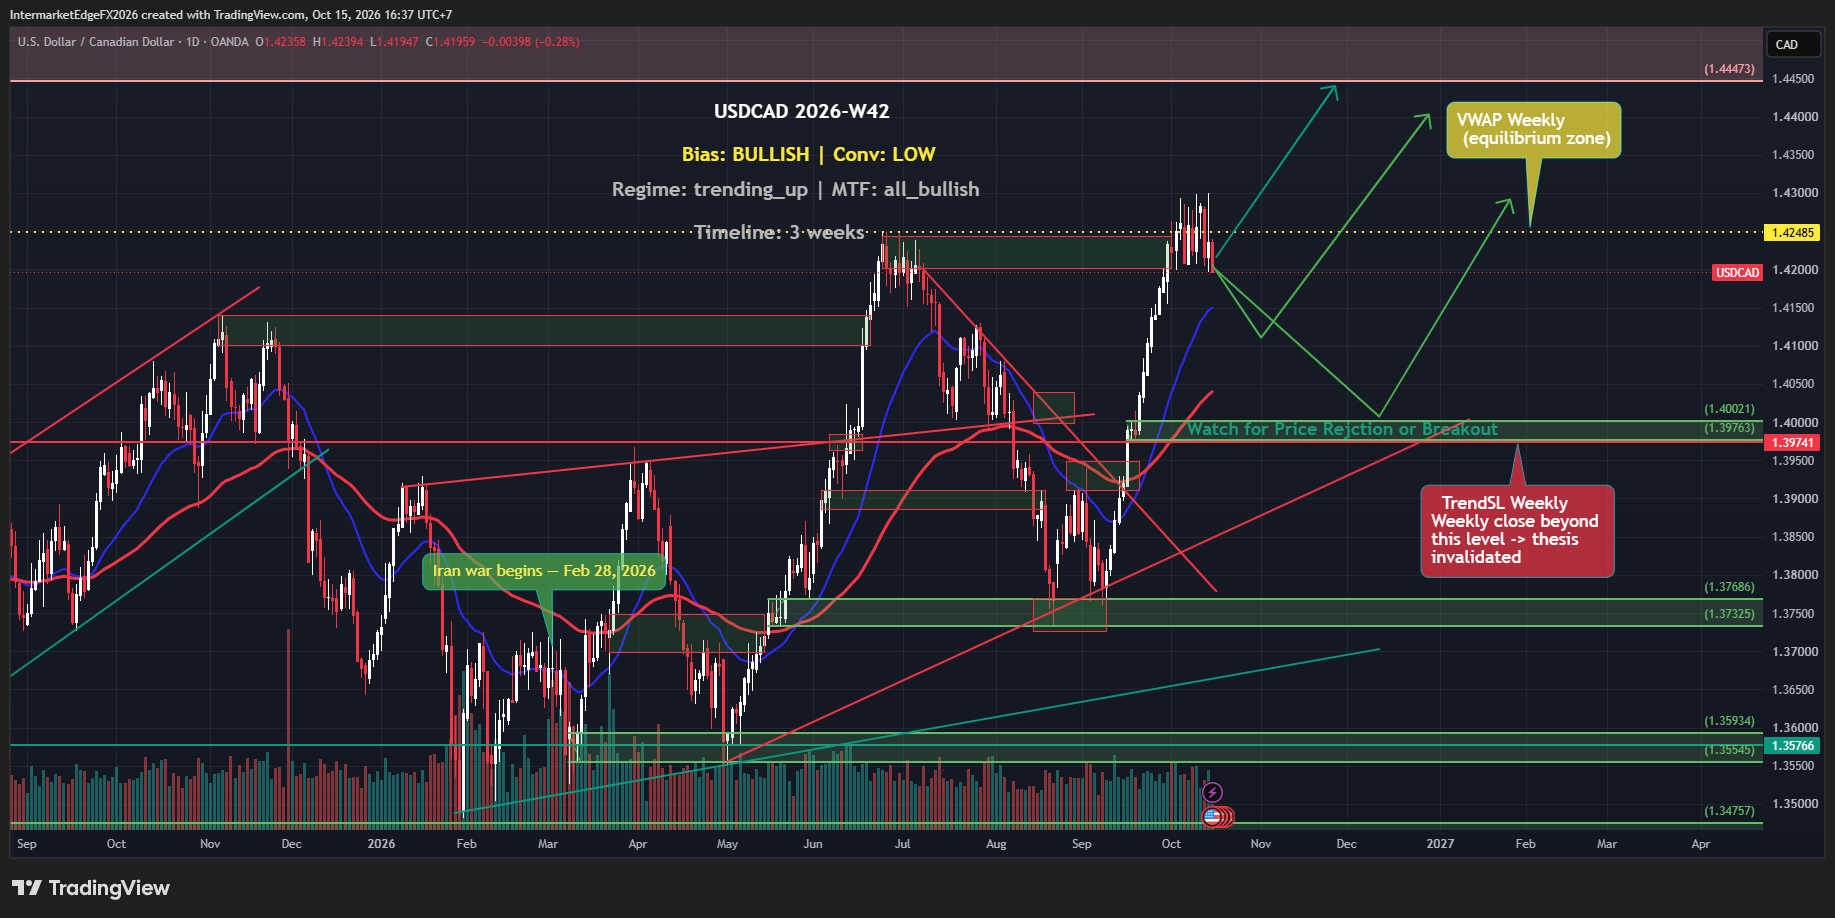
The Bank of Canada just signaled that persistent inflation could force multiple rate hikes, which on paper is a CAD-positive and USDCAD-negative catalyst. Yet as of Friday, 04 September 2026, the pair sits at 1.37896, below both its weekly VWAP and its trend stop-loss level, and the Canadian dollar actually strengthened in the latest session. When a hawkish central bank warning fails to lift the pair, that divergence between narrative and price deserves serious attention before any directional bet is sized. The directional call on USDCAD for this three-week window is bullish, anchored on two structural pillars: the Fed's hawkish posture lifting real yields and widening the rate differential against the BoC, and a COT positioning lean that tilts modestly in the dollar's favor. When the Fed keeps real yields elevated while the BoC sits on hold, the carry dynamic, the return earned by holding the higher-yielding currency, funded by selling the lower-yielding one, mechanically favors USD. That logic is coherent and consistent with past USDCAD behavior during Fed-BoC divergence cycles. The problem is that conviction here is deliberately low, and for reasons that go beyond a single data point. Two of the five analytical pillars, liquidity conditions and market sentiment, produced no usable signal this week. That silence does not mean those factors are neutral; it means the evidence base is incomplete, and sizing a position on three pillars when two are dark is a different risk than sizing on five. More critically, the price itself is already contradicting the thesis at its foundation: at 1.37896, USDCAD is trading below the weekly VWAP at 1.38752 and below the weekly trend stop-loss at 1.39429, meaning the technical structure does not support the bullish label, it actively contradicts it. The bullish bias reflects a macro and positioning overlay, not a technically confirmed setup. -- Intermarket Edge (Note: COT (Commitment of Traders) data is released weekly by the CFTC

USDCAD Week W34-2026: CAD Hits a 2.5-Month High, But the Bullish Case for USD Is Not Dead Yet

USDCAD Week W34-2026: CAD Hits a 2.5-Month High, But the Bullish Case for USD Is Not Dead Yet

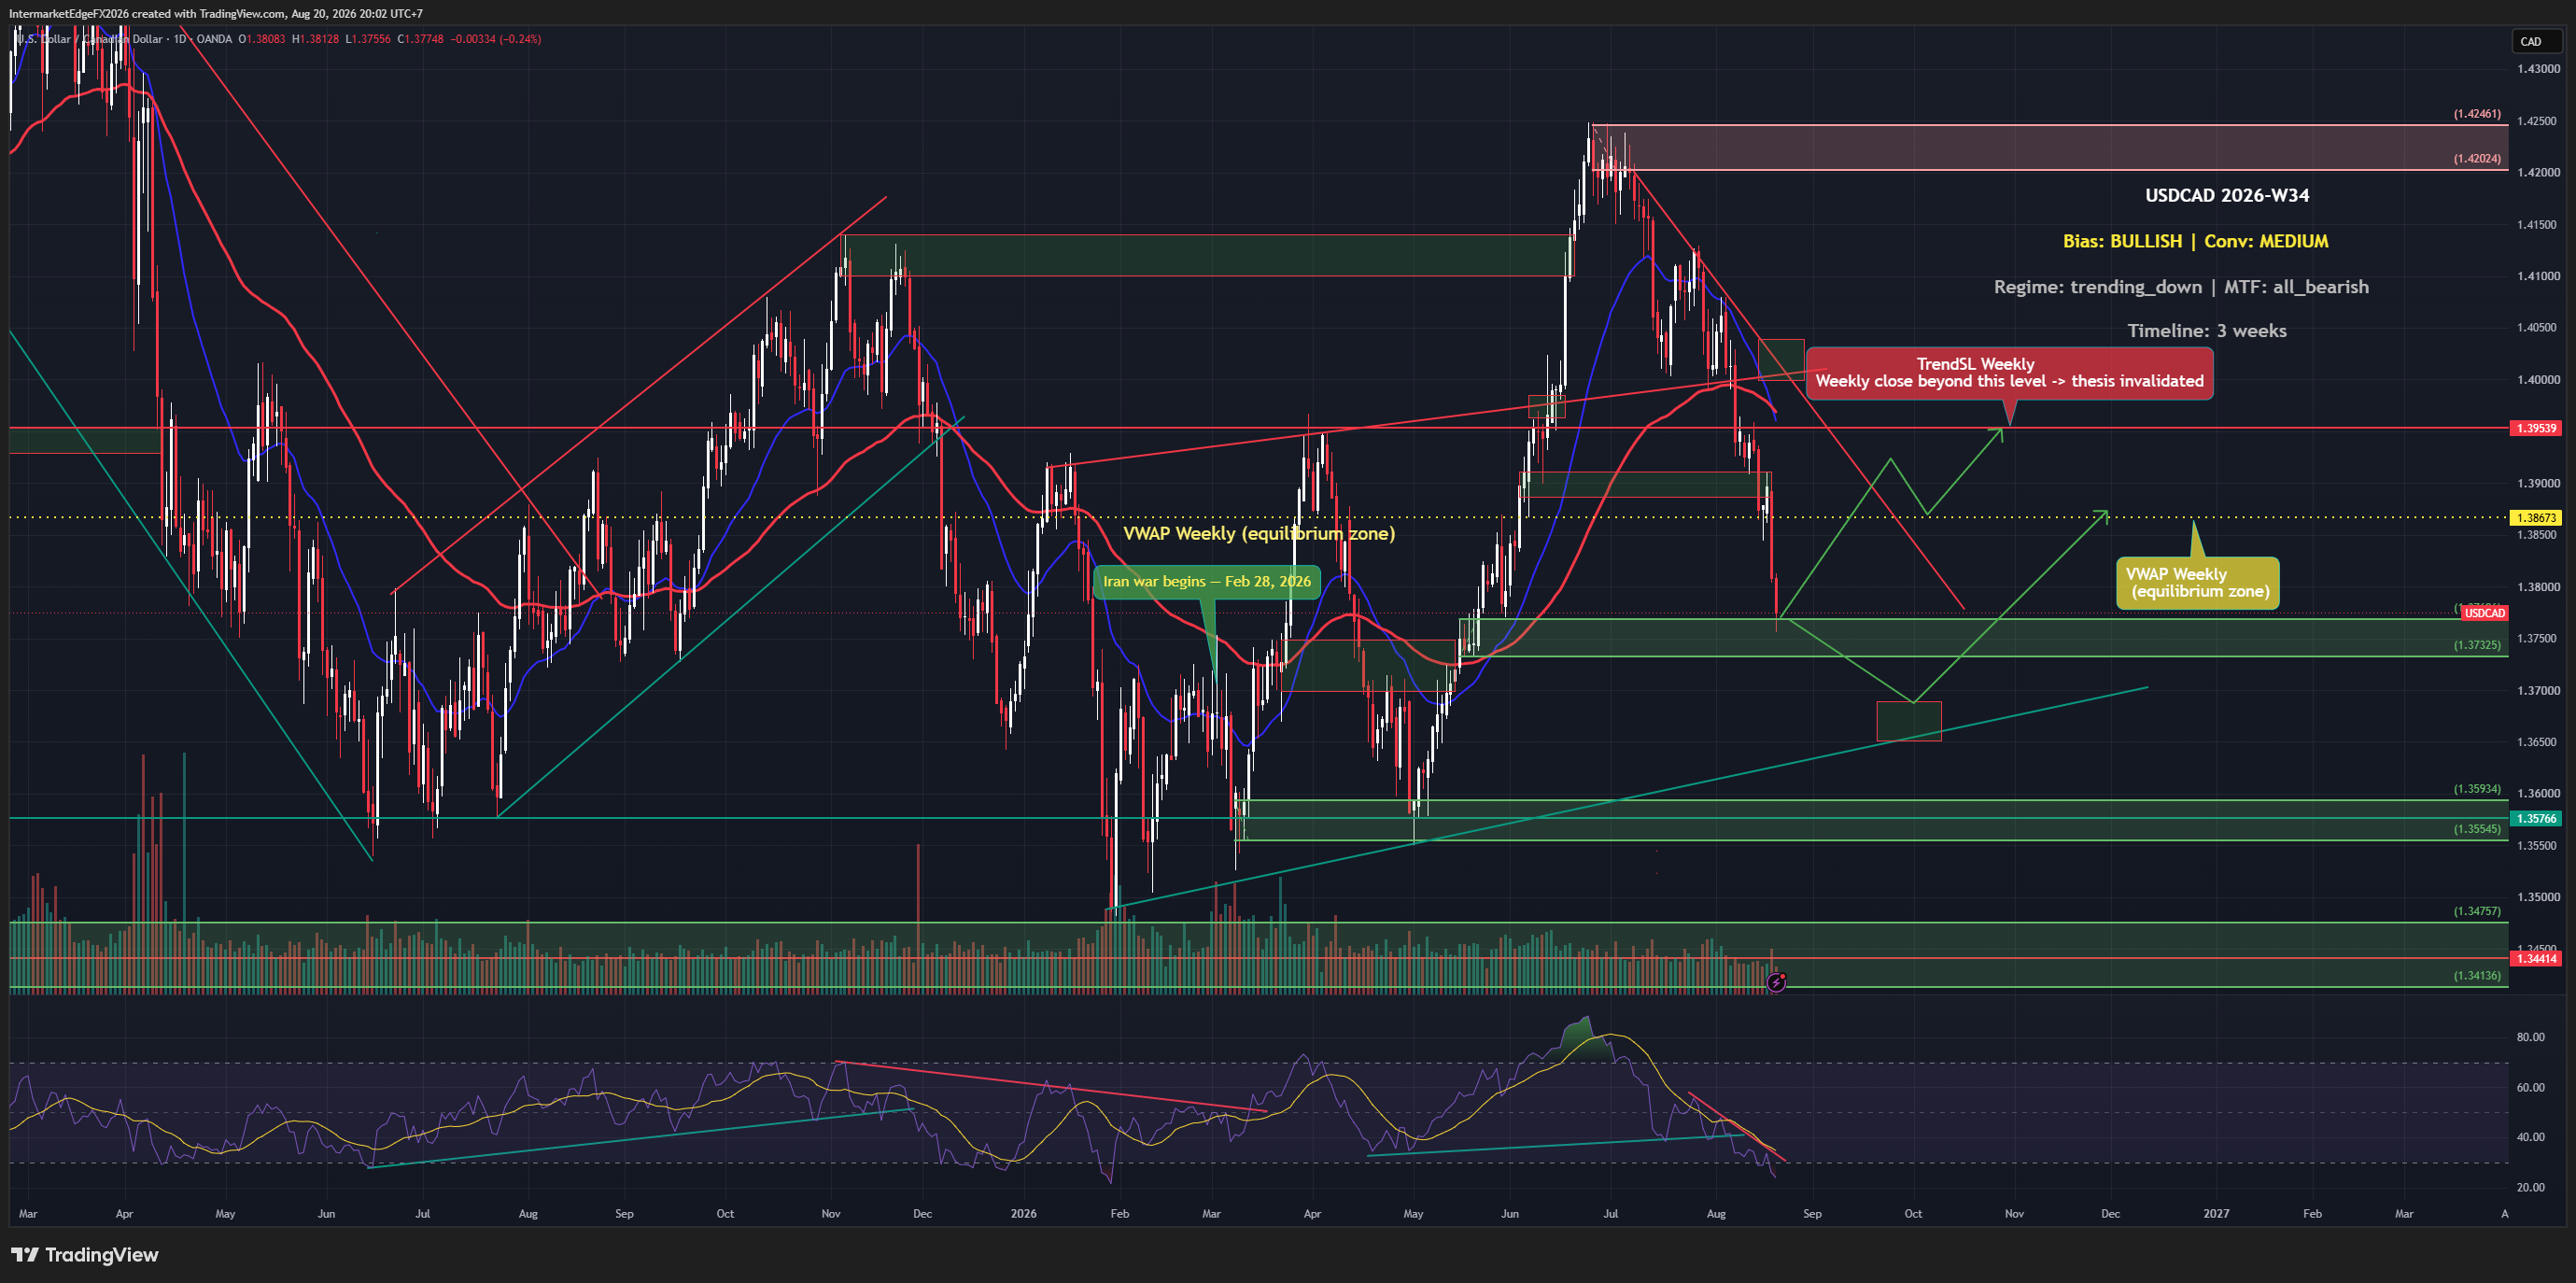
USDCAD is printing a bullish macro thesis this week, anchored by Fed hawkishness and rising real yields, yet as of Thursday, 20 August 2026, price at 1.37743 sits below both the weekly VWAP and the trend stop-loss level. The Canadian dollar just hit a 2.5-month high on a US tariff reprieve, and that headline momentum is running directly against the bullish USD framing. When macro and price structure disagree this sharply, the setup demands patience, not commitment. The framework carries a bullish bias on USDCAD this week, but that label comes with a structural caveat that matters enormously for how to read it. At the time the thesis was generated, the reference close of 1.37943 was already sitting below the weekly trend stop-loss at 1.39539, meaning the technical structure contradicted the bullish label from the outset. This is not a setup where price pulled back to test support after confirming the trend; it is a setup where the trend-defining level was never reclaimed in the first place. Treat the bullish designation as a framework-level view driven by macro and COT inputs, not as a technically-endorsed signal. The macro pillar is real: Fed hawkishness paired with a 2.41% real yield creates a genuine USD tailwind, and the rate differential does historically favor USD strength when the Fed is the more hawkish central bank. The COT picture adds a complementary angle, speculator positioning in CAD is at an extreme short, which historically precedes short-squeeze episodes where crowded trades unwind rapidly and push the currency higher than fundamentals alone would justify. COT crowding risk, as a concept, means that the more one-sided positioning becomes, the less fuel remains for the trend to extend, and any catalyst can flip the direction hard. -- Intermarket Edge (Note: COT (Commitment of Traders) data is released weekly by the CFTC with a reporting-period lag -- it is not a real-time position feed. See cftc.gov for the exact release schedule.)

USDCAD W33: The Bullish Thesis Is Still Waiting for Price

USDCAD W33: The Bullish Thesis Is Still Waiting for Price

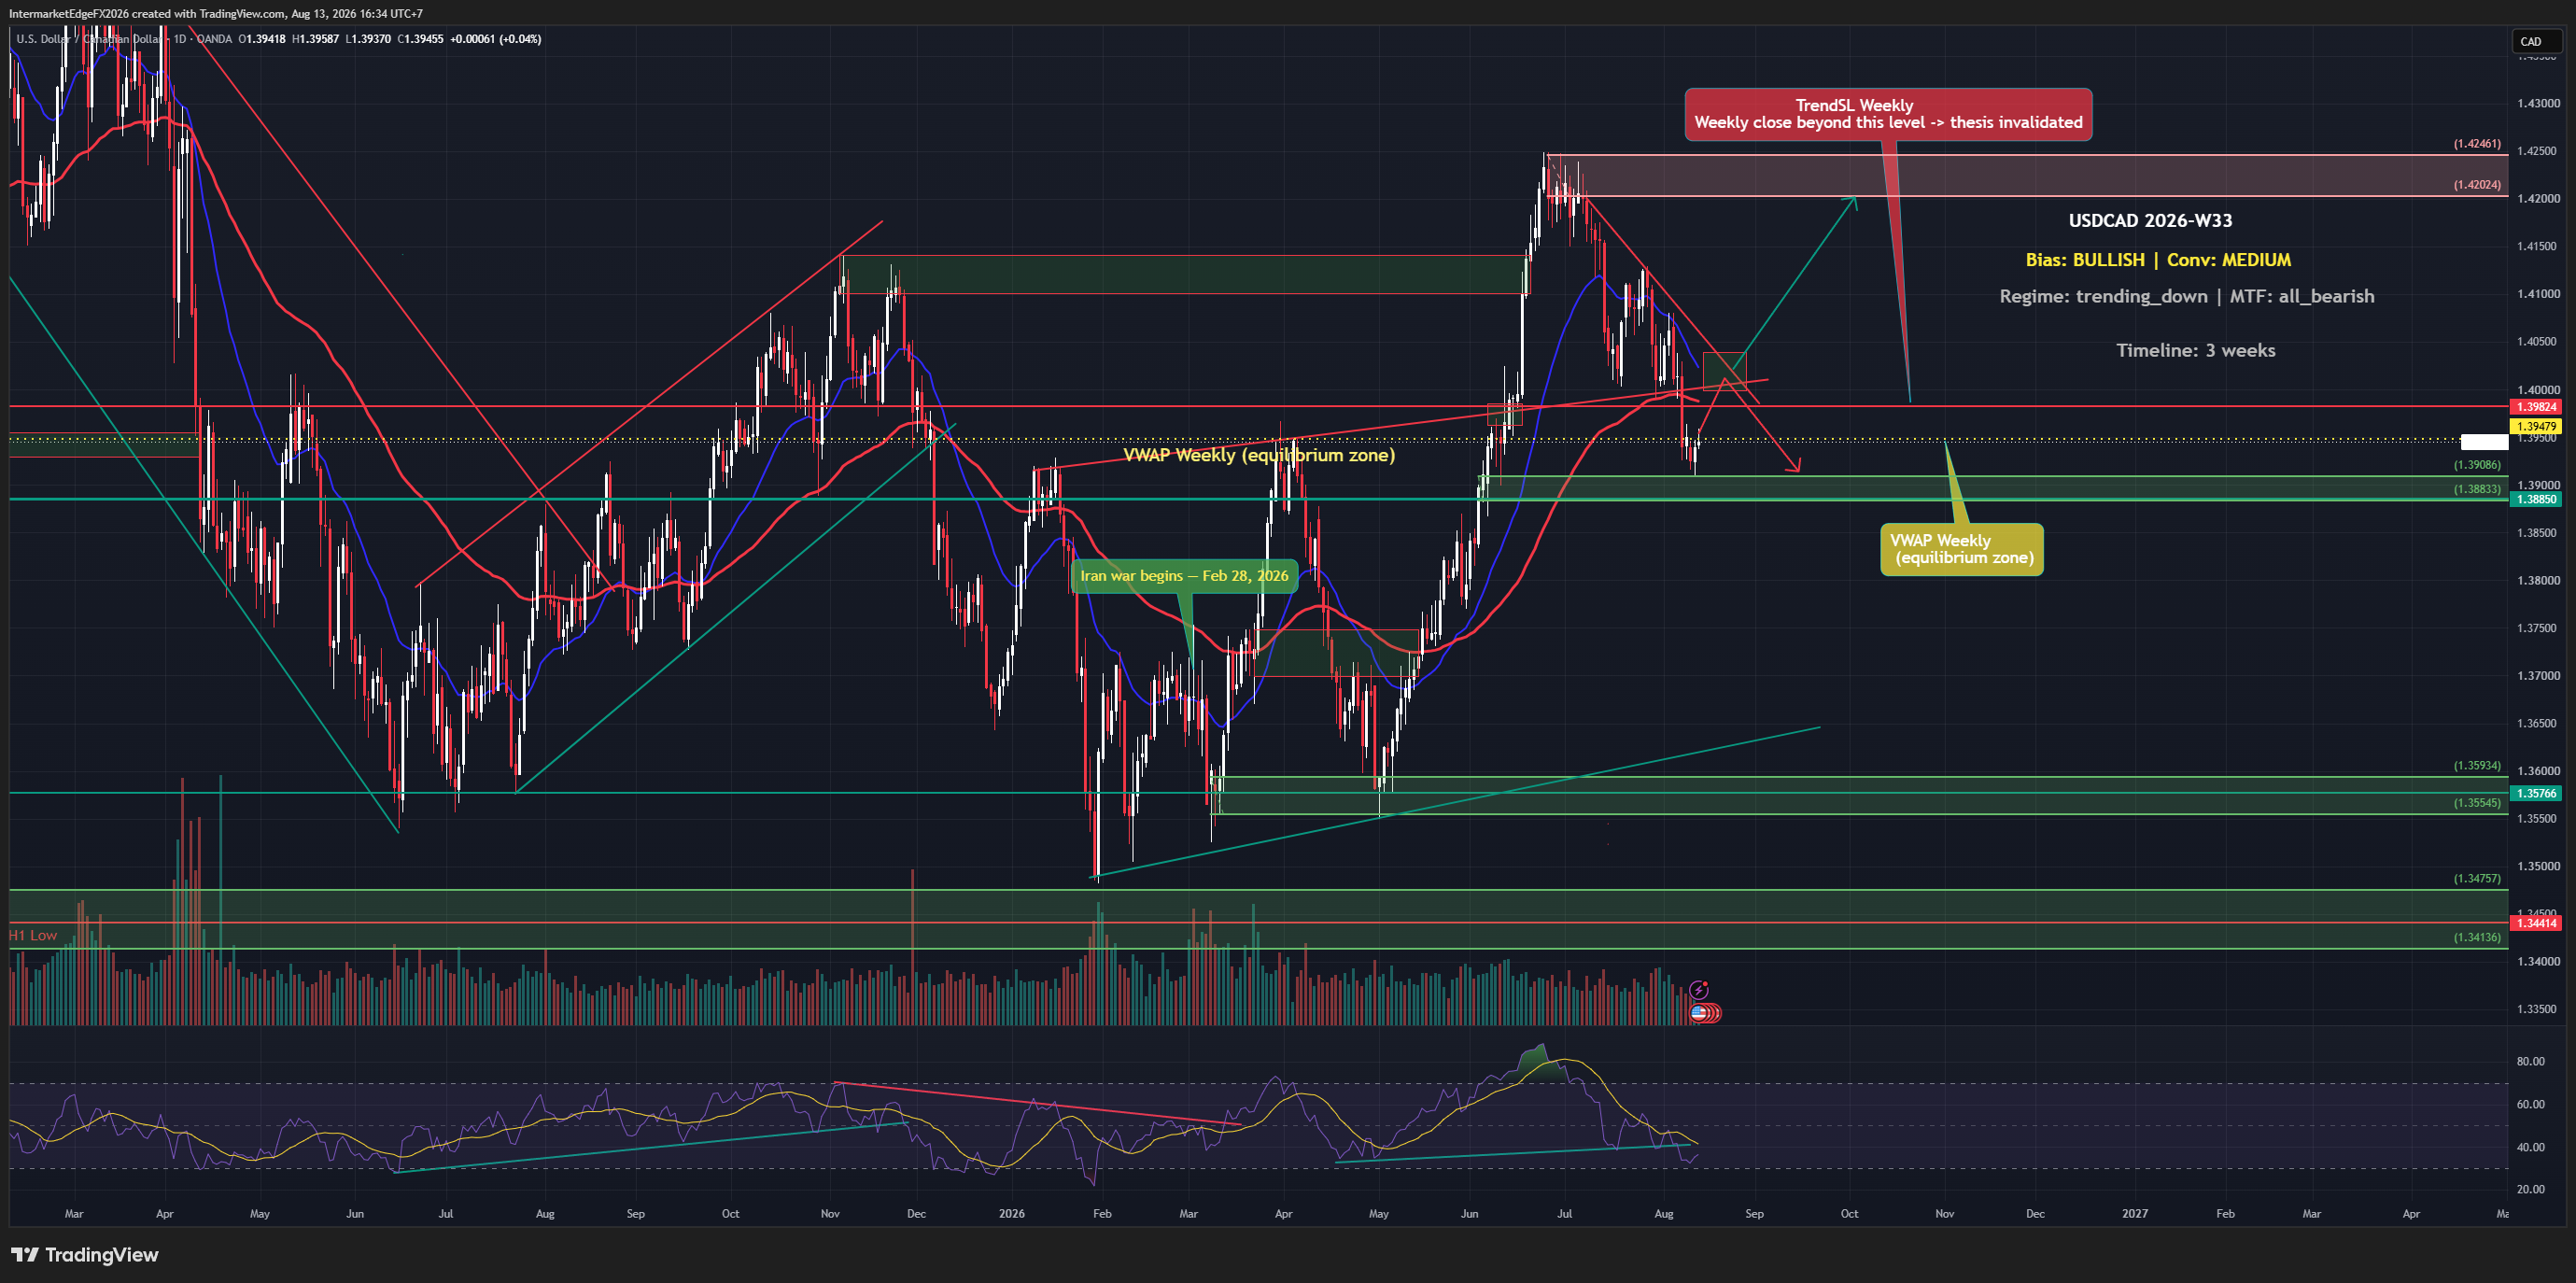
USDCAD carries a bullish bias into Week W33-2026, yet every timeframe is aligned against that label. A core CPI miss, actual 0.0% versus the 0.2% forecast, has already taken pressure off the Fed narrative, and the Canadian dollar hit a two-month high as oil prices rose. The bullish case is real but structurally unconfirmed, and that gap between label and structure is exactly where traders get hurt. The framework carries a bullish bias on USDCAD for the next three weeks at medium conviction, meaning there is a directional view, but the evidence is not strong enough to treat it as a high-confidence positioning decision. The core argument rests on two pillars: Fed hawkishness anchored by elevated real yields, and a persistent rate differential that historically favours USD over CAD. Those fundamentals have not collapsed; they have simply been pressured by this week's inflation data and Canadian-specific positive news flow. What makes this setup genuinely difficult is a structural contradiction that was present from the moment the thesis was generated: the reference price at thesis time (1.39479) was already sitting below the weekly trend stop level (1.39824). That means the bullish label was issued without technical confirmation behind it, the trend structure was already contradicting the directional call. Traders should treat this as a low-confidence rule-engine override, not a textbook bullish setup. Compounding this, COT data shows speculator positioning is at extreme short levels, a condition called crowding risk, which refers to the danger that when too many traders are on the same side, any reversal can be violent and self-reinforcing as they all exit simultaneously. That crowding raises the probability of a short squeeze (a rapid covering rally driven by stop-loss orders rather than genuine demand) that could temporarily push USDCAD lower even as the fundamental bias points higher. -- Intermarket Edge (Note: COT (Commitment of Traders) data is released weekly

USDCAD Week W32-2026: Canadian Dollar Hits Six-Day Low as Oil Drops and Dollar Steadies Near 1.40665, but Bearish DXY Bias Keeps the Bull Case Fragile

USDCAD Week W32-2026: Canadian Dollar Hits Six-Day Low as Oil Drops and Dollar Steadies Near 1.40665, but Bearish DXY Bias Keeps the Bull Case Fragile

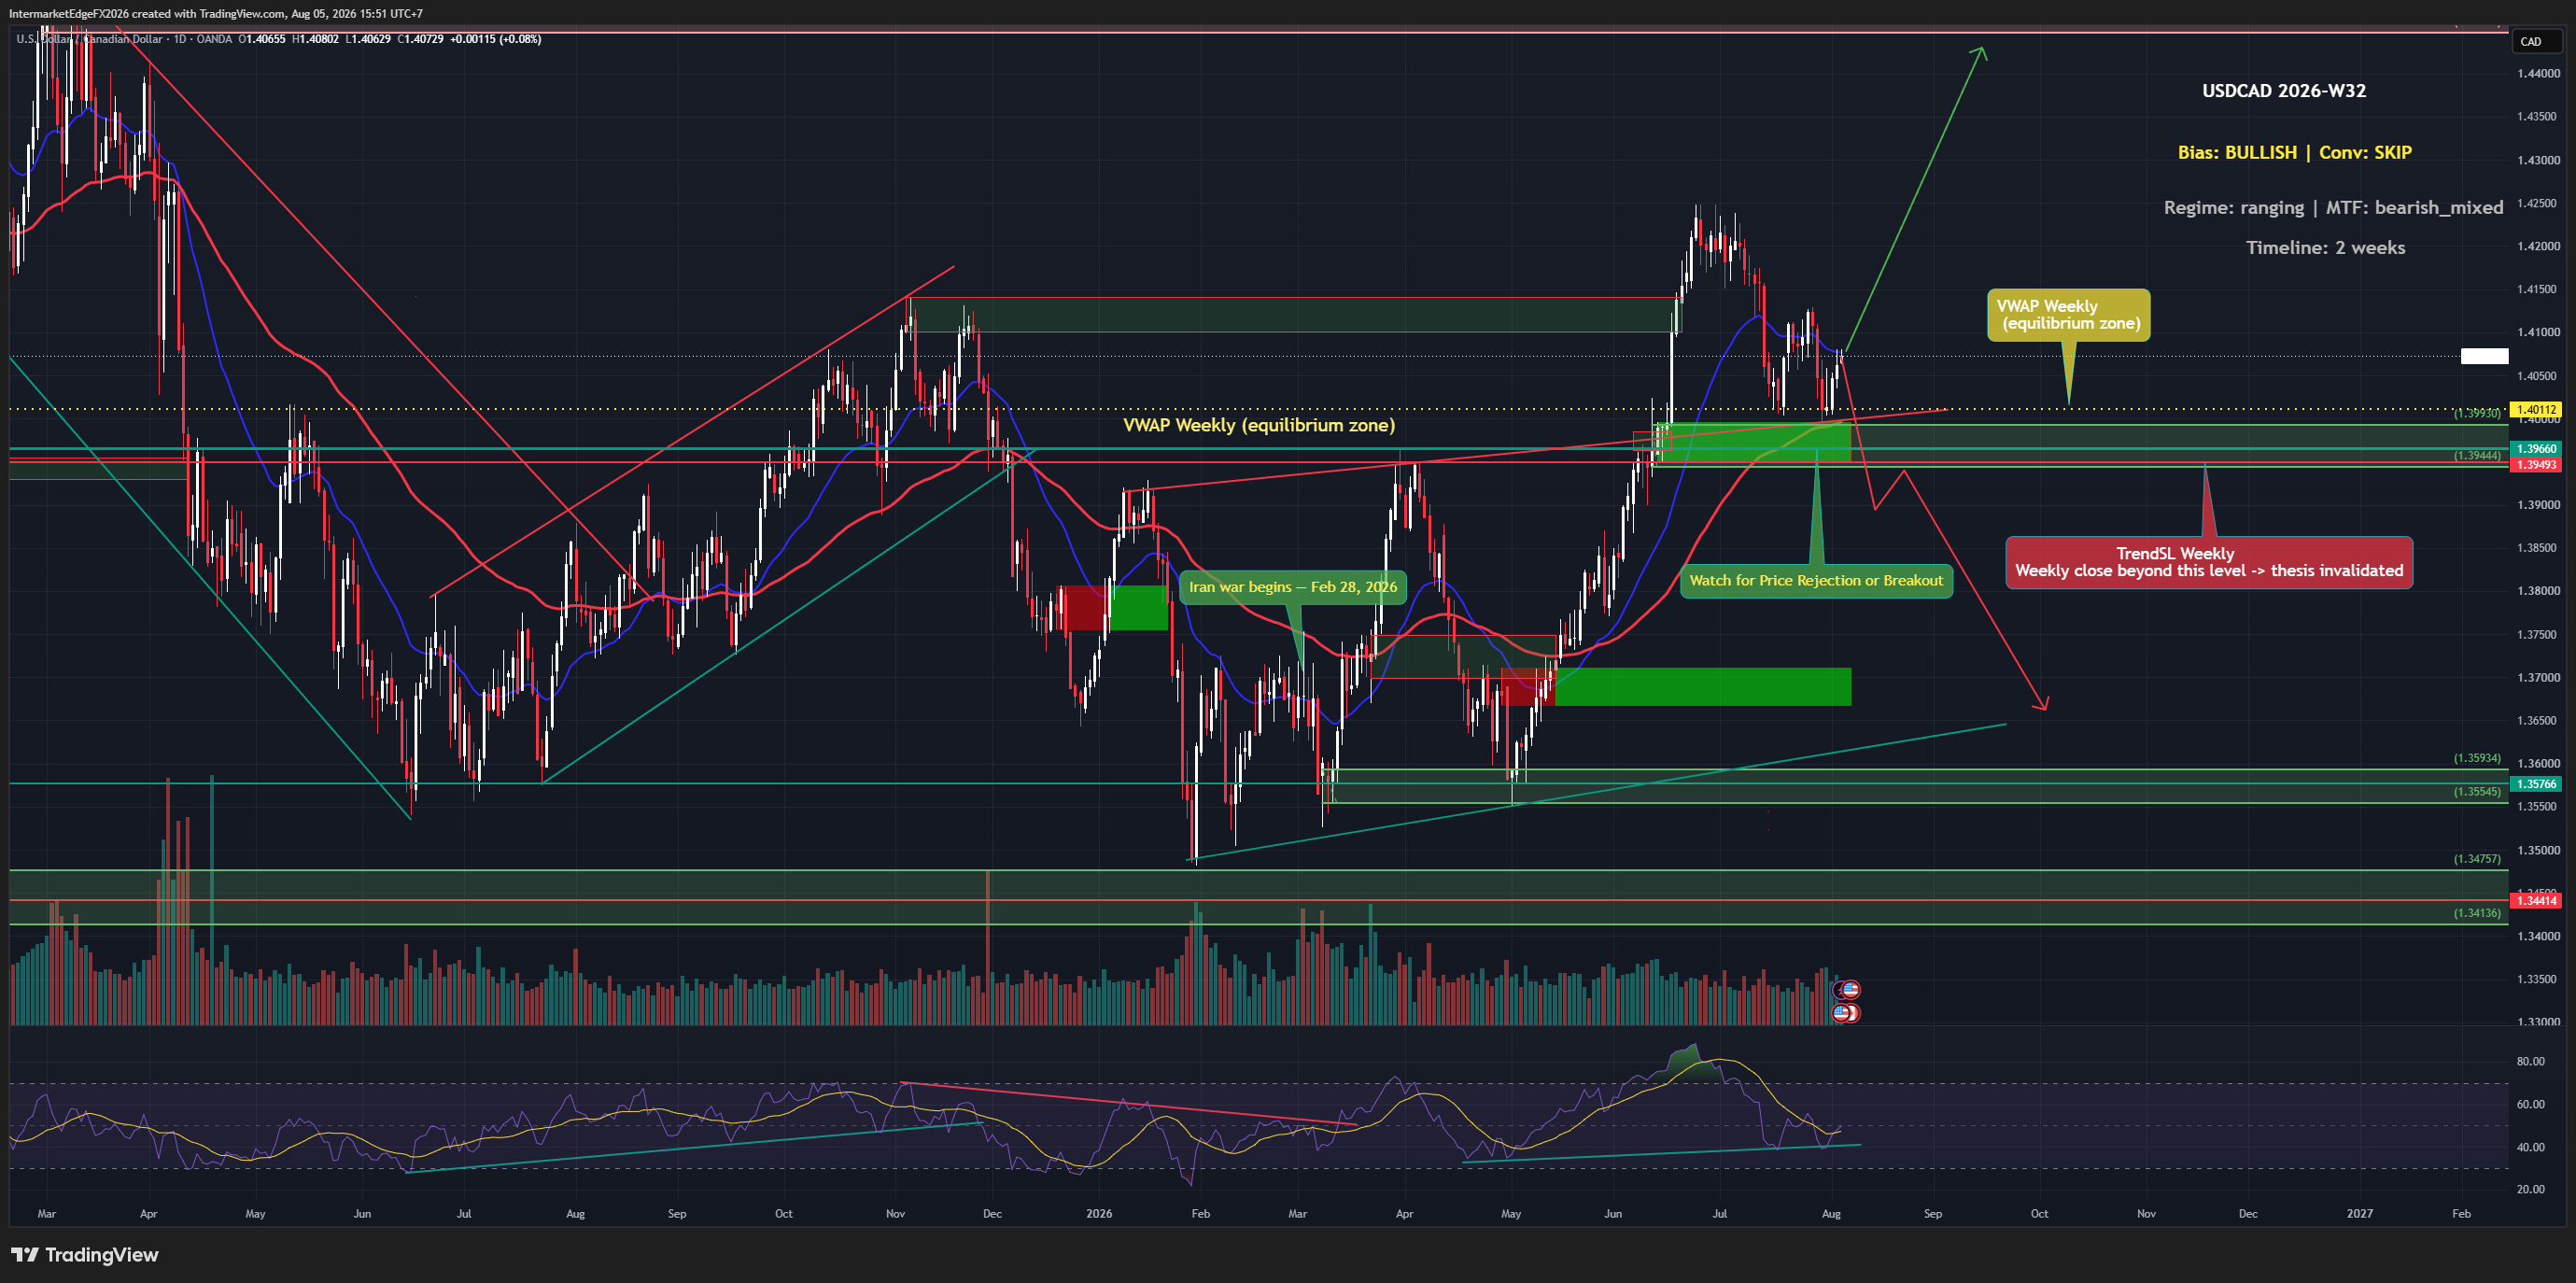
USDCAD is trading at 1.40665 as of Wednesday, 05 August 2026 at 08:31 UTC, holding above its weekly VWAP of 1.40112 even as the broader dollar faces pressure from Yen intervention spillover and Middle East-driven risk sentiment. The Canadian dollar recently hit a six-day low as oil prices dropped, lending short-term support to the pair. The bullish bias this week is real but fragile, conviction is low, the regime is ranging, and the macro case rests almost entirely on Fed hawkishness and rising real yields rather than any confirmed price-action breakout. The directional bias for USDCAD in Week W32-2026 is bullish, but conviction is low, a designation that carries real practical meaning for position sizing and risk management. The two active drivers supporting the upside case are COT positioning, which is skewed bullish (note: the brief does not specify the exact report week, net-position figure, or release date for this COT reading, so it should be treated as directional evidence rather than a standalone statistic), and macro fundamentals, specifically the Fed's hawkish stance and rising US real yields. The causal chain runs as follows: a hawkish Fed holding rates elevated or signaling further tightening pushes US real yields higher, which widens the rate differential between USD and CAD, making dollar-denominated assets relatively more attractive and supporting USDCAD. This is a coherent and well-established transmission mechanism in FX. However, the bullish case has a critical structural weakness: price action itself is not confirming the thesis. Momentum, liquidity, and sentiment signals are all neutral this week, meaning the market is not yet pricing in the macro story with any conviction. The multi-timeframe alignment is bearish-mixed, which is a direct caution flag, lower timeframes are not aligned with the weekly directional call. -- Intermarket Edge

USDCAD - Wave 4 Recovers From a Deeper-Than-Expected Pullback, Price Retests the 1.4174 Decision Zone Ahead of Wave 5 Toward 1.4447-1.4540

USDCAD - Wave 4 Recovers From a Deeper-Than-Expected Pullback, Price Retests the 1.4174 Decision Zone Ahead of Wave 5 Toward 1.4447-1.4540

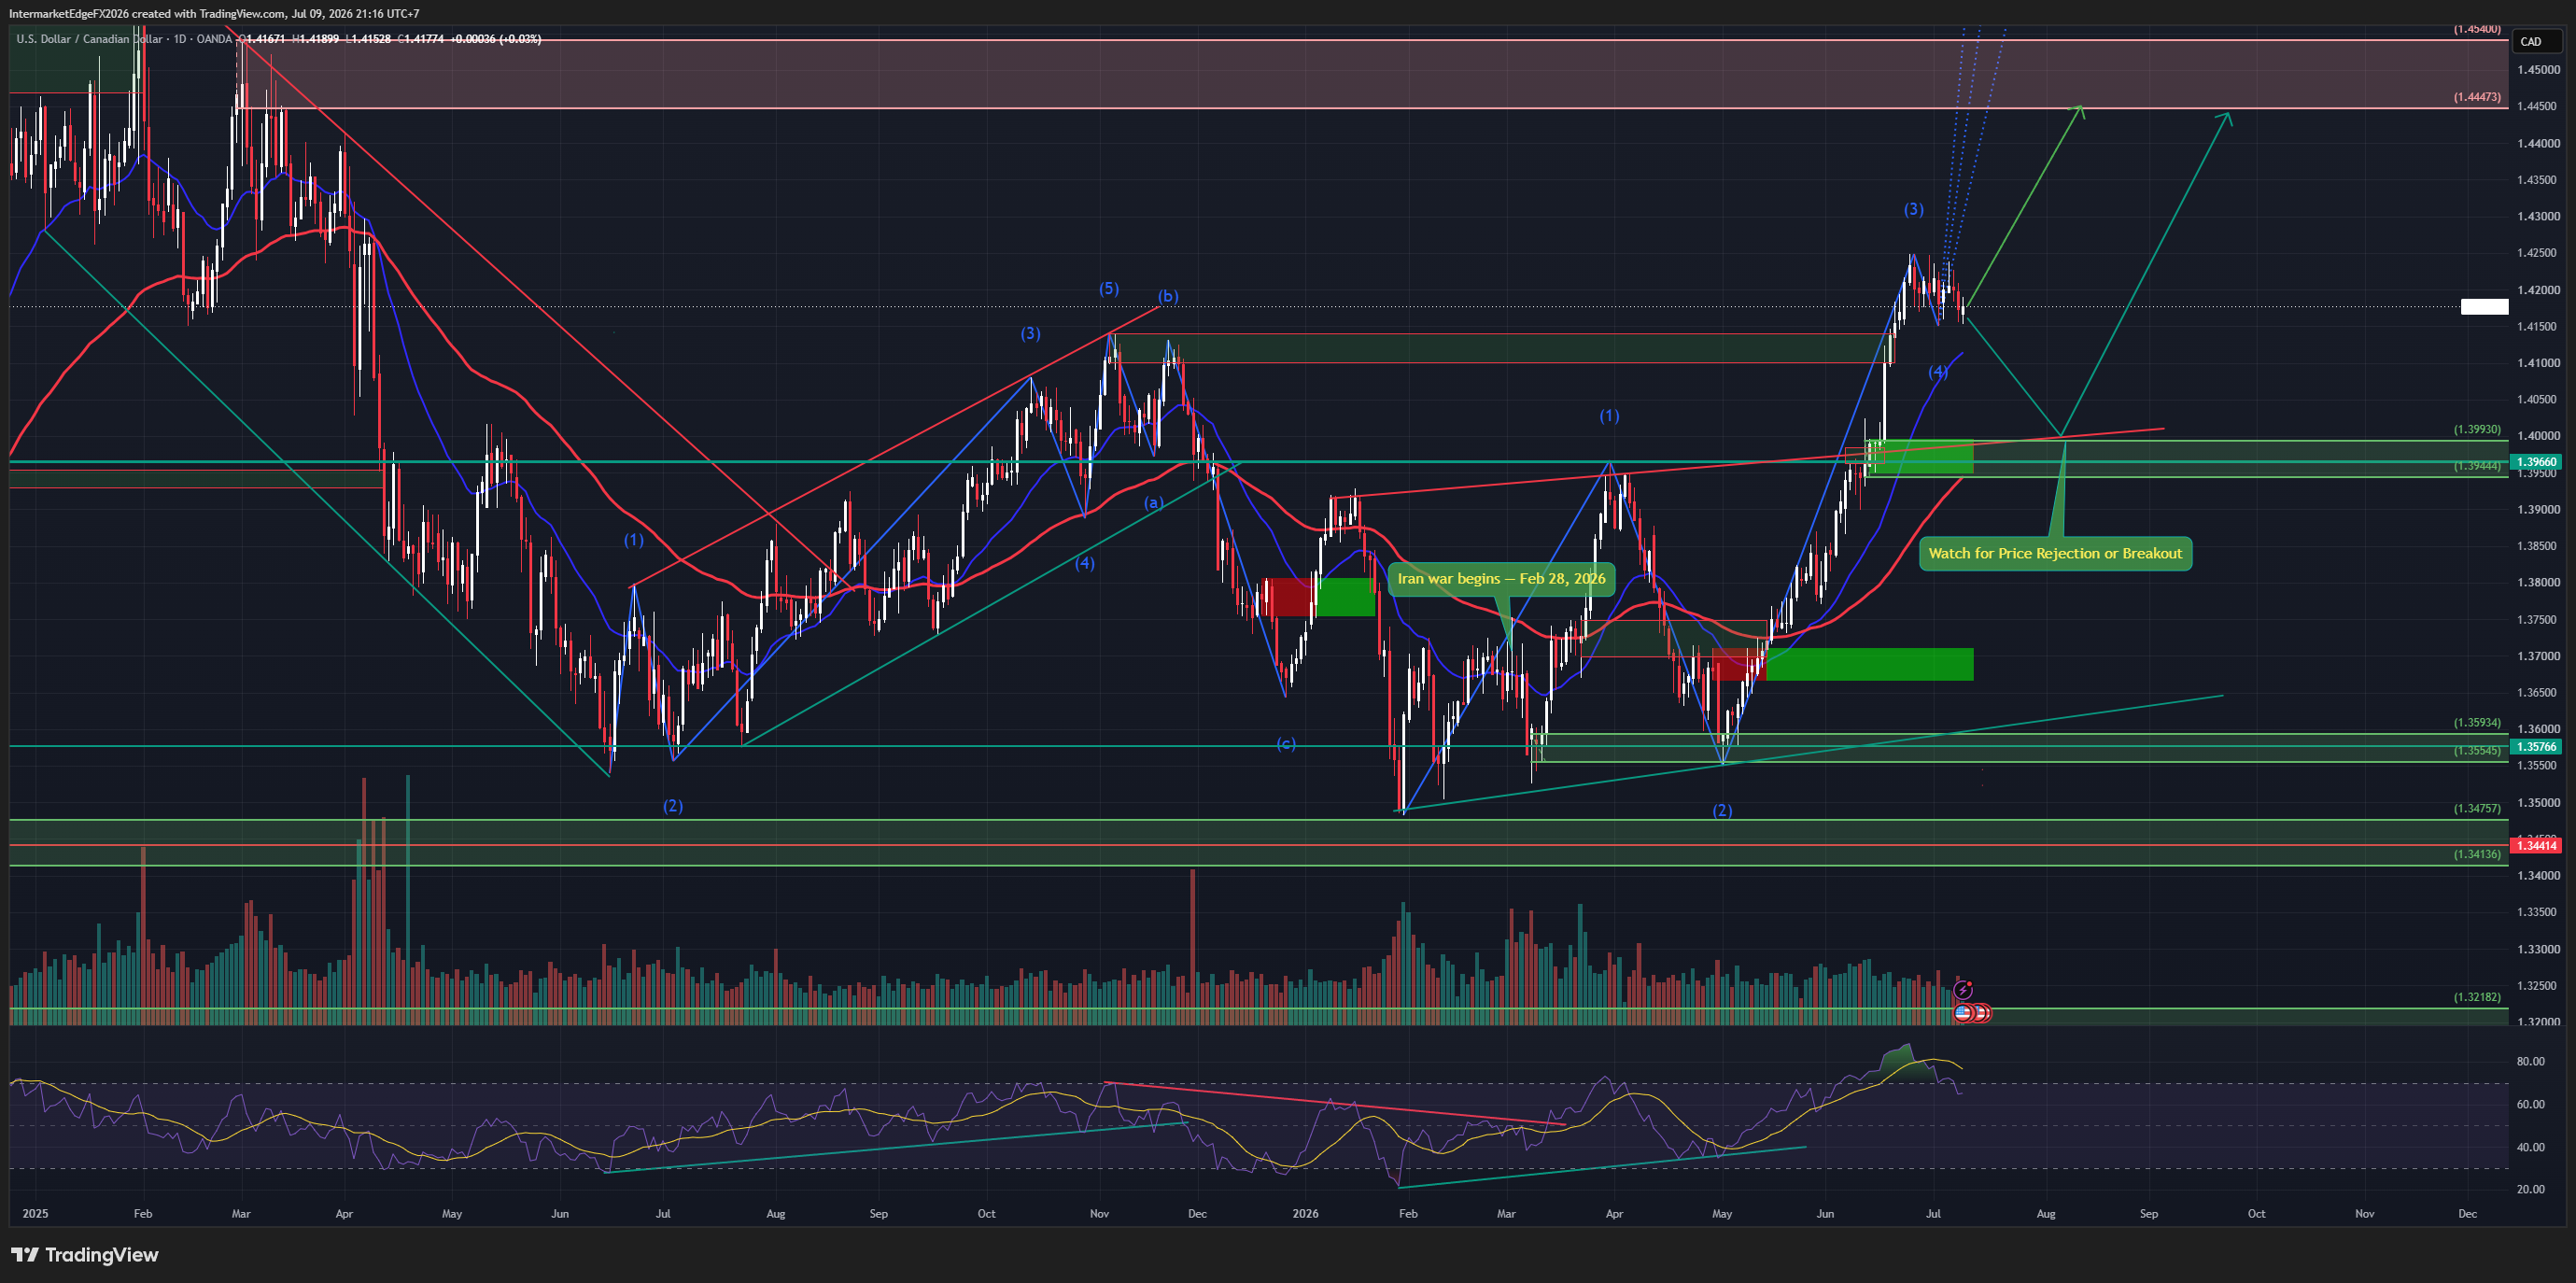
USDCAD - SUMMARY 09/07/2026 Regime: Wave 4 completed a deeper-than-expected correction (1.394-1.397 instead of 1.415-1.417), now recovering to retest the 1.415-1.417 pivot from above. Medium-High Bull unchanged. Bias: Medium-High Bull. New factors: sharp two-way oil volatility from Iran (detailed in the USOIL piece), down 2.85% today creating near-term weak-CAD pressure. VIX cooling for 3 straight days (18.4 → 17.47 → 16.45). BoC's Macklem shifted mixed-to-hawkish. Data corrections: US2Y 4.18% (not 3.693%); US CPI 4.2% (not 2.4%). D1 structure: wave (3) peaked ~1.42 on target, wave (4) fell deeper than expected to 1.394-1.397, now recovering to retest the 1.415-1.417 pivot. Wave (5) target: 1.4447 then 1.4540. Invalidation below 1.400. Scenarios: holds and continues toward 1.4447-1.4540 (40%); range 1.400-1.420 pending confirmation (40%); break below 1.400 invalidating the thesis (20%). No confirmed date/time yet for the FOMC minutes despite newsflow noting market attention. For informational purposes only, not investment advice.

USOIL - Below $71 Confirms the War Premium Fully Erased, Persian Gulf Flows Accelerate as the Market Shrugs Off a -6M Draw

USOIL - Below $71 Confirms the War Premium Fully Erased, Persian Gulf Flows Accelerate as the Market Shrugs Off a -6M Draw

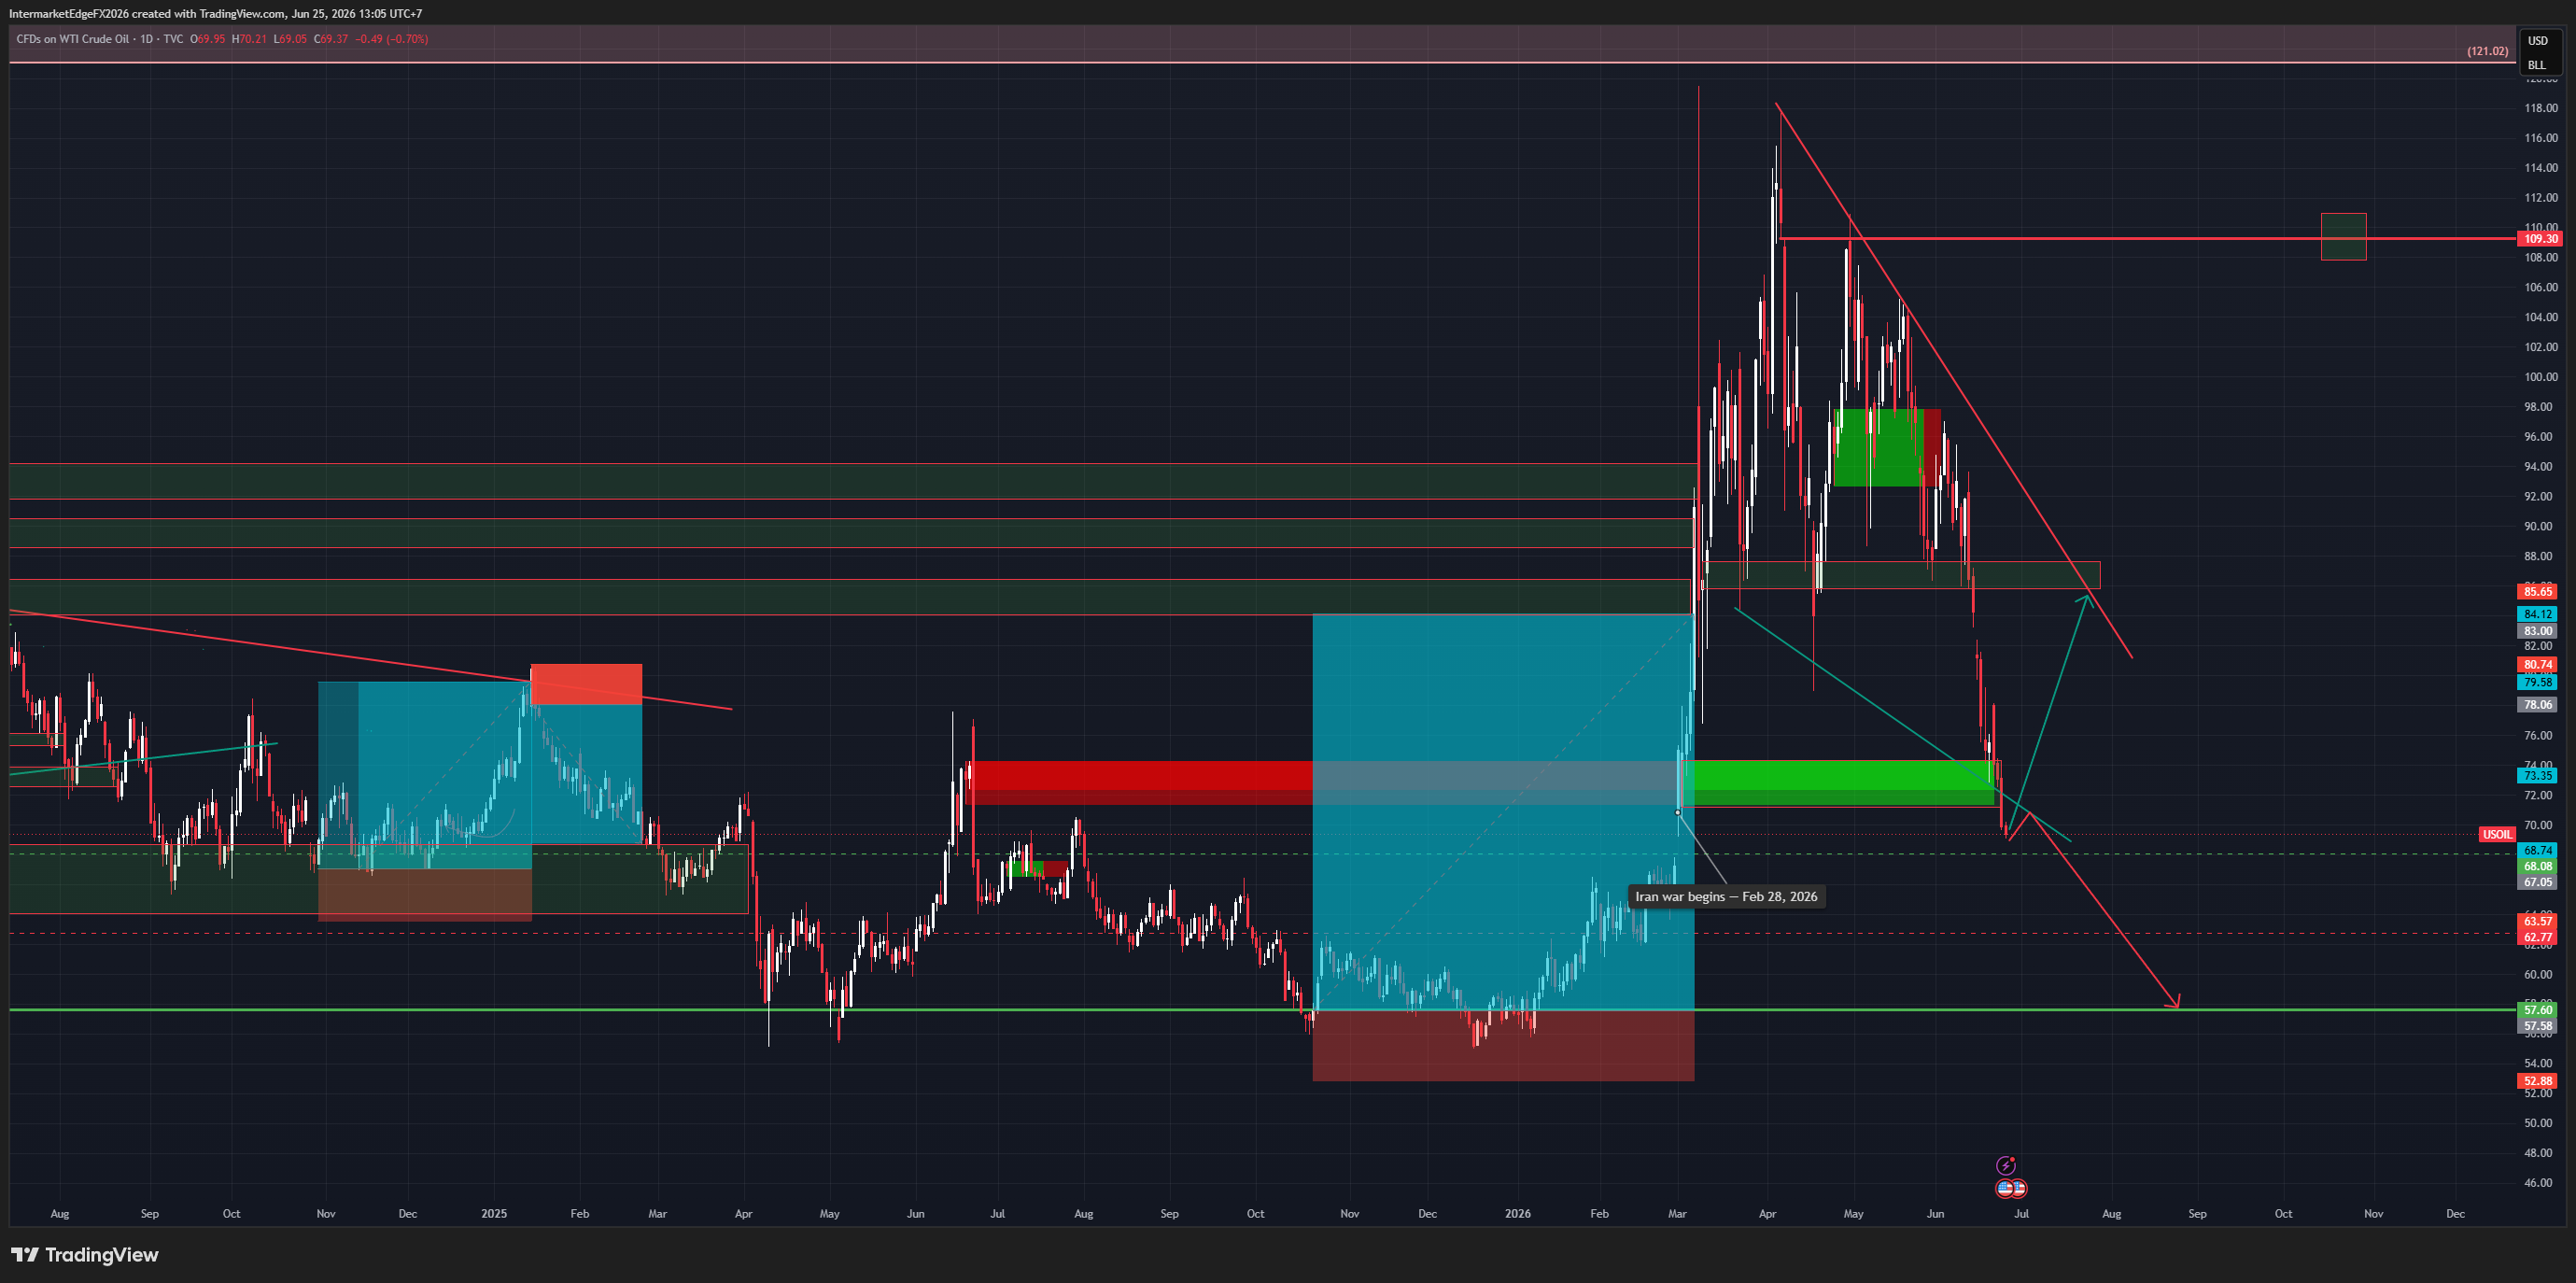
USOIL $69.36 | Below $71, war premium fully erased | 25 June 2026 Last week: "Do not chase shorts into 71.11. A break confirms a further leg, target 67 then 63." It broke. Oil now $69.36, below the pre-war starting point. The most notable signal: the EIA drew 6.088M (forecast just 3.9M), the second consecutive larger-than-expected draw. The market shrugged it off entirely. Oil kept falling. When good news is ignored, the selling force dominates. Three forces: Persian Gulf flows accelerating as Hormuz reopens; global supply recovering + OPEC+ +411kbpd; DXY 101 at a 13-month high. Leading headlines: "Oil Sinks Toward Pre-War Levels", "Crude Oil Falls Below $70", "Oil Market Shrugs Off Large Crude Stock Draw." D1 structure: 71.11 broken (now resistance). Nearby support 67.05 then 63.57 then 62.77. Deep: 57.60 (pre-war bottom). Invalidation: daily close above 74.49. Three scenarios: → Continued decline to 67.05 then 63.57. Probability: 45% → Hormuz fully reopens, accelerates to 57.60. Probability: 25% → Technical bounce to test 71.11 (broken support), resumes lower. Probability: 20% The tell: two consecutive bullish draws, price still falls. The market has answered. Conviction: High Bear (upgraded from Medium Bear). --- Intermarket Edge | Institutional Macro & Intermarket Analysis For informational purposes only. Not financial advice.

USDCAD - Wave (3) Impulse on Post-FOMC Dollar Strength, CAD at a 7-Month Low, a Wave (4) Pullback Sets Up the Wave (5) Push Toward 1.45

USDCAD - Wave (3) Impulse on Post-FOMC Dollar Strength, CAD at a 7-Month Low, a Wave (4) Pullback Sets Up the Wave (5) Push Toward 1.45

USDCAD 1.4115 | Wave (3) impulse on post-FOMC dollar strength | 18 June 2026 Two currencies moving in opposite directions met in one pair: the Fed projected a hike, and the Canadian dollar hit a 7-month low. The wave count says the big move hasn't started yet. USD leg: the FOMC on 17/06 held rates but projected a hike later in 2026 -- a hawkish dot plot. The dollar extended gains, DXY to a two-month high near 100.6. EUR/GBP/AUD all falling, confirming broad USD strength. CAD leg: the Canadian dollar at a 7-month low (newsfeed: "Canadian Dollar Hits 7-Month Low"). Crude ticked up to 74.46 but stays low after the war premium unwound -- pressure on CAD. The pipeline showed you the wrong numbers. Fed pipeline: "Hold 2026, hike Apr 2027." Actual: hold + projected hike later 2026 (hawkish, done). Pipeline CPI US 2.4%. Actual 4.2%, real yield 0.263%. D1 structure: a bullish Elliott impulse. (1) ~1.38, (2) ~1.347, (3) now ~1.414. Price at 1.4115, just below the 1.41388 resistance. The chart expects a wave (4) pullback to the fib region 1.39 (0.382) / 1.385 (0.5) / 1.378 (0.618), pivot 1.39660. Then wave (5) up to 1.44473 → 1.45400. Three scenarios: → Wave (4) to 1.39-1.385 then wave (5) up to 1.44473. Probability: 40% → Direct break above 1.41388 toward 1.44473, shallow pullback. Probability: 25% → Deeper wave (4) to 1.378 then resume up. Probability: 20% Invalidation: daily close below 1.347 (early warning: a break of 1.378). The tell: the wave (4) pullback. A hold above 1.378 with the dollar firm keeps the path to 1.45 alive. Position around the 1.39-1.385 fib region rather than chasing at the top. Conviction: Medium-High Bull. --- Intermarket Edge | Institutional Macro & Intermarket Analysis For informational purposes only. Not financial advice.

USDCAD — BoC Fifth Consecutive Hold, Macklem Admits Stagflationary Dilemma, and Oil Rising Is No Longer Bullish for CAD

USDCAD — BoC Fifth Consecutive Hold, Macklem Admits Stagflationary Dilemma, and Oil Rising Is No Longer Bullish for CAD

USDCAD 1.3984 | Oil rising, CAD weakening | 11 June 2026 Oil rose $2.50 today on Iran-Hormuz news. The Canadian dollar weakened. The oil-CAD channel has inverted — and understanding why is the entire analytical framework for this pair right now. The current oil spike is geopolitical risk premium, not demand-driven. Geopolitical oil creates safe-haven dollar demand simultaneously. The dollar safe-haven channel is dominant. Standard oil-CAD heuristic = systematically wrong in this regime. BoC held for the fifth consecutive time at 2.25% on June 10. The language change matters more than the decision. April: "changes can be expected to be small." June: "economic weakness combined with rising inflation is a dilemma." Macklem also explicitly opened the cut door: "we may need to cut further if US trade restrictions intensify." Most dovish BoC forward guidance since the current hold cycle began. Result: BoC in stagflationary paralysis. Fed pricing a hike at 40%. Forward curves diverging further. BoC-Fed differential structural, not just cyclical. AUDCAD at 0.9773 — below 1.000 for 21 consecutive sessions. USMCA discount: structural and persistent. Bull confirmation: daily close above 1.4099. Targets: 1.4099 → 1.4139 → 1.4200. Invalidation: Iran MOU approved. Warsh FOMC June 16-17 is the gating event. Conviction: Medium-High Bull.

USDCAD — Canadian Dollar at Eight-Week Low, BoC Holds June 10, Oil Slides, and USMCA Risk Keeps the Loonie Trapped

USDCAD — Canadian Dollar at Eight-Week Low, BoC Holds June 10, Oil Slides, and USMCA Risk Keeps the Loonie Trapped

USDCAD 1.3893 | Canadian Dollar 8-week low | 04 June 2026 The Canadian dollar is at its weakest in eight weeks, and three forces are keeping it there simultaneously. First, oil. WTI has declined from $95.33 this morning to $92.61 — a $2.72 drop in a single session on Iran deal optimism. Canada is the largest crude exporter to the US. The oil-CAD channel is among the most stable relationships in FX, and it is working against the loonie today. The counterintuitive implication: if the Iran deal completes and oil falls toward $80-85, CAD gets weaker, not stronger. USDCAD could test 1.4099 resistance on deal completion. Second, domestic weakness. Canada's Q1 2026 GDP contracted for a second consecutive quarter. BoC core inflation measures slowed to five-year lows. The Bank of Canada meets June 10 and is expected to hold at 3.25% — but a dovish tone acknowledging the growth weakness would push USDCAD toward 1.4000-1.4050. Third, USMCA risk. AUDCAD at 0.9920 — below the 1.000 parity level — confirms the structural CAD discount from trade uncertainty is still live. Until AUDCAD holds above 1.000, CAD carries a structural discount that cannot be removed by oil alone. On the chart, price is approaching the 1.4099-1.4139 resistance zone. A daily close above 1.4099 confirms the bull move. A daily close below 1.3593 activates wave (c) lower toward 1.3477 then 1.3400. BoC June 10 is the gating event. Conviction: Medium, Mildly Bullish.

Stay in the loop

Get notified about new research, macro insights, and market analysis.

InterMarketEdge

© 2026 InterMarketEdge. Financial intelligence for inter-market traders.