Tag: DXY — InterMarketEdge

Tag: DXY

DXY - Wave (4) Absorbing After Completing a 13-Month High, NFP on 3 July Is the Decisive Catalyst for Wave (5)

DXY - Wave (4) Absorbing After Completing a 13-Month High, NFP on 3 July Is the Decisive Catalyst for Wave (5)

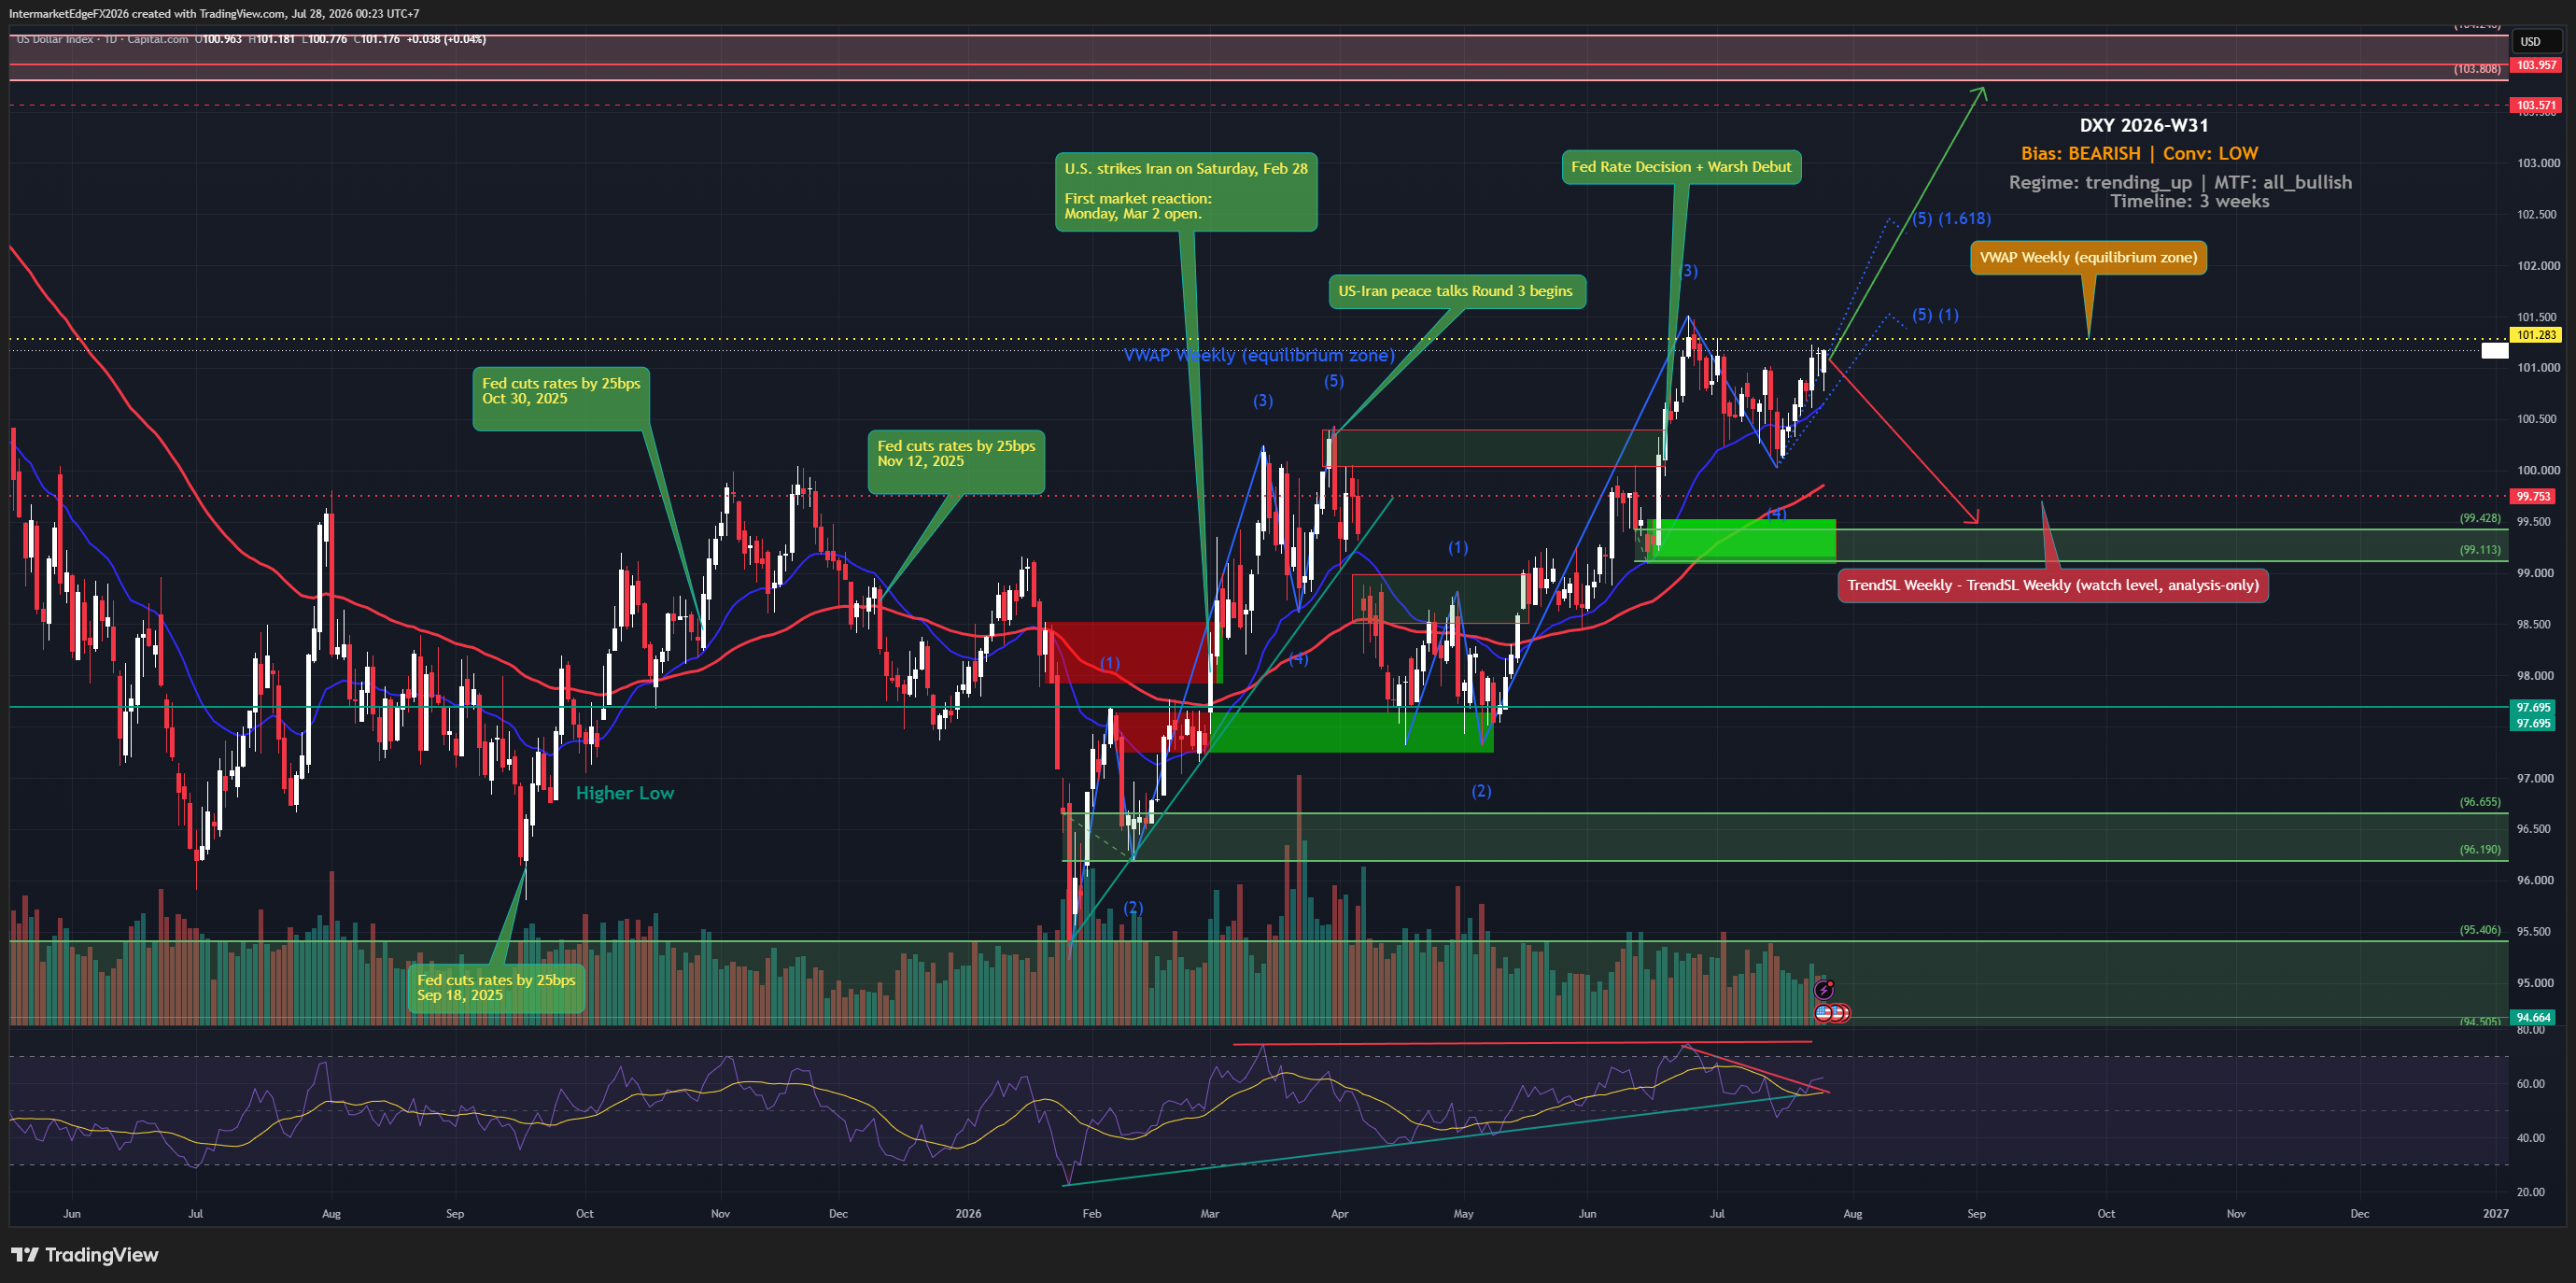
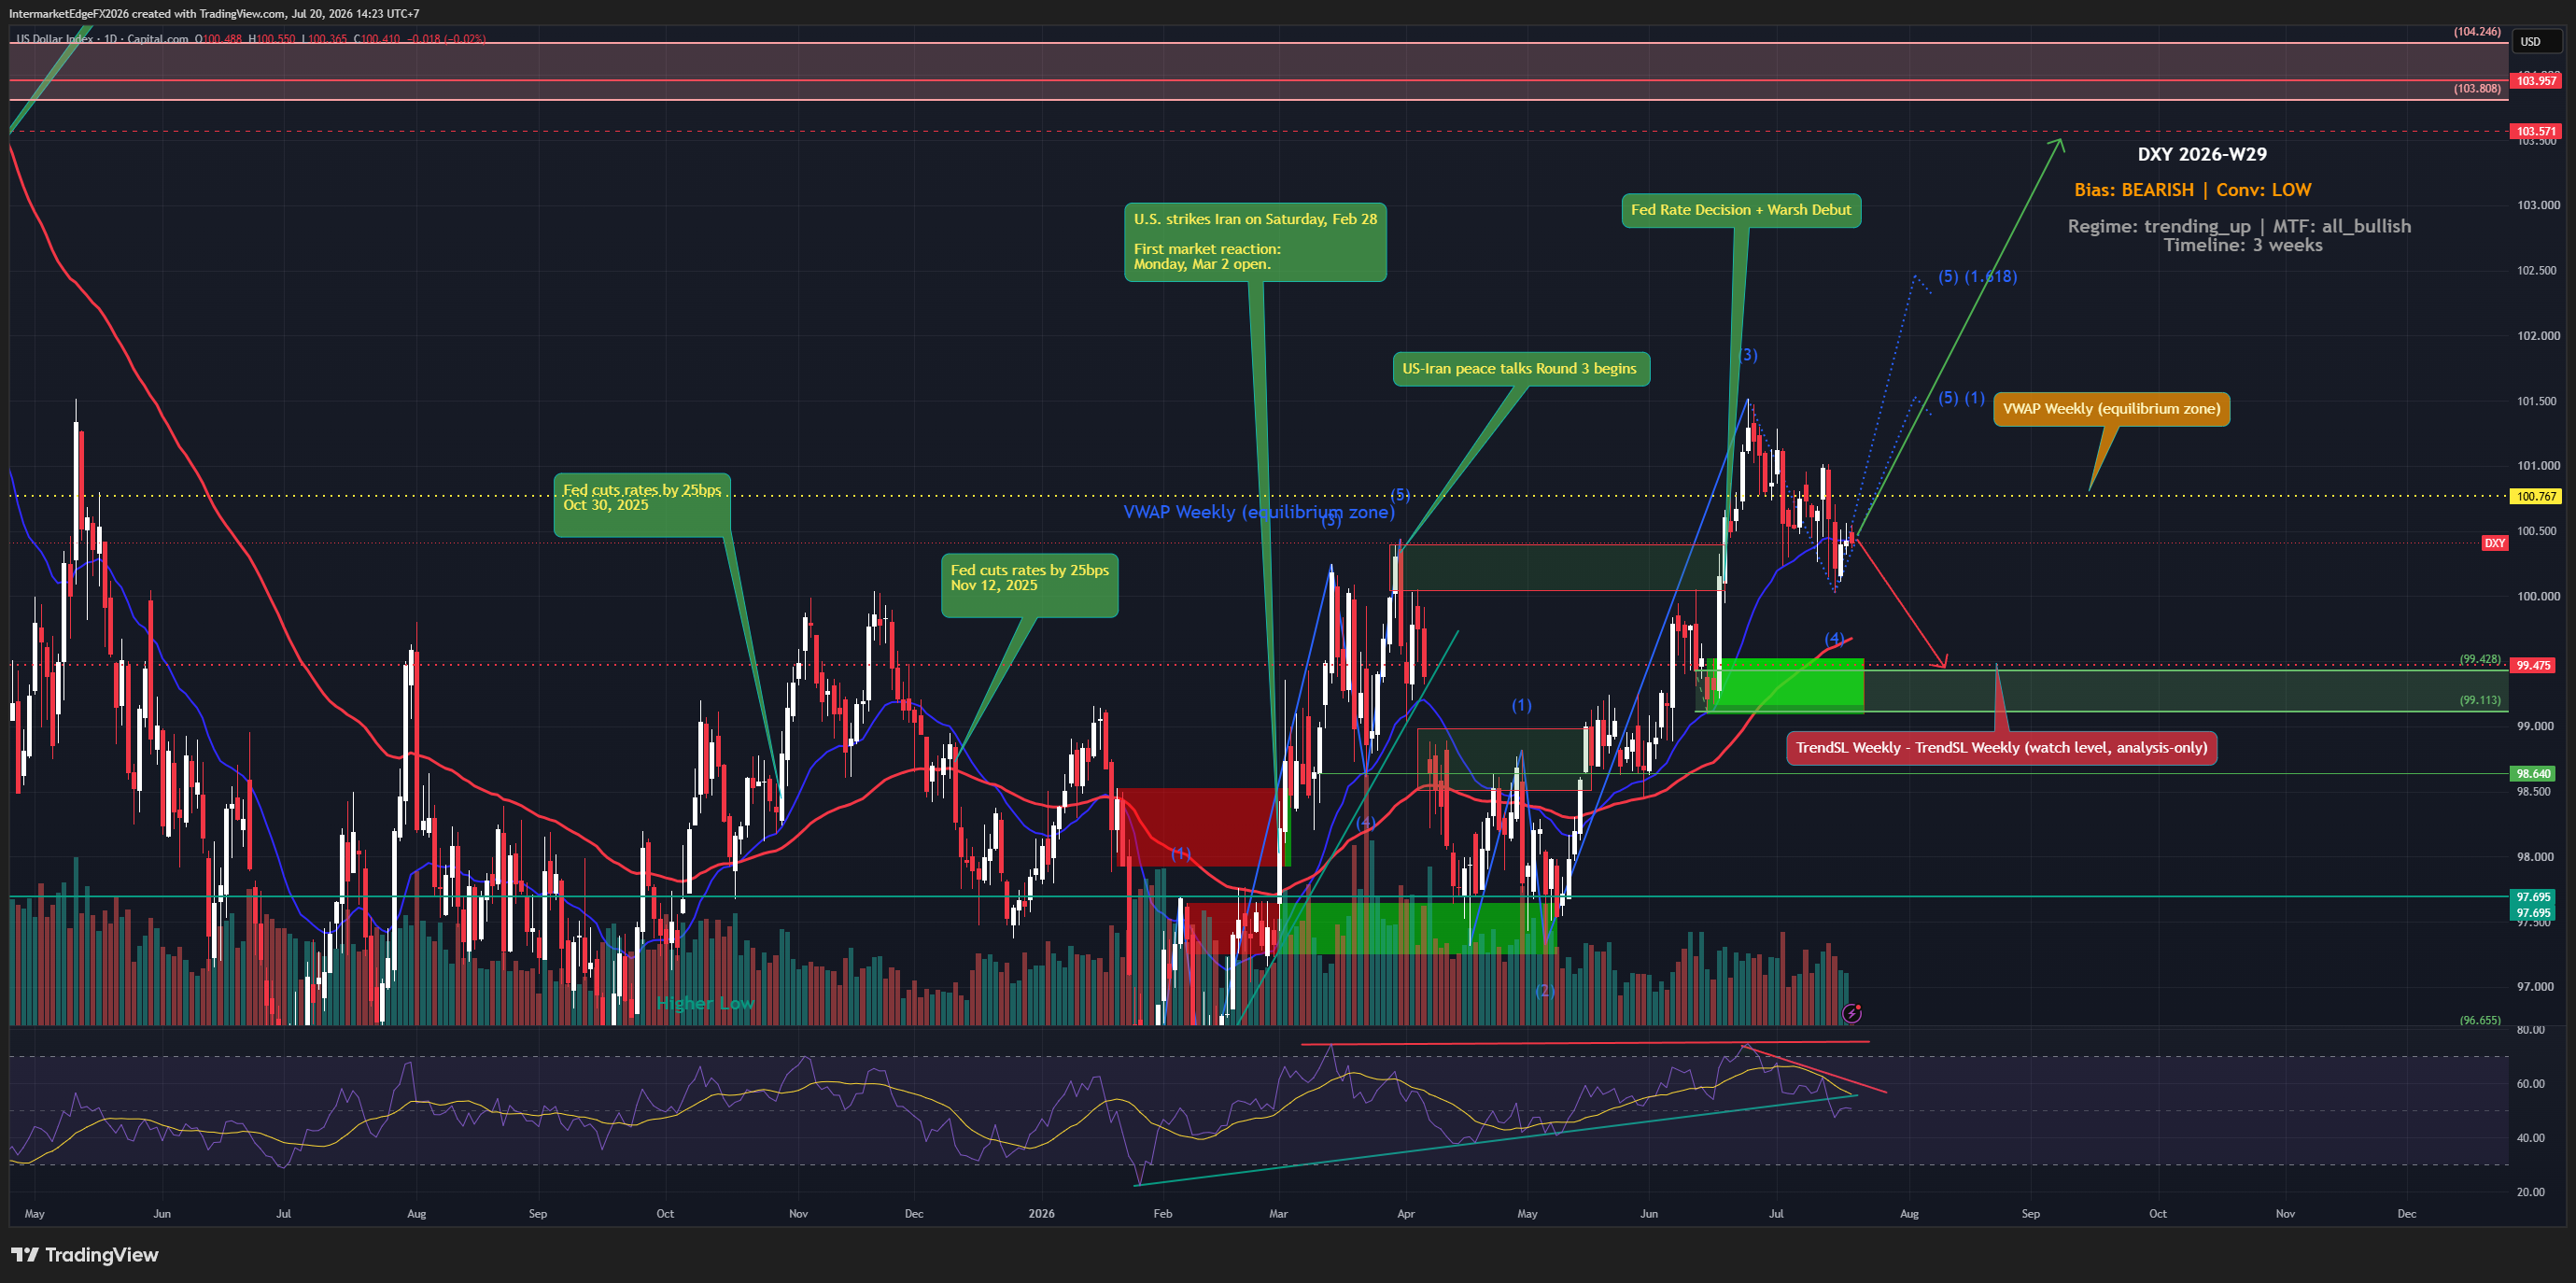
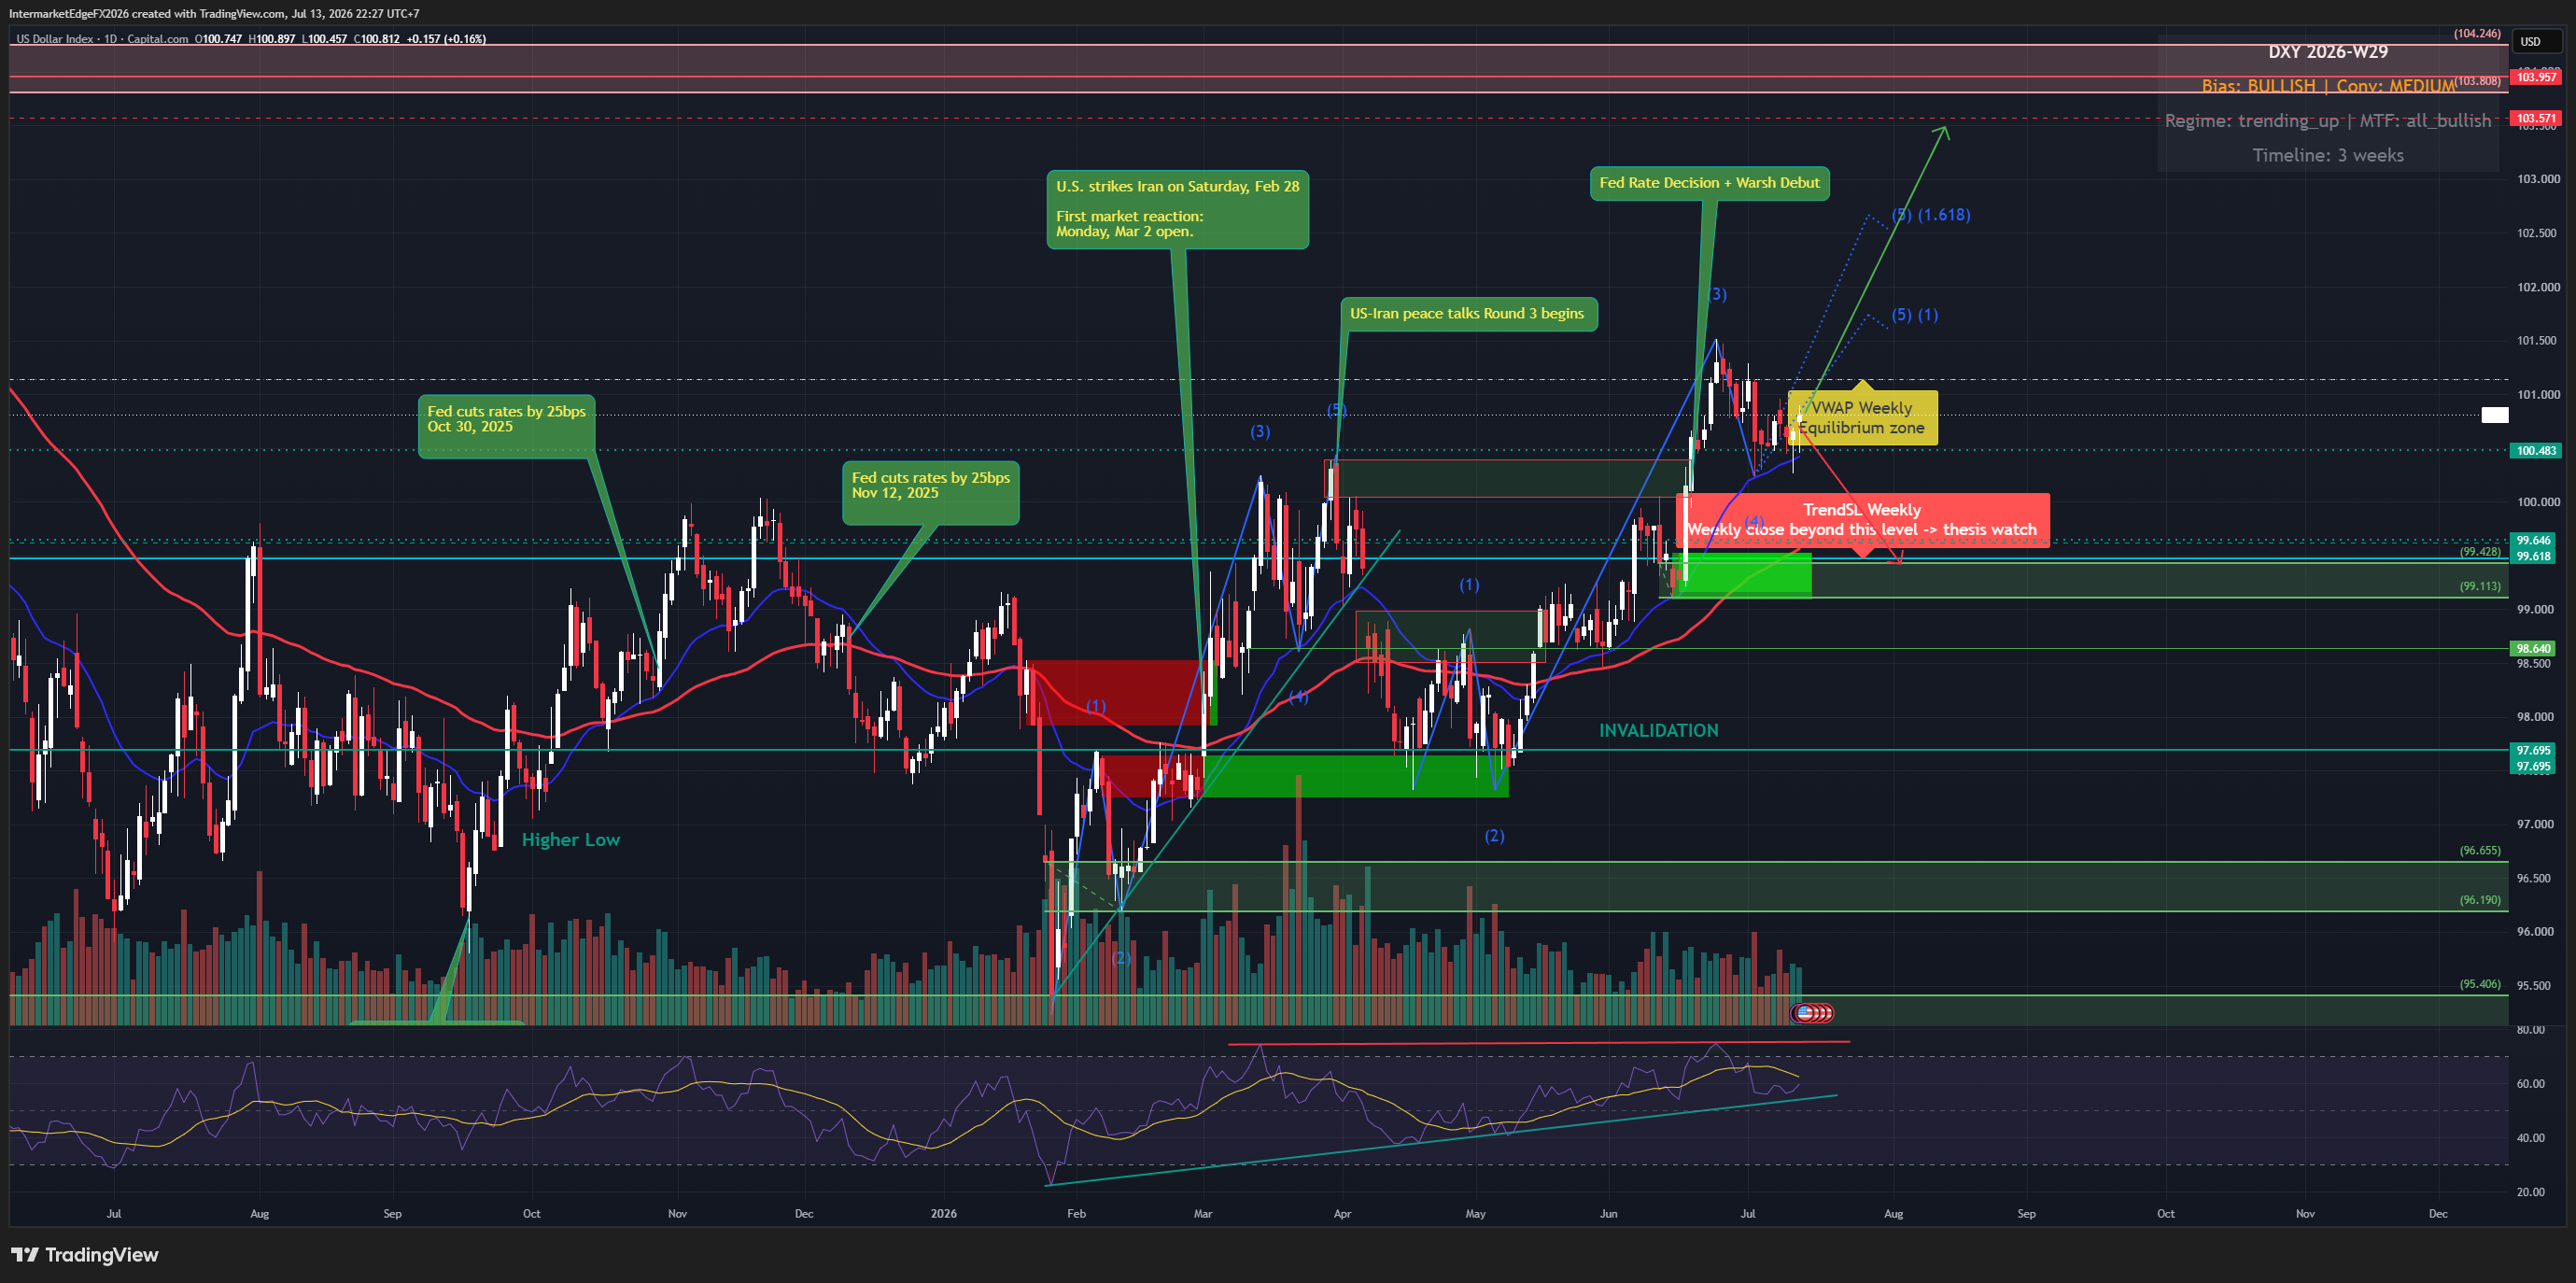
DXY - SUMMARY 29/06/2026 Regime: Wave (4) Absorbing, Neutral Near Term, Bullish Medium Term. DXY 101.019, pulled back from wave (3) high at 104.2 -- a 13-month high -- to 100.6 last week then bounced modestly to 101.0. Elliott five-wave structure intact. Declining volume in the pullback confirms correction, not reversal. Bias: Medium-High Bull medium term. Neutral within current wave (4). Macro foundation: US CPI actual 4.2% (pipeline 2.4% stale), Fed Warsh hawkish hold, rate differential +225bps vs EUR (ECB 2.00% neutral hold), +325bps vs JPY (BoJ 1.00%). US10Y 4.372%, yield curve steepening +27bps, real yield +0.172%. Data corrections: JP10Y 2.63% (not 1.47%); US-JP spread 1.742% (not 2.924%); DE10Y 2.85% (not 2.99%); ECB neutral 2.00% (not cutting 2.50%). D1 structure: wave (4) absorption zone 99.6 (Fib 0.382) to 99.1 (Fib 0.5). Resistance: 101.5 / 102.0 / 102.5. Support: 100.48 (Higher Low) / 99.6 / 99.1 / 98.0. Wave (5) target 103-104.5. Extended: 106. Invalidation: 97.695. Scenarios: test 99.6-99.1 then wave (5) 103-104.5 (60%); low already printed at 100.6, break of 102.0 = early wave (5) (30%); NFP miss, below 98 (10%). Event risk: Chicago PMI 30 June, ADP 1 July, NFP 3 July -- decisive catalyst. Above 220K = early wave (5) trigger. Do not chase before NFP. For informational purposes only. Not financial advice.

USDCAD - CAD Hits a 14-Month Low as Oil Breaks Below $70 and DXY Holds a 13-Month High, a Double Squeeze Drives Wave (3) Toward 1.4447

USDCAD - CAD Hits a 14-Month Low as Oil Breaks Below $70 and DXY Holds a 13-Month High, a Double Squeeze Drives Wave (3) Toward 1.4447

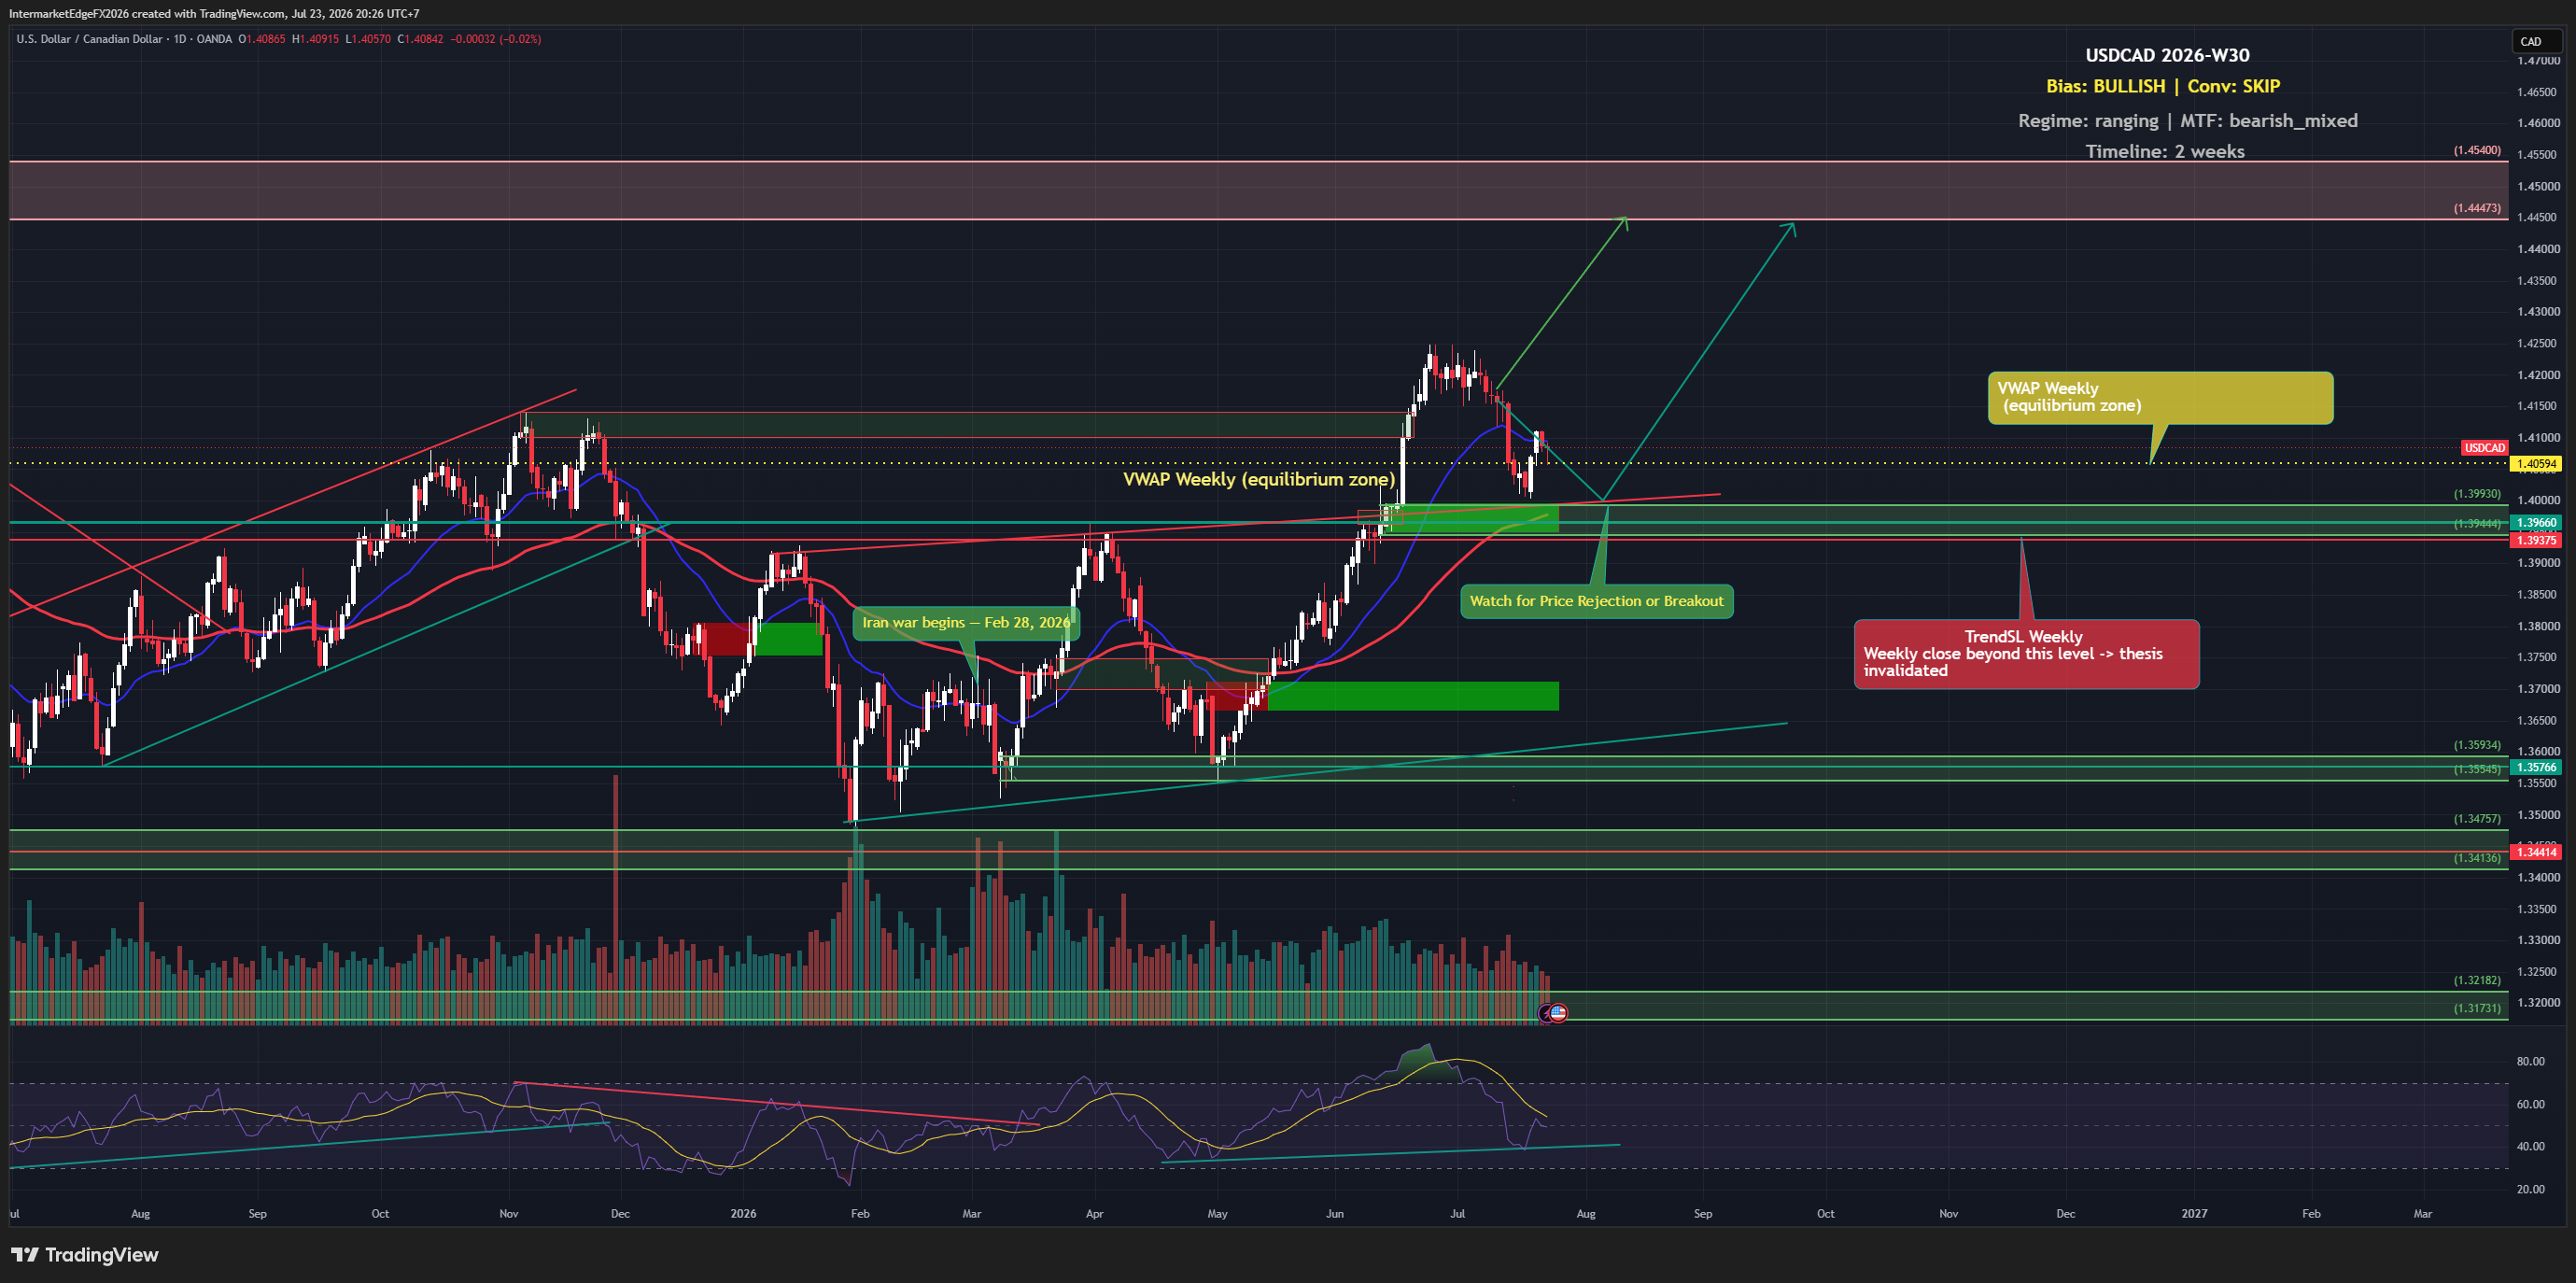
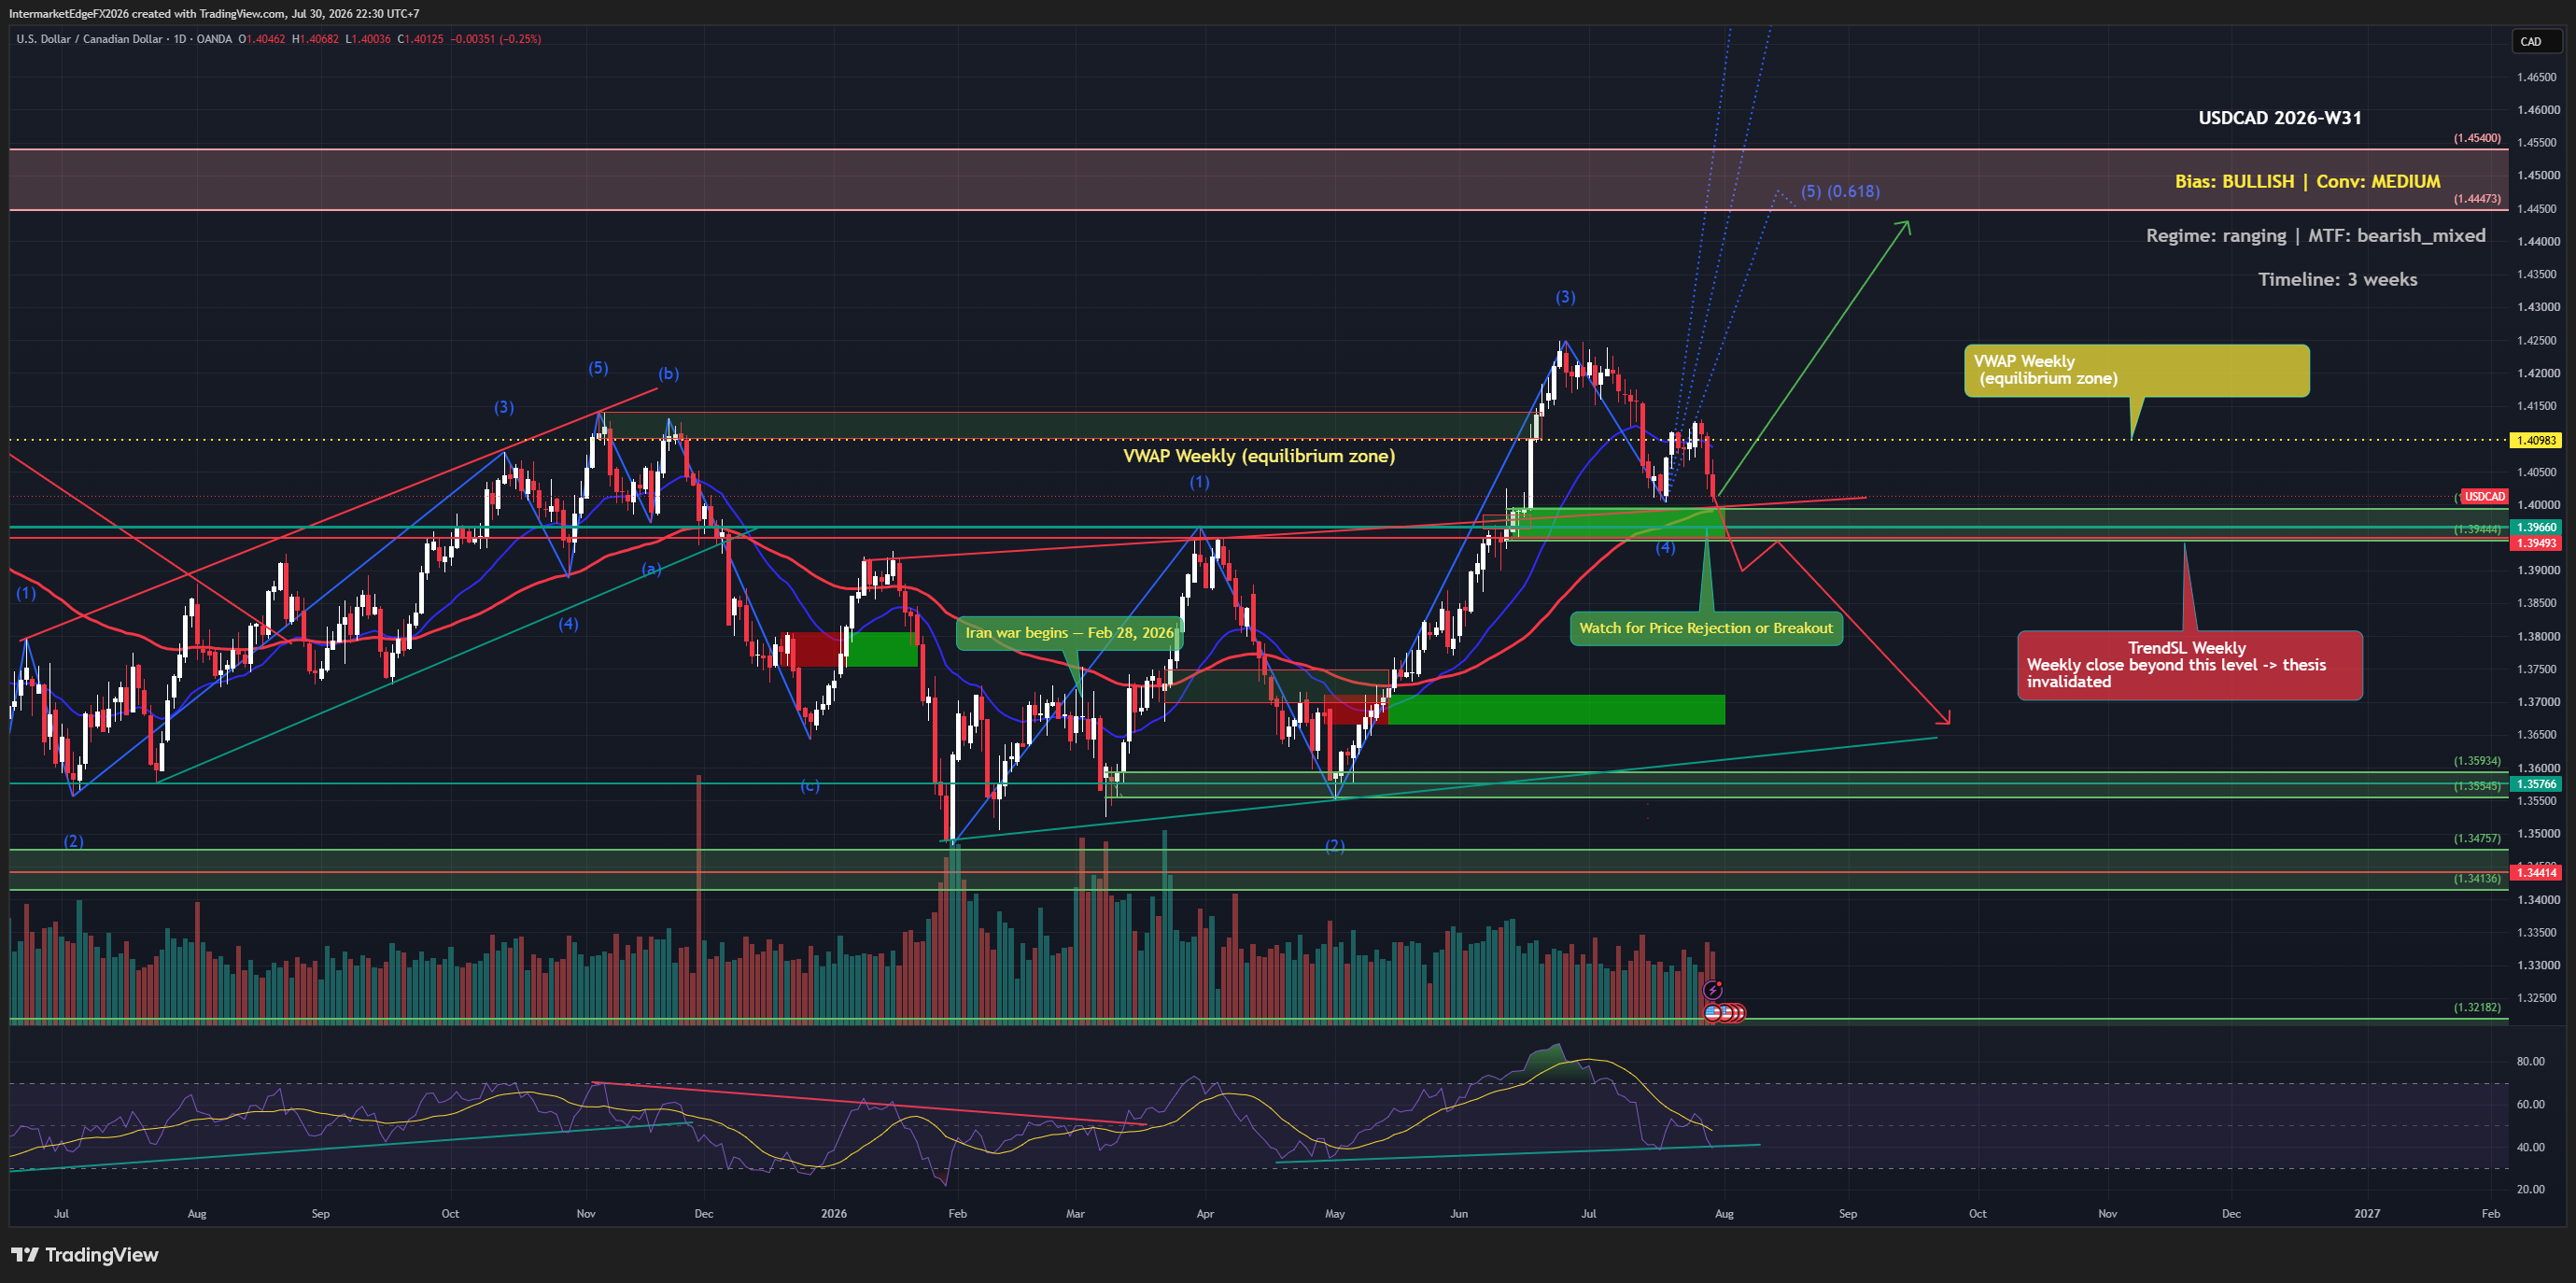
USDCAD 1.4232 | Double squeeze: 13-month DXY high + oil below $70 | 25 June 2026 CAD hits a 14-month low, pressured from both sides simultaneously. USD leg: 13-month high post-hawkish FOMC. CAD leg: oil broke below $70 and the pre-war 71.11 support. When both legs tilt the same way, this is the strongest bullish configuration. BoC Macklem today: not seeing spillovers from higher oil prices into CPI. Implicitly dovish, BoC in no hurry to hike. Canada benchmark yields slipping. CAD at a 14-month low as tech selloff drives safe-haven into USD. AUDUSD at 0.691, broad commodity FX weakness. CAD weakness is not idiosyncratic. D1 structure: wave (3) impulse running. Target 1.4447 then 1.4540. Support 1.4100 then 1.3993. Invalidation: below 1.3476. Three scenarios: → Wave (3) continues to 1.4447 then 1.4540. Probability: 45% → Sub-wave 4 correction to 1.40 then resumes. Probability: 25% → Oil bounces + dovish Fed, drops to 1.39. Probability: 15% The tell: both legs tilting simultaneously. DXY strongest in 13 months, CAD weakest in 14. Not a coincidence. A double squeeze. Conviction: High Bull (upgraded from Med-High). --- Intermarket Edge | Institutional Macro & Intermarket Analysis For informational purposes only. Not financial advice.

DXY - A 13-Month High After the FOMC Confirms Wave (3), a Wave (4) Pullback to 99.1 Sets Up the Wave (5) Push Toward 103-104

DXY - A 13-Month High After the FOMC Confirms Wave (3), a Wave (4) Pullback to 99.1 Sets Up the Wave (5) Push Toward 103-104

DXY 100.623 | 13-month high confirms wave (3), wave (4) pullback ahead | 22 June 2026 Last week the FOMC confirmed the direction. This week the dollar holds a 13-month high -- and the chart says the pullback before the next leg up is the trade to watch. Foundation: the FOMC under Warsh held + projected a hike later in 2026. DXY climbed to a 13-month high and held. The basket is uniform: EURUSD 1.1461, GBPUSD 1.3216, USDJPY 161.678. US yields elevated: US10Y 4.480%, US2Y jumped to 4.220%, real yield 0.280%. New wrinkle: Iran peace talks Round 1 ended but cracks emerged. The haven premium that drained last week is partially returning. The pipeline showed you the wrong numbers. CPI US: 2.4% (actual 4.2%). Fed: "Hold ~40% hike Apr 2027" (actual: hold + projected hike later 2026). BoJ: "Hold" (actual: hiked to 1.00%). JP10Y: 1.47% (actual: 2.660%). ECB: 2.50% cutting (actual: 2.00% neutral). D1 structure: a large impulse. (1) ~99, (2) ~95.5, (3) nearing completion ~101. Wave (4) pullback expected to 99.427/99.113, deeper to 98.549. Then wave (5) to 103.571 then 104.246-104.734. Invalidation: 97.695. Three scenarios: → Wave (4) to 99.4-99.1 then wave (5) to 103-104. Probability: 40% → Strong data or deeper Iran cracks, extension through 101 toward 103. Probability: 25% → Deeper wave (4) to 98.549, weak data triggers, then resume. Probability: 20% Event risk: Waller today, Flash PMI + ADP tomorrow. The tell: wave (4) pullback. Strong data skips it and extends to 103; weak data triggers the dip to 99.1 that sets up the real move. Do not chase at the 100.6 top. Conviction: Medium-High Bull structural. Intermarket Edge | Institutional Macro & Intermarket Analysis For informational purposes only. Not financial advice.

USDJPY - Wave (5) Exhaustion at the 161.94 Intervention Ceiling, the BoJ Hike Compresses the Spread to 1.81% as the Yen Hits a 23-Month Low

USDJPY - Wave (5) Exhaustion at the 161.94 Intervention Ceiling, the BoJ Hike Compresses the Spread to 1.81% as the Yen Hits a 23-Month Low

USDJPY 161.354 | Wave (5) exhaustion at the 161.94 intervention ceiling | 19 June 2026 The foundation says bullish. The ceiling says caution. Three capping forces converge at exactly the level where Japan's MOF has intervened before -- and the wave count says the impulse is running out of room. USD leg strong: FOMC 17/06 held + projected hike later this year, DXY ~101. Japan May CPI subdued (core +1.4%, core-core +1.8%), less BoJ urgency. Three capping forces: First, acute MOF intervention risk. The yen hit a 23-month low, Japan warned verbally, USDJPY beyond 160. When triggered: 300-500 pips in hours. Second, the BoJ hiked to 1.00% with hawkish guidance. JP10Y jumped to 2.640% (not the stale 1.47%). The real US-JP spread is just 1.811% -- nearly a third narrower than the pipeline's 2.981%. Third, wave (5) exhaustion at the 161.940 ceiling. The wave count expects completion then an (a)(b)(c) correction. The pipeline showed you the wrong number. JP10Y: 1.47% (stale). Actual: 2.640%. US-JP spread: 2.981%. Actual: 1.811%. D1 structure: impulse (1)~149, (2)~140, (3)~159, (4)~152, (5) now ~161.35, ceiling 161.940. Correction targets: 157.2 (0.382) / 155.2 (0.5) / 153.5 (0.618). Above 161.94 opens extension to 164. Three scenarios: → Wave (5) completes then correction to 155-157. Probability: 35% → MOF intervention, sharp drop to 155 then 152. Probability: 25% → Break above 161.94, extension to 164. Probability: 25% The tell: three forces at one ceiling. Wave (5), the MOF warning, and the compressed spread all point to 161.94. Above it, 164; below 160, the correction begins. Do not chase longs at 161. Conviction: Medium Bull structural, near-term correction lean. --- Intermarket Edge | Institutional Macro & Intermarket Analysis For informational purposes only. Not financial advice.

USDCAD - Wave (3) Impulse on Post-FOMC Dollar Strength, CAD at a 7-Month Low, a Wave (4) Pullback Sets Up the Wave (5) Push Toward 1.45

USDCAD - Wave (3) Impulse on Post-FOMC Dollar Strength, CAD at a 7-Month Low, a Wave (4) Pullback Sets Up the Wave (5) Push Toward 1.45

USDCAD 1.4115 | Wave (3) impulse on post-FOMC dollar strength | 18 June 2026 Two currencies moving in opposite directions met in one pair: the Fed projected a hike, and the Canadian dollar hit a 7-month low. The wave count says the big move hasn't started yet. USD leg: the FOMC on 17/06 held rates but projected a hike later in 2026 -- a hawkish dot plot. The dollar extended gains, DXY to a two-month high near 100.6. EUR/GBP/AUD all falling, confirming broad USD strength. CAD leg: the Canadian dollar at a 7-month low (newsfeed: "Canadian Dollar Hits 7-Month Low"). Crude ticked up to 74.46 but stays low after the war premium unwound -- pressure on CAD. The pipeline showed you the wrong numbers. Fed pipeline: "Hold 2026, hike Apr 2027." Actual: hold + projected hike later 2026 (hawkish, done). Pipeline CPI US 2.4%. Actual 4.2%, real yield 0.263%. D1 structure: a bullish Elliott impulse. (1) ~1.38, (2) ~1.347, (3) now ~1.414. Price at 1.4115, just below the 1.41388 resistance. The chart expects a wave (4) pullback to the fib region 1.39 (0.382) / 1.385 (0.5) / 1.378 (0.618), pivot 1.39660. Then wave (5) up to 1.44473 → 1.45400. Three scenarios: → Wave (4) to 1.39-1.385 then wave (5) up to 1.44473. Probability: 40% → Direct break above 1.41388 toward 1.44473, shallow pullback. Probability: 25% → Deeper wave (4) to 1.378 then resume up. Probability: 20% Invalidation: daily close below 1.347 (early warning: a break of 1.378). The tell: the wave (4) pullback. A hold above 1.378 with the dollar firm keeps the path to 1.45 alive. Position around the 1.39-1.385 fib region rather than chasing at the top. Conviction: Medium-High Bull. --- Intermarket Edge | Institutional Macro & Intermarket Analysis For informational purposes only. Not financial advice.

USOIL - The War Premium Fully Unwound to Pre-War Support, a Post-FOMC Bearish Tide Meets a Bullish -8.263M Draw

USOIL - The War Premium Fully Unwound to Pre-War Support, a Post-FOMC Bearish Tide Meets a Bullish -8.263M Draw

USOIL $73.58 | War premium fully unwound to pre-war support | 18 June 2026 Oil has handed back nearly the entire Iran-war rally and returned to where it started. Here, a bearish tide meets a bullish draw. The Iran war broke out Feb 28, lifting oil from ~57-70 to a 120 peak (April). The peace deal and the prospect of a Hormuz reopening have drained the haven premium steadily. Now 73.58, back in the pre-war zone. Last night's hawkish FOMC lifted DXY to ~100, VIX to 18.43, equities lower. A strong dollar plus demand risk is another bearish layer for oil. Add OPEC+ raising +411kbpd. But against the tide: the EIA draw was -8.263M (forecast just -3.6M, prior -7.227M). US supply is tightening -- a real support. The newsfeed agrees: "Tightness in US Crude Supplies Supports Prices." The pipeline showed you the wrong field. Pipeline EIA: "awaiting release." Actual: -8.263M. DXY now ~100 (jumped post-FOMC). D1 structure: key support 74.49-71.11 (pre-war zone). Resistance 78.06 → 80.74. A break of 71.11 opens 67-68 → 63.57. Three scenarios: → Hold 71.11 + inventory tightness: technical bounce toward 78-80. Probability: 35% → Break 71.11 (Hormuz fully reopens + OPEC + strong dollar): toward 67 then 63. Probability: 35% → Standoff, bearish macro vs bullish draw: 71-78. Probability: 30% Invalidation: daily close above 80.74. The tell: the 71.11 support against the inventory draws. A break with Hormuz fully reopening sends oil to 67; a hold on tightness bounces it to 78. Do not chase shorts into 71.11. Conviction: Medium Bear at support, two-sided. Intermarket Edge | Institutional Macro & Intermarket Analysis For informational purposes only. Not financial advice.

EURUSD - Wave (c) Correction Lower After the 1.21 Top, the DE-US Spread at -1.51% Reinforces the USD Carry Advantage Into the FOMC

EURUSD - Wave (c) Correction Lower After the 1.21 Top, the DE-US Spread at -1.51% Reinforces the USD Carry Advantage Into the FOMC

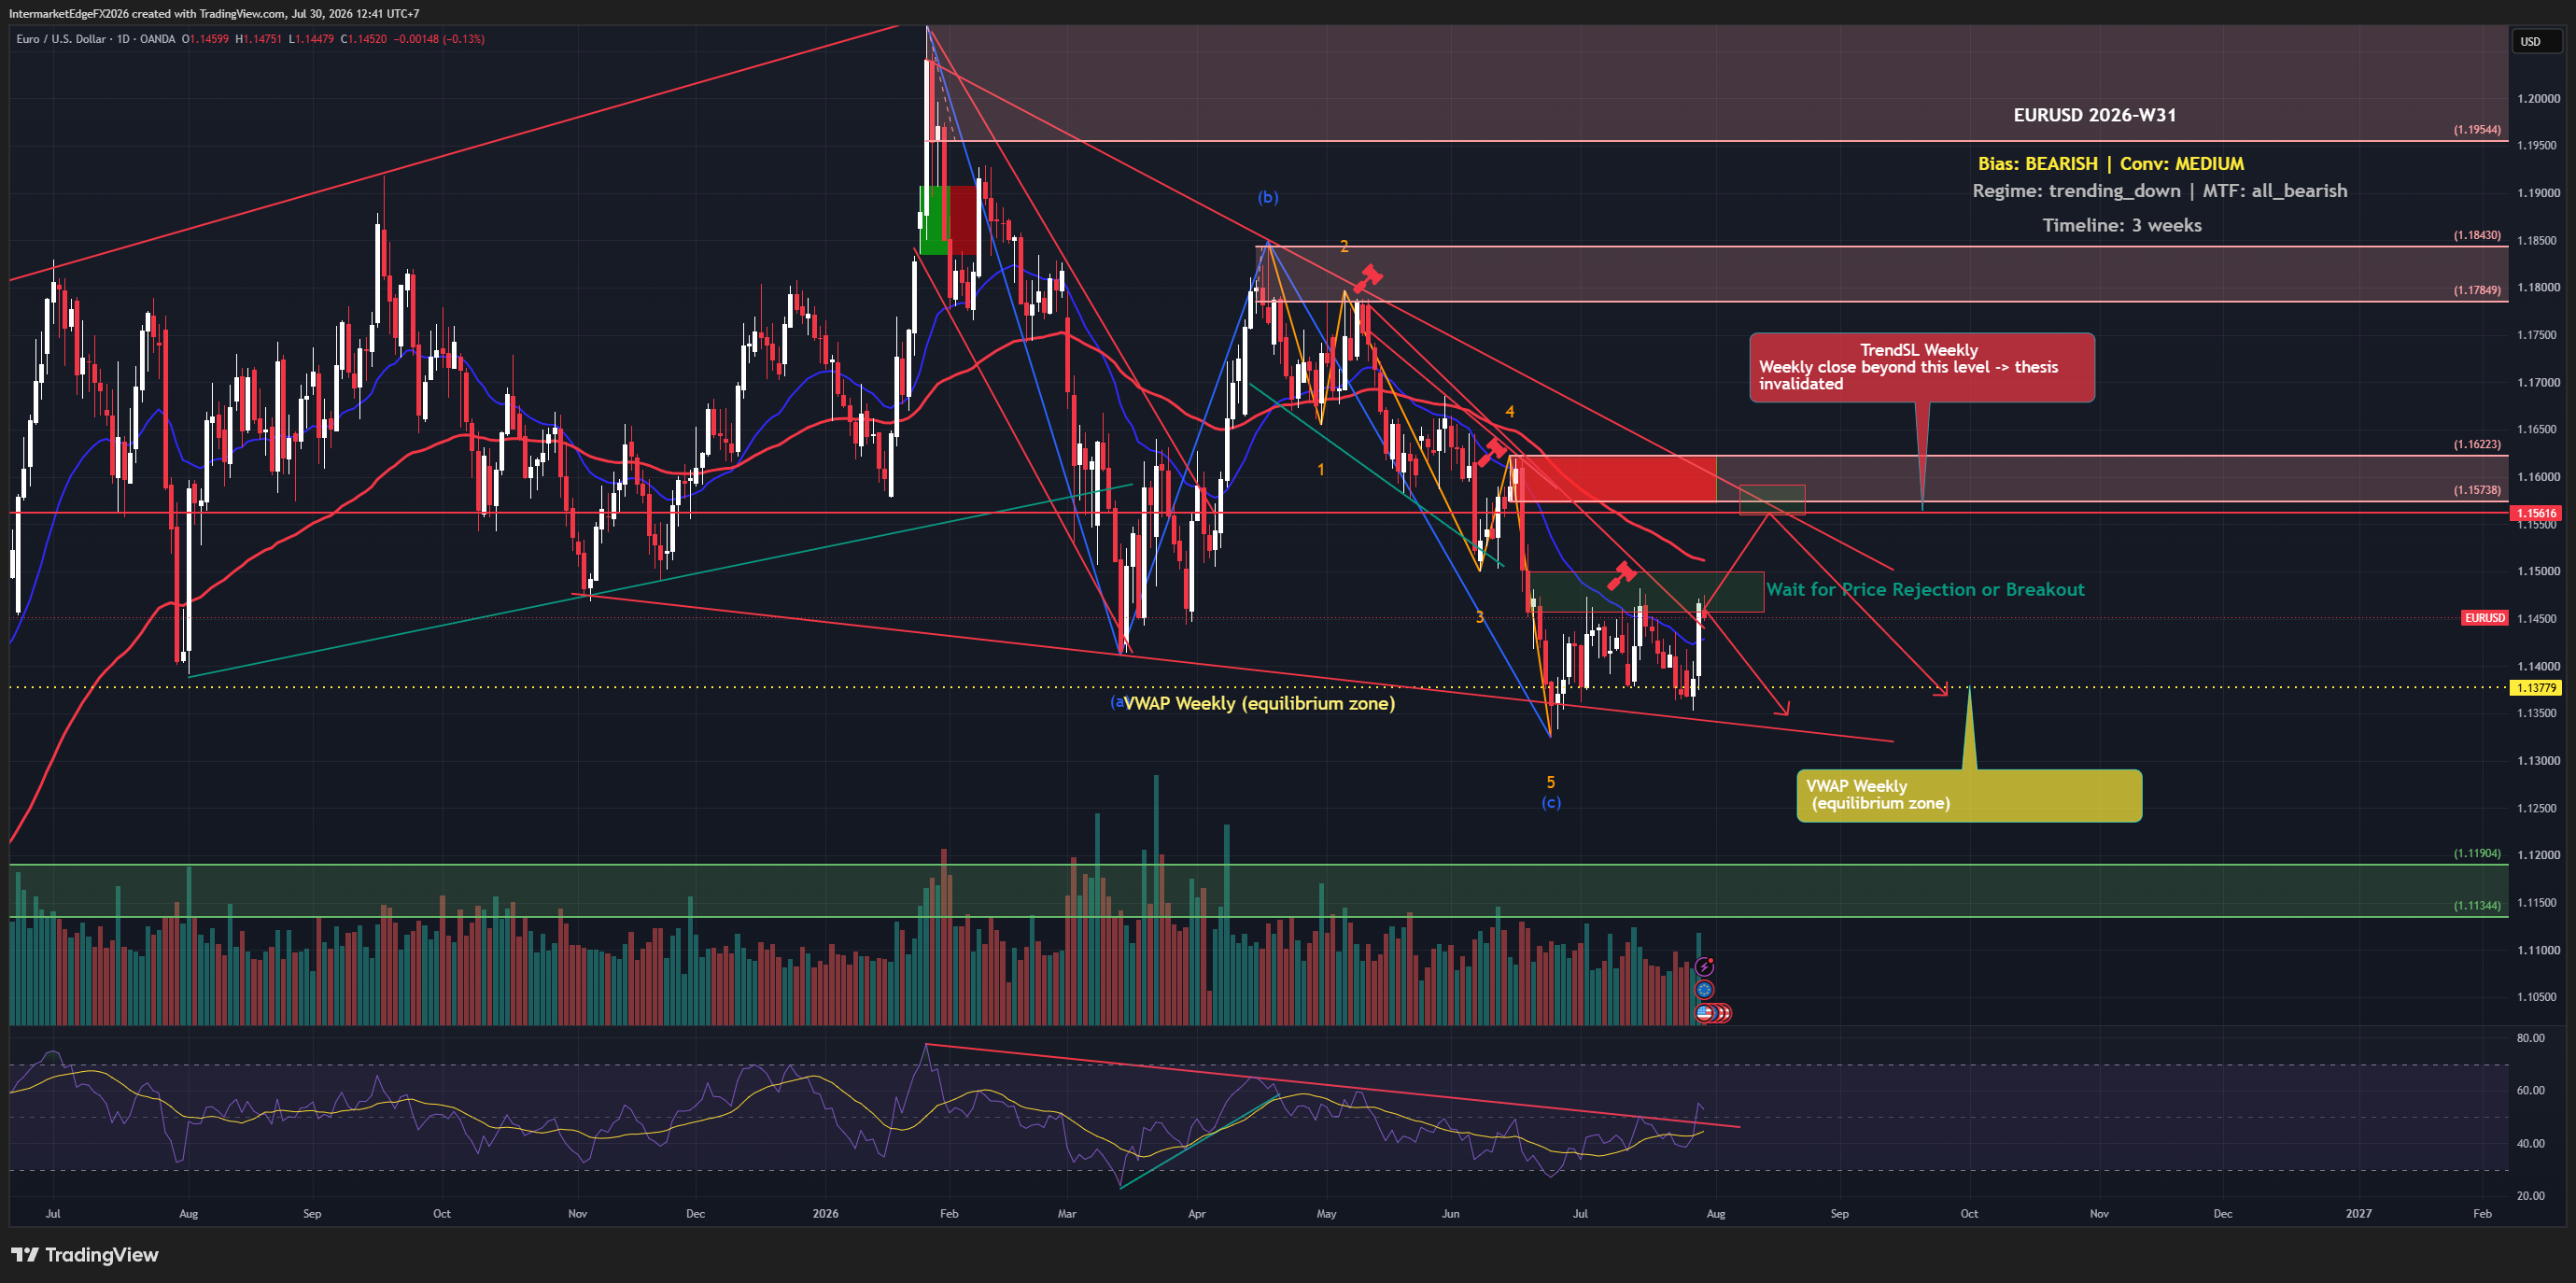
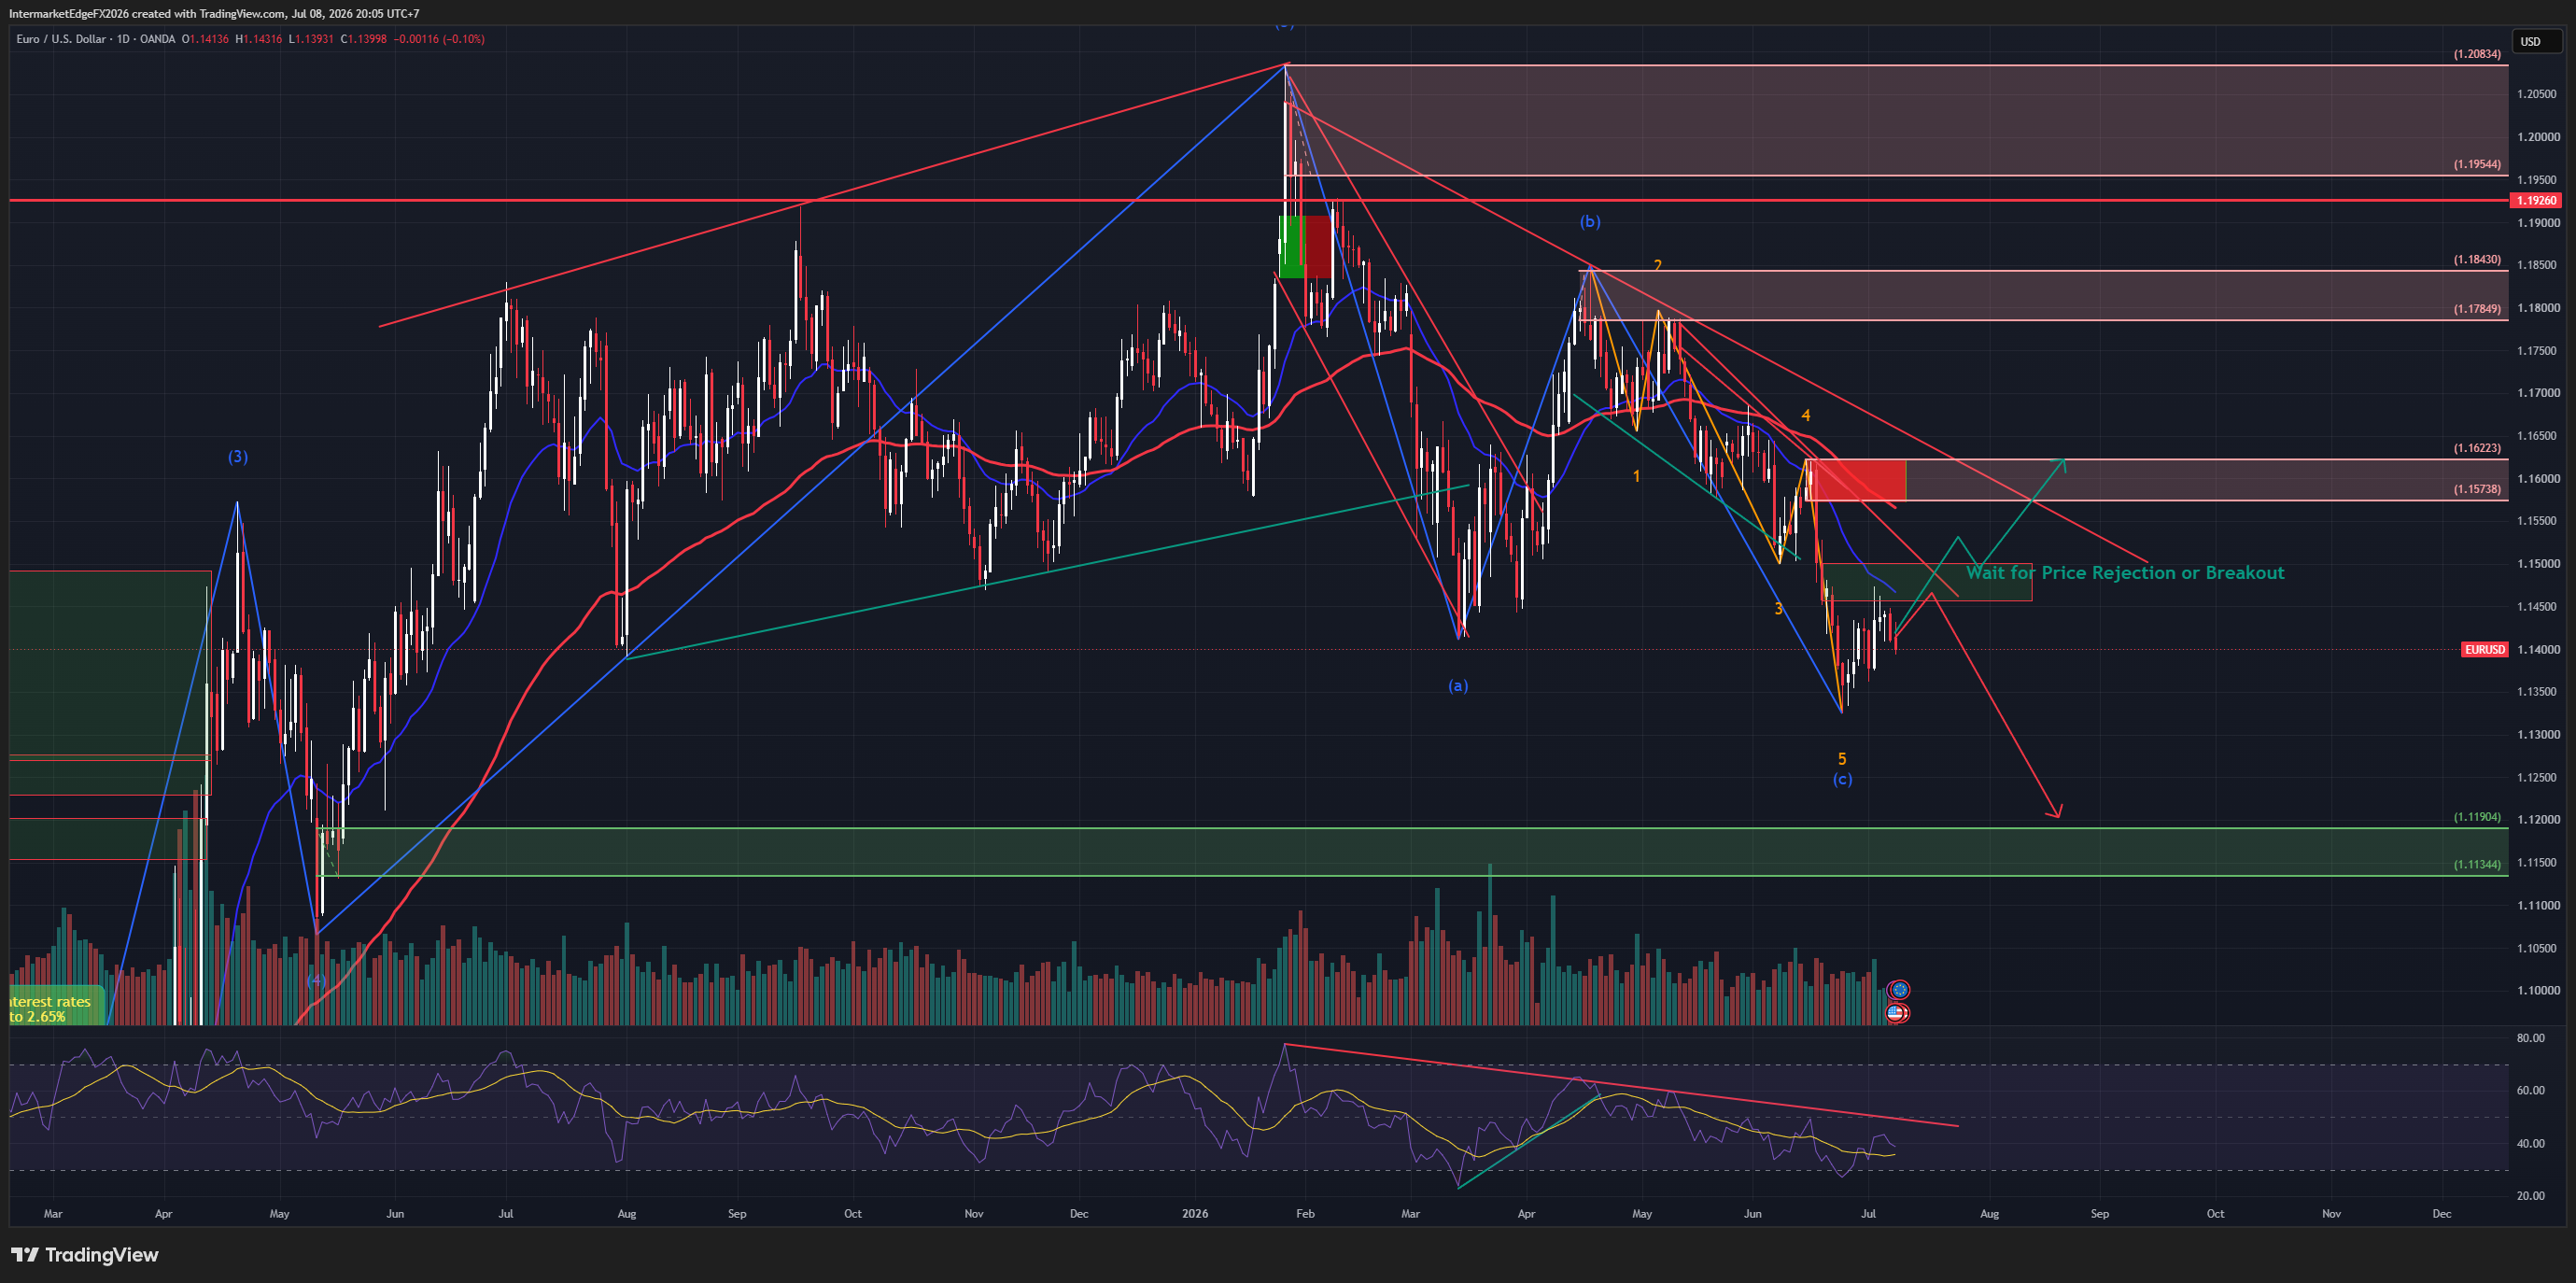
EURUSD 1.1595 | Wave (c) lower meets the Warsh dot plot tonight | 17 June 2026 The structure and the yield spread both point down. One event tonight decides the pace. The Elliott Wave count on the D1 is clean: EURUSD completed a five-wave impulse to the wave (5) top near 1.21 (Feb), then an ABC correction: (a) ~1.142, (b) ~1.182, and wave (c) now running lower. Price at 1.1595 sits inside wave (c). The yield foundation reinforces the decline. The DE-US spread is -1.510% -- US yields 1.51 points above German, a strong USD carry advantage. The ECB at 2.00% sits below the Fed. The pipeline is showing you the wrong numbers. Pipeline CPI US: 2.4% (stale). Actual: 4.2%, real yield 0.238%. Pipeline ECB: 2.50% cutting. Actual: 2.00% neutral hold. Chart header price 1.16416 is an artifact -- actual ~1.1595. D1 structure: key support 1.14100 (wave a low). Near wave (c) target: 1.145 → 1.141. A break opens the deeper projection 1.10-1.105. Resistance: descending trendline 1.165-1.168, then the wave (b) top ~1.182. Pre-FOMC EUR scenarios: → Hawkish, hike dot: break below 1.145 toward 1.141 then 1.10-1.105. Probability: 40% → Dovish, no hike dot: bounce to the trendline 1.165-1.168. Probability: 25% → Neutral, balanced dots: drift in wave (c) 1.155-1.165. Probability: 25% Wave-count invalidation: daily close above ~1.182. The tell: tonight's dot plot. A hike dot accelerates wave (c) toward 1.141; a dovish hold bounces EURUSD to the trendline. Do not chase ahead of the dot plot. Conviction: Medium-High Bear. Intermarket Edge | Institutional Macro & Intermarket Analysis For informational purposes only. Not financial advice.

DXY - Safe-Haven Premium Unwinds After Hormuz MOU, Entering the BoJ and Fed Decision Week

DXY - Safe-Haven Premium Unwinds After Hormuz MOU, Entering the BoJ and Fed Decision Week

DXY Spotlight: The Haven Premium Drains, the Dot Plot Decides The dollar index opens the week at 99.157, a ten-day low, as the confirmed US-Iran memorandum over the Strait of Hormuz drains the war premium that had propped the greenback through the conflict phase. The reversal is broad and immediate. The volatility index collapsed more than nine percent to 17.67, the S&P 500 climbed 1.20 percent to 7,520, crude sank 4.38 percent with WTI at 80.59, and the yuan pushed to a three-year high. This is no longer a haven trade. It is a transitional regime where a tactical downside lean prevails until the first dot plot under Warsh resolves the structural question. On the daily, the index completed a five-wave impulse into the 101.5 peak in March, then turned corrective. Wave (a) fell to 98.0, wave (b) bounced to test the 100.032 to 100.398 resistance band and failed precisely at the 100.40 invalidation, and wave (c) is now unfolding lower. The measured target sits at 98.64, then 97.695, extending toward 97.05 should momentum build. The 98.00 pivot is the line that matters: a decisive close beneath it confirms acceleration. The structural anchor is the real yield. Subtract the 4.2 percent May CPI from the 4.428 percent ten-year and you get roughly 0.23 percent, far beneath the one percent threshold that would cement a durable dollar uptrend. Until inflation cools or the Fed hikes, the ceiling holds. That is why gold can rise 2.58 percent to 4,327 even as risk appetite recovers; de-dollarization demand and low real yields are dominating, and the inverse gold-dollar correlation is reinforcing the downside. The basket mechanics lean the same way. The euro, 57.6 percent of the index, rose to 1.1614 and drags the dollar lower directly, while USDJPY at 160.04 stalls into the Bank of Japan. Two events define the week. The Bank of Japan meets June 16 with a sixty-six percent hike probability, and with Ueda hospitalized, Uchida holds the press conference whose first hundred word

XAUUSD — Why War Is Bearish for Gold, NFP at 172K Flips the Rate Hike to 74% Probability, and the $4,296 Support Is the Last Line

XAUUSD — Why War Is Bearish for Gold, NFP at 172K Flips the Rate Hike to 74% Probability, and the $4,296 Support Is the Last Line

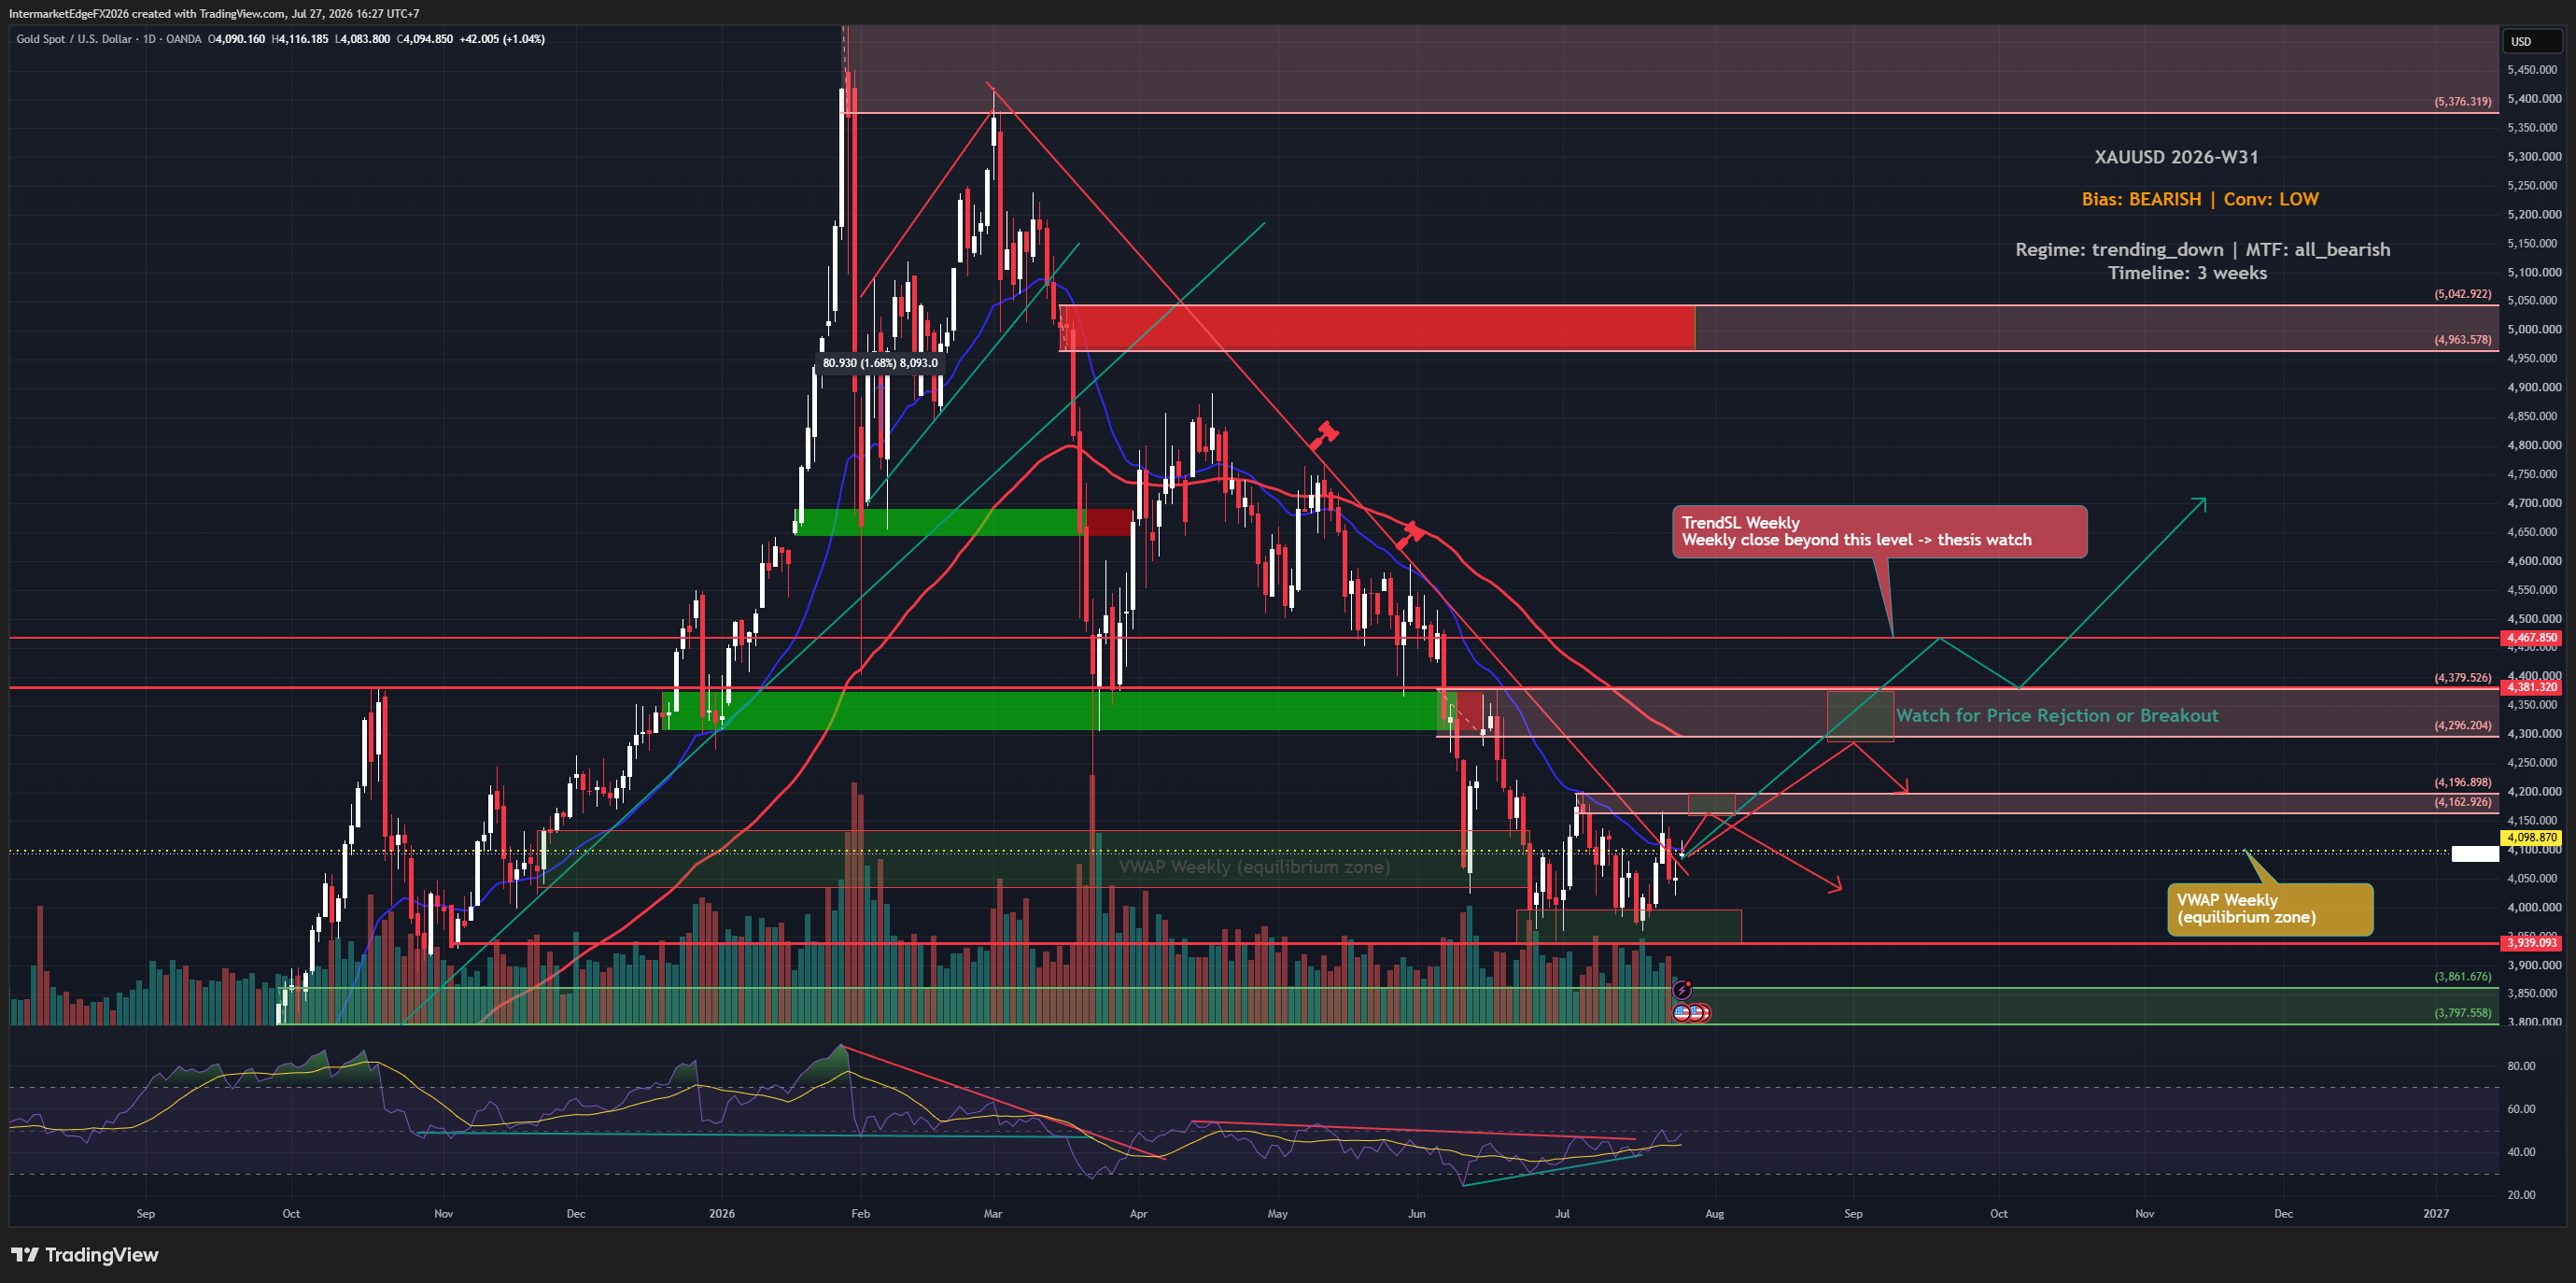
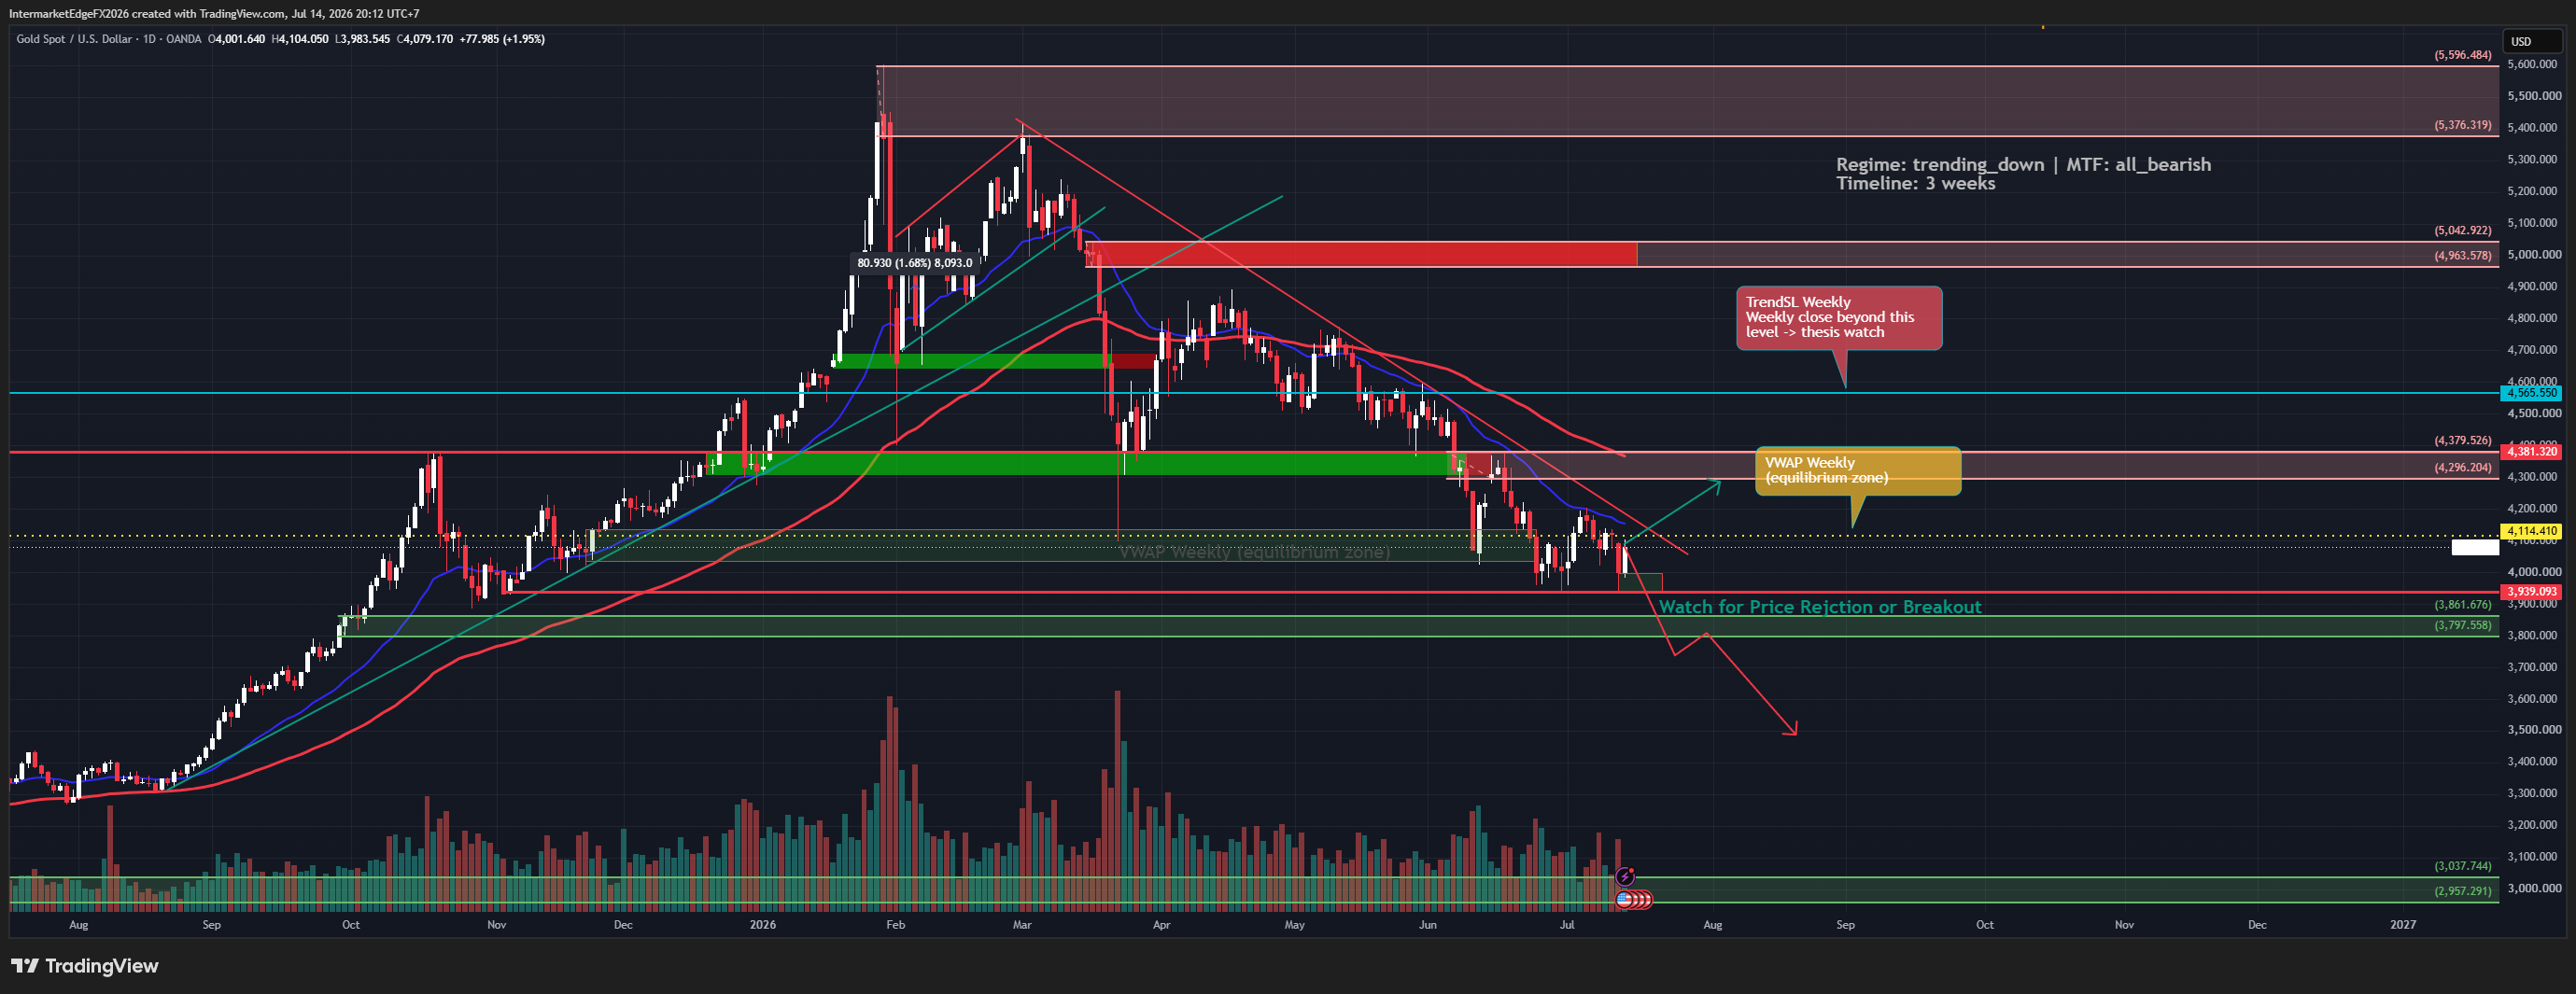
XAUUSD $4,355 | NFP 172K | Hike odds 74.8% | 08 June 2026 Gold hit $4,268 today — its lowest price in more than two months. The safe-haven role has been taken by the US dollar, drawing additional support from higher Treasury yields. FXStreet May NFP came in at 172,000 — nearly double the 85K forecast. Fed hike probability has jumped from 53.5% last week to 74.8% today. Before the NFP report, odds of a 2026 hike were about 50%. Now they're about 70%, making a hike the market's base case. MarketPulse The most important insight: in this regime, war is bearish for gold — not bullish. The mechanism: Iran-Israel re-escalation → oil spike → inflation re-acceleration → Fed hike probability surges → real yields rise → dollar strengthens → gold falls. The renewed war is driving up oil and making people afraid of inflation — not making them want to buy gold as a safe haven. MarketPulse Real yield corrected: 0.724% — still below the 1% structural threshold. CB accumulation (PBoC 17+ months, Poland +14t) provides a structural floor. The structural bull case is under pressure but not broken. XAU/USD has fallen below the key 200-day SMA — first time since the Iran war began. FXStreet Support: $4,135-$4,296. Invalidation: daily close below $4,036-$4,061. Do not add directional exposure before CPI Wednesday June 11. Conviction: Medium-High Bear (tactical), Conditionally Bullish (structural).

Stay in the loop

Get notified about new research, macro insights, and market analysis.

InterMarketEdge

© 2026 InterMarketEdge. Financial intelligence for inter-market traders.